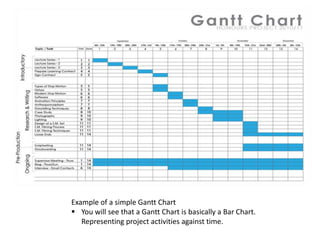
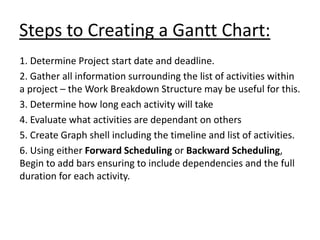
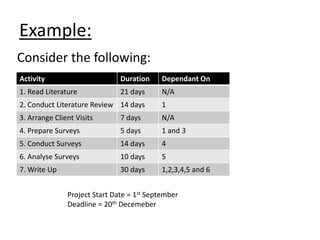
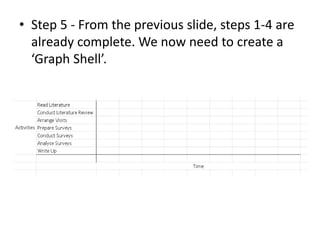
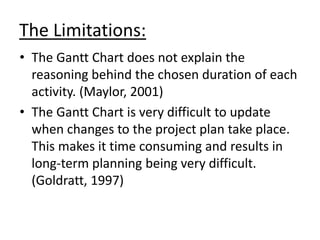
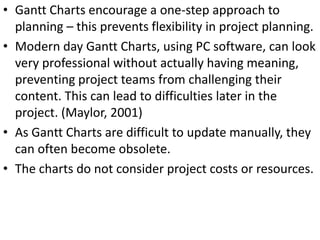
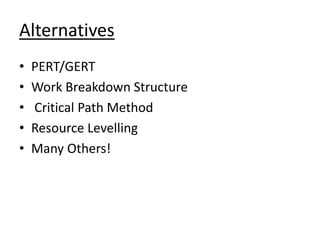
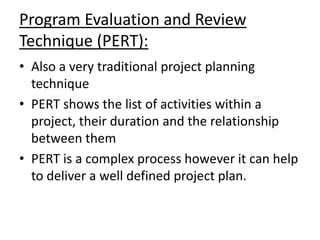
A Gantt chart is used to illustrate the relationship between project activities and time, depicting multiple activities on a single chart for easy understanding of project scheduling. It can be created through forward or backward scheduling methods, involving steps such as determining project dates, gathering activity details, and plotting dependencies. While Gantt charts provide a clear overview and are user-friendly, they also have limitations such as difficulty in updating, lack of cost/resource consideration, and issues with flexibility in project planning.