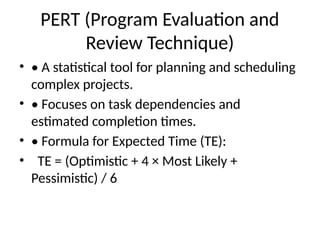
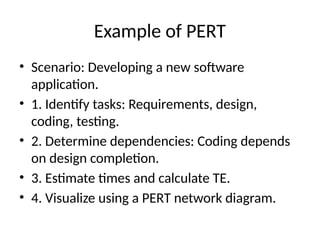
Scheduling in Project
Management
Understanding PERT and Gantt
Charts with Examples
Introduction to Scheduling
• Scheduling is the process of planning and
organizing tasks to achieve project objectives
within a specific timeframe. It ensures timely
completion, optimizes resource allocation, and
identifies potential bottlenecks.
PERT (Program Evaluation and
Review Technique)
• • A statistical tool for planning and scheduling
complex projects.
• • Focuses on task dependencies and
estimated completion times.
• • Formula for Expected Time (TE):
• TE = (Optimistic + 4 × Most Likely +
Pessimistic) / 6
Example of PERT
• Scenario: Developing a new software
application.
• 1. Identify tasks: Requirements, design,
coding, testing.
• 2. Determine dependencies: Coding depends
on design completion.
• 3. Estimate times and calculate TE.
• 4. Visualize using a PERT network diagram.
Gantt Charts
• • A bar chart that illustrates a project
schedule.
• • Shows tasks, durations, and progress over
time.
• • Tracks overlapping tasks and deadlines.
Example of Gantt Chart
• Scenario: Event planning for a conference.
• 1. Identify tasks: Venue booking, invitations,
catering, setup, execution.
• 2. Assign durations and plot tasks on a
timeline.
• 3. Visualize with a Gantt chart showing task
bars spanning their durations.
Comparing PERT and Gantt Charts
• Feature | PERT | Gantt
• ----------------------------------------------------
• Focus | Task dependencies | Timeline
and progress
• Best For | Complex, uncertain projects |
Simple, routine projects
• Visualization| Network diagram | Bar
chart
• Estimates | Probabilistic |
Deterministic
Benefits of Using Both
• • PERT identifies dependencies and risks.
• • Gantt provides a clear timeline and progress
tracking.
• • Together, they enhance planning and
implementation.
Practical Applications
• PERT:
• • Research and development projects.
• • Construction planning.
• Gantt:
• • Event planning.
• • Routine operations management.
Conclusion
• • Effective scheduling is critical for project
success.
• • PERT excels in planning and analyzing
uncertainties.
• • Gantt charts simplify tracking and updating
schedules.
• • Use these tools to enhance project efficiency
and outcomes.

Project_Management_Scheduling_PERT_Gantt.pptx

  • 1.
    Scheduling in Project Management UnderstandingPERT and Gantt Charts with Examples
  • 2.
    Introduction to Scheduling •Scheduling is the process of planning and organizing tasks to achieve project objectives within a specific timeframe. It ensures timely completion, optimizes resource allocation, and identifies potential bottlenecks.
  • 3.
    PERT (Program Evaluationand Review Technique) • • A statistical tool for planning and scheduling complex projects. • • Focuses on task dependencies and estimated completion times. • • Formula for Expected Time (TE): • TE = (Optimistic + 4 × Most Likely + Pessimistic) / 6
  • 4.
    Example of PERT •Scenario: Developing a new software application. • 1. Identify tasks: Requirements, design, coding, testing. • 2. Determine dependencies: Coding depends on design completion. • 3. Estimate times and calculate TE. • 4. Visualize using a PERT network diagram.
  • 5.
    Gantt Charts • •A bar chart that illustrates a project schedule. • • Shows tasks, durations, and progress over time. • • Tracks overlapping tasks and deadlines.
  • 6.
    Example of GanttChart • Scenario: Event planning for a conference. • 1. Identify tasks: Venue booking, invitations, catering, setup, execution. • 2. Assign durations and plot tasks on a timeline. • 3. Visualize with a Gantt chart showing task bars spanning their durations.
  • 7.
    Comparing PERT andGantt Charts • Feature | PERT | Gantt • ---------------------------------------------------- • Focus | Task dependencies | Timeline and progress • Best For | Complex, uncertain projects | Simple, routine projects • Visualization| Network diagram | Bar chart • Estimates | Probabilistic | Deterministic
  • 8.
    Benefits of UsingBoth • • PERT identifies dependencies and risks. • • Gantt provides a clear timeline and progress tracking. • • Together, they enhance planning and implementation.
  • 9.
    Practical Applications • PERT: •• Research and development projects. • • Construction planning. • Gantt: • • Event planning. • • Routine operations management.
  • 10.
    Conclusion • • Effectivescheduling is critical for project success. • • PERT excels in planning and analyzing uncertainties. • • Gantt charts simplify tracking and updating schedules. • • Use these tools to enhance project efficiency and outcomes.