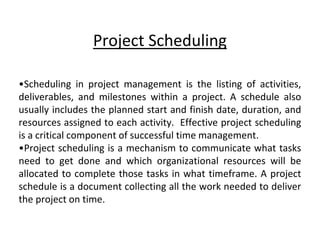
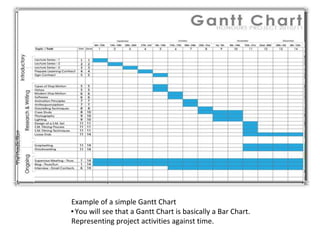
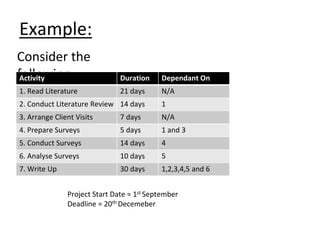
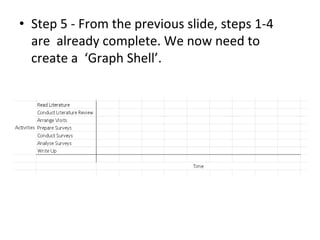
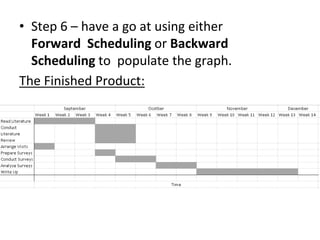
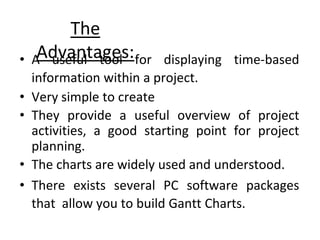
5. Project Scheduling
•Scheduling in project management is the listing of activities,
deliverables, and milestones within a project. A schedule also
usually includes the planned start and finish date, duration, and
resources assigned to each activity. Effective project scheduling
is a critical component of successful time management.
•Project scheduling is a mechanism to communicate what tasks
need to get done and which organizational resources will be
allocated to complete those tasks in what timeframe. A project
schedule is a document collecting all the work needed to deliver
the project on time.
6. Scheduling Process
The processes for building a schedule usually refers to
the first six processes of time management:
1.Plan schedule management.
2.Define project activities.
3.Sequence activities.
4.Estimate resources.
5.Estimate durations.
6.Develop the project schedule.
7. Types of schedule
1. Master project schedule. A master schedule tends to be a simplified list
of tasks with a timeline or project calendar.
1. Milestone schedule or summary schedule. This type of schedule tracks
major milestones and key deliverables, but not every task required to
complete the project.
1. A detailed project schedule. This is the most thorough project schedule,
as it identifies and tracks every project activity. If you have a complex,
large, or lengthy project, it’s important to have a detailed project
schedule to help track everything.
8. Benefits of project scheduling
1. Assists with tracking, reporting on, and
communicating progress.
2. Ensures everyone is on the same page as far as
tasks, dependencies, and deadlines.
3. Helps highlight issues and concerns, such as a lack of
resources.
4. Helps identify task relationships.
5. Can be used to monitor progress and identify issues
early.
10. The Purpose of a Gantt
Chart:
• To illustrate the relationship between project
activities & time.
• To show the multiple project activities on one
chart
• To provide a simple & easy to understand
representation of project scheduling
11. Example of a simple Gantt Chart
▪You will see that a Gantt Chart is basically a Bar Chart.
Representing project activities against time.
12. Creating a Gantt
Chart:
There are two methods to creating a Gantt Chart (Maylor,
2005).
1.Using a Forward Schedule: starting with the list of activities
and a given start date (6th Sept in previous example) follow them
forwards in time until you hit given deadline.
2.Using a Backward Schedule: look at the deadline, from that
date work in the logical list of activities.
Both of these methods allow you to ensure that all necessary
activities can possibly be completed within the given project
time frame.
13. Steps to Creating a Gantt
Chart:
1. Determine Project start date and deadline.
2. Gather all information surrounding the list of activities within
a project – the Work Breakdown Structure may be useful for
this.
3. Determine how long each activity will take
4. Evaluate what activities are dependant on others
5. Create Graph shell including the timeline and list of activities.
6. Using either Forward Scheduling or Backward Scheduling,
Begin to add bars ensuring to include dependencies and the
full duration for each activity.
14. Example:
Consider the
following:
Activity Duration Dependant On
1. Read Literature 21 days N/A
2. Conduct Literature Review 14 days 1
3. Arrange Client Visits 7 days N/A
4. Prepare Surveys 5 days 1 and 3
5. Conduct Surveys 14 days 4
6. Analyse Surveys 10 days 5
7. Write Up 30 days 1,2,3,4,5 and 6
Project Start Date = 1st September
Deadline = 20th Decemeber
15. • Step 5 - From the previous slide, steps 1-4
are already complete. We now need to
create a ‘Graph Shell’.
16. • Step 6 – have a go at using either
Forward Scheduling or Backward
Scheduling to populate the graph.
The Finished Product:
17. The
Advantages:
• A useful tool for displaying time-based
information within a project.
• Very simple to create
• They provide a useful overview of project
activities, a good starting point for project
planning.
• The charts are widely used and understood.
• There exists several PC software packages
that allow you to build Gantt Charts.
18. The
Limitations:
• The Gantt Chart does not explain the
reasoning behind the chosen duration of
each activity. (Maylor, 2001)
• The Gantt Chart is very difficult to update
when changes to the project plan take place.
This makes it time consuming and results in
long-term planning being very difficult.
(Goldratt, 1997)
19. • Gantt Charts encourage a one-step approach to
planning – this prevents flexibility in project planning.
• Modern day Gantt Charts, using PC software, can
look very professional without actually having
meaning, preventing project teams from challenging
their content. This can lead to difficulties later in the
project. (Maylor, 2001)
• As Gantt Charts are difficult to update manually, they
can often become obsolete.
• The charts do not consider project costs or resources.