Downloaded 1,326 times


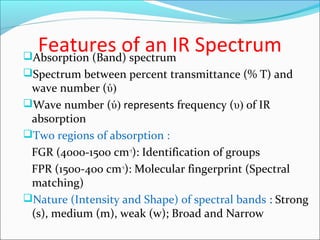
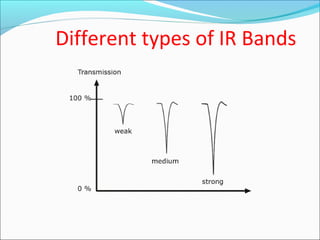
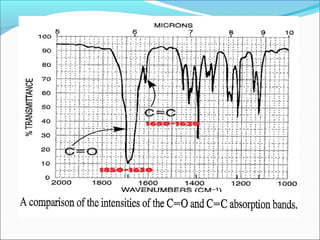
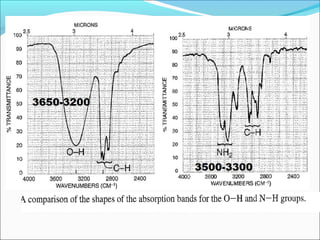
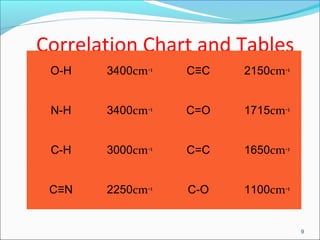
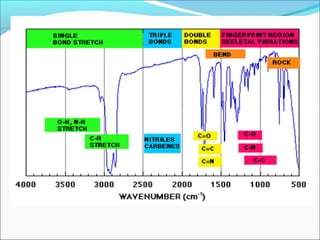
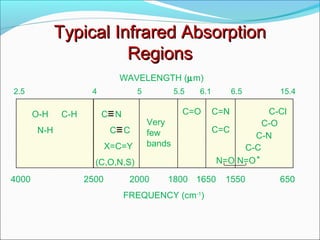
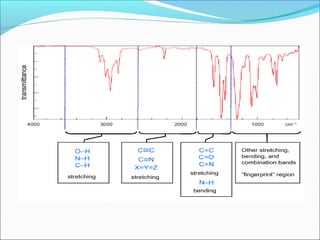
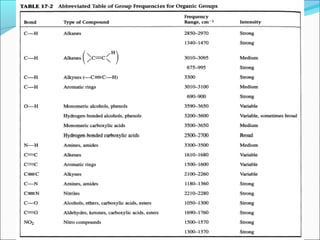
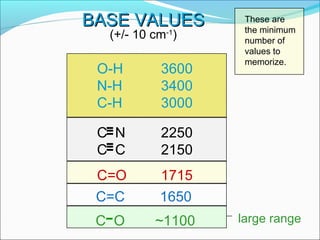
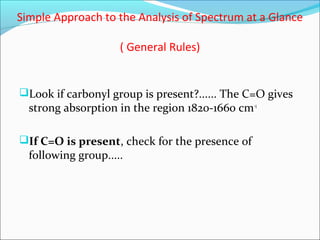
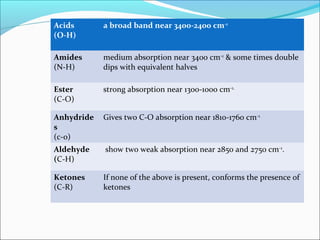
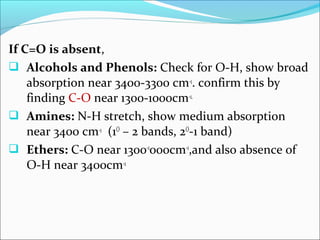


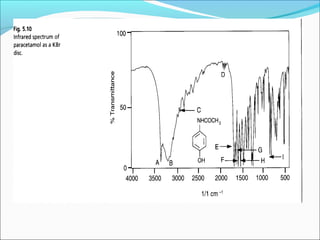
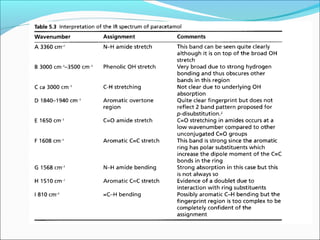
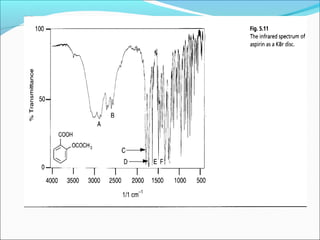
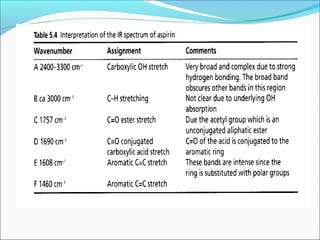


This document provides guidance on interpreting infrared spectra. It outlines the key features of an IR spectrum and the types of information that can be obtained, such as identifying functional groups present between 4000-1500 cm-1 and determining molecular fingerprints from 1500-400 cm-1. It reviews the requirements for interpretation and general rules for analysis, such as looking for carbonyl groups between 1820-1660 cm-1 and associated functional groups. Common absorption regions for functional groups like O-H, C=O, C-H and others are also presented to aid analysis. Examples of drug spectra are provided for illustration.


