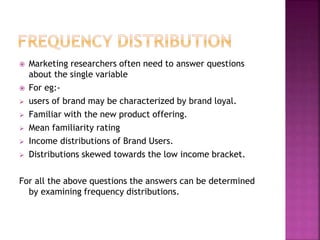
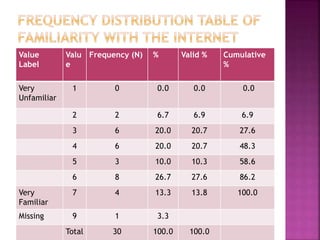
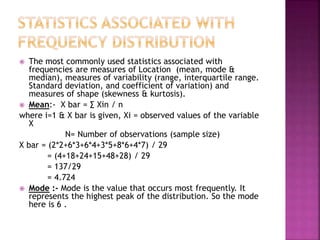
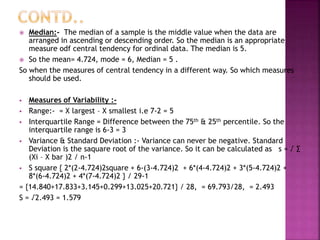
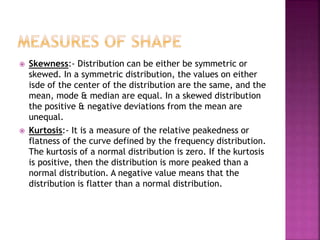
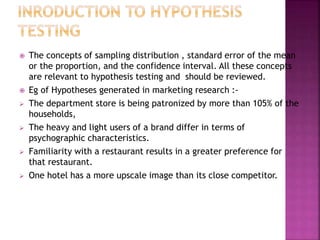
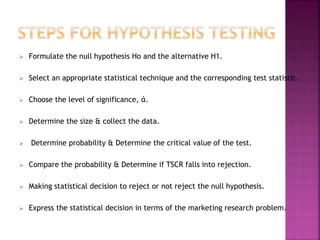
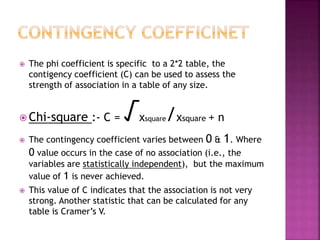
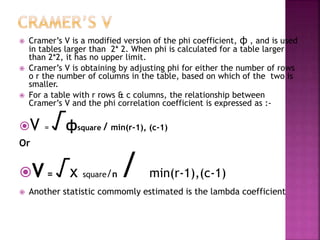
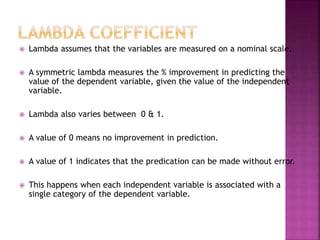
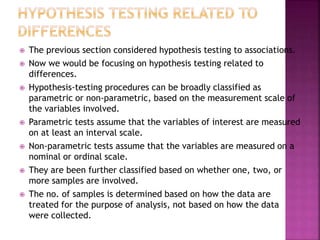
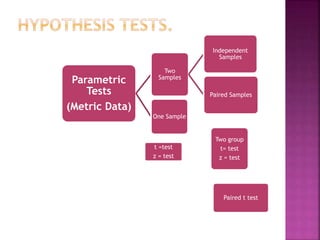
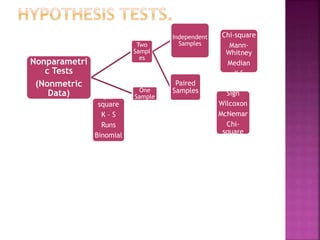
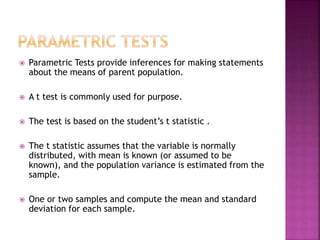
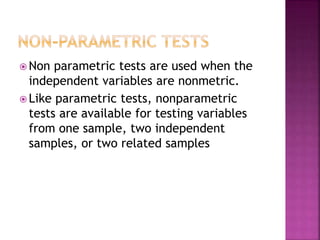
SlideShare a Scribd company logo
Presented to:Prof.Rahul Dalvi
Presented By :- Anshu Tiwari
Roll No:- 2012098









Marketing researchers often need to answer questions
about the single variable
For eg:users of brand may be characterized by brand loyal.
Familiar with the new product offering.
Mean familiarity rating
Income distributions of Brand Users.
Distributions skewed towards the low income bracket.

For all the above questions the answers can be determined
by examining frequency distributions.
Value
Label
Very
Unfamiliar

Valu Frequency (N)
e

%

Valid %

Cumulative
%

1

0

0.0

0.0

0.0

2

2

6.7

6.9

6.9

3

6

20.0

20.7

27.6

4

6

20.0

20.7

48.3

5

3

10.0

10.3

58.6

6

8

26.7

27.6

86.2

Very
Familiar

7

4

13.3

13.8

100.0

Missing

9

1

3.3

Total

30

100.0

100.0
The most commonly used statistics associated with
frequencies are measures of Location (mean, mode &
median), measures of variability (range, interquartile range.
Standard deviation, and coefficient of variation) and
measures of shape (skewness & kurtosis).
 Mean:- X bar = ∑ Xin / n
where i=1 & X bar is given, Xi = observed values of the variable
X
N= Number of observations (sample size)
X bar = (2*2+6*3+6*4+3*5+8*6+4*7) / 29
= (4+18+24+15+48+28) / 29
= 137/29
= 4.724
 Mode :- Mode is the value that occurs most frequently. It
represents the highest peak of the distribution. So the mode
here is 6 .

Median:- The median of a sample is the middle value when the data are
arranged in ascending or descending order. So the median is an appropriate
measure odf central tendency for ordinal data. The median is 5.
 So the mean= 4.724, mode = 6, Median = 5 .
So when the measures of central tendency in a different way. So which measures
should be used.


Measures of Variability : Range:- = X largest – X smallest i.e 7-2 = 5
 Interquartile Range = Difference between the 75th & 25th percentile. So the
interquartile range is 6-3 = 3
 Variance & Standard Deviation :- Variance can never be negative. Standard
Deviation is the saquare root of the variance. So it can be calculated as s = √ ∑
(Xi – X bar )2 / n-1
 S square { 2*(2-4.724)2square + 6-(3-4.724)2 + 6*(4-4.724)2 + 3*(5-4.724)2 +
8*(6-4.724)2 + 4*(7-4.724)2 } / 29-1
= {14.840+17.833+3.145+0.299+13.025+20.721} / 28, = 69.793/28, = 2.493
S = √2.493 = 1.579





Skewness:- Distribution can be either be symmetric or
skewed. In a symmetric distribution, the values on either
isde of the center of the distribution are the same, and the
mean, mode & median are equal. In a skewed distribution
the positive & negative deviations from the mean are
unequal.
Kurtosis:- It is a measure of the relative peakedness or
flatness of the curve defined by the frequency distribution.
The kurtosis of a normal distribution is zero. If the kurtosis
is positive, then the distribution is more peaked than a
normal distribution. A negative value means that the
distribution is flatter than a normal distribution.











The concepts of sampling distribution , standard error of the mean
or the proportion, and the confidence interval. All these concepts
are relevant to hypothesis testing and should be reviewed.
Eg of Hypotheses generated in marketing research :The department store is being patronized by more than 105% of the
households,
The heavy and light users of a brand differ in terms of
psychographic characteristics.
Familiarity with a restaurant results in a greater preference for
that restaurant.
One hotel has a more upscale image than its close competitor.


Formulate the null hypothesis Ho and the alternative H1.



Select an appropriate statistical technique and the corresponding test statistic.



Choose the level of significance, ά.



Determine the size & collect the data.



Determine probability & Determine the critical value of the test.



Compare the probability & Determine if TSCR falls into rejection.



Making statistical decision to reject or not reject the null hypothesis.



Express the statistical decision in terms of the marketing research problem.


Two Variables :- Cross tabulation is also know as bivariate crosstabulation. Consider again the cross-tabulation of Internet usage
with sex (male & female).



Three Variables:- The third variable clarifies the initial association (or lack
of it) observed between the two variables.





Reveal Suppressed Association - Over here the researcher suspected desire to travel
abroad may be influenced by age. However, a cross-tabulation of the two variables
produced the result.

General Comments on Cross-Tabulation:More than three variables can be cross-tabulated, but the
interpretation is quite complex. Also because the number of cells
increases multiplicatively, maintaining an adequate no. of
respondents or cases in each cell can be problematic.


The statistical significance of the observed association is commonly
measured by the Chi-Square statistic.



The strength of association, or degree of association, is important
from a practical or substantive perspective.



The strength of the association can be meausred by the phi
correlation coefficient, the contigency co-efficient, Cramer’s V, & the
lambda coeficient.



Explanation of all the above coefficient are explained on the next
slide.










The chi-square statistic (χ square) is used to test the statistical
significance of the observed association in a cross-tabulation.
The null hypothesis, Ho is that there is no association between the
variables.
The value of chi-square is calculated as:Χ square = ∑ (fo - fe)square / fe(denoted value).
fo is observed frequency.
The chi-square distribution is a skewed distribution whose shape
depends solely on the number of degrees of freedom. As the
number of degrees of freedom increases, the chi-square
distribution becomes more symmetrical.


The phi coefficient (ф) is used as a measure of the
strength of association in the special case of table with
two rows & two columns (a 2*2table).



The phi coefficient is proportional to the √ of the chisquare statistic.



Sample size n, this statistic is calculated as:-

√χsquare/n.

ф=


The phi coefficient is specific to a 2*2 table, the
contigency coefficient (C) can be used to assess the
strength of association in a table of any size.

 Chi-square




:- C =

√

/

χsquare χsquare + n

The contingency coefficient varies between 0 & 1. Where
0 value occurs in the case of no association (i.e., the
variables are statistically independent), but the maximum
value of 1 is never achieved.
This value of C indicates that the association is not very
strong. Another statistic that can be calculated for any
table is Cramer’s V.






Cramer’s V is a modified version of the phi coefficient, ф , and is used
in tables larger than 2* 2. When phi is calculated for a table larger
than 2*2, it has no upper limit.
Cramer’s V is obtaining by adjusting phi for either the number of rows
o r the number of columns in the table, based on which of the two is
smaller.
For a table with r rows & c columns, the relationship between
Cramer’s V and the phi correlation coefficient is expressed as :-

V

=

√ф

square / min(r-1), (c-1)

Or

V =


√χ

square/n

/

min(r-1),(c-1)

Another statistic commomly estimated is the lambda coefficient


Lambda assumes that the variables are measured on a nominal scale.



A symmetric lambda measures the % improvement in predicting the
value of the dependent variable, given the value of the independent
variable.



Lambda also varies between 0 & 1.



A value of 0 means no improvement in prediction.



A value of 1 indicates that the predication can be made without error.



This happens when each independent variable is associated with a
single category of the dependent variable.













The previous section considered hypothesis testing to associations.
Now we would be focusing on hypothesis testing related to
differences.
Hypothesis-testing procedures can be broadly classified as
parametric or non-parametric, based on the measurement scale of
the variables involved.
Parametric tests assume that the variables of interest are measured
on at least an interval scale.
Non-parametric tests assume that the variables are measured on a
nominal or ordinal scale.
They are been further classified based on whether one, two, or
more samples are involved.
The no. of samples is determined based on how the data are
treated for the purpose of analysis, not based on how the data
were collected.
Independent
Samples

Parametric
Tests
(Metric Data)

Two
Samples
Paired Samples
One Sample

t =test
z = test

Two group
t= test
z = test

Paired t test
Nonparametri
c Tests
(Nonmetric
Data)

Two
Sampl
es

Independent
Samples

Chi-square
MannWhitney
Median
K-S

Chisquare
K–S
Runs
Binomial
Chisquare

One
Sample

Paired
Samples

Sign
Wilcoxon
McNemar
Chisquare


Parametric Tests provide inferences for making statements
about the means of parent population.



A t test is commonly used for purpose.



The test is based on the student’s t statistic .



The t statistic assumes that the variable is normally
distributed, with mean is known (or assumed to be
known), and the population variance is estimated from the
sample.



One or two samples and compute the mean and standard
deviation for each sample.
 Non

parametric tests are used when the
independent variables are nonmetric.
 Like parametric tests, nonparametric
tests are available for testing variables
from one sample, two independent
samples, or two related samples


An important nonparametric test for examining differences
in the location of two populations based on paired
observations is the Wilcoxon matched-pairs signed-rank
test.



The test analyzes the differences between the paired
observation, taking into account the magnitude of the
differences.



It computes the differences between the pairs of variables
and ranks the absolute differences.



The next step is to sum the positive & negative ranks.
marketing research & applications on SPSS

More Related Content

What's hot

Probability Distribution
Probability DistributionProbability Distribution
Probability Distribution
Sarabjeet Kaur
 
Multidimensional scaling1
Multidimensional scaling1Multidimensional scaling1
Multidimensional scaling1
Carlo Magno
 
Introduction to business statistics
Introduction to business statisticsIntroduction to business statistics
Introduction to business statistics
Aakash Kulkarni
 
Testing of hypotheses
Testing of hypothesesTesting of hypotheses
Testing of hypotheses
RajThakuri
 
Hypothesis testing
Hypothesis testingHypothesis testing
Hypothesis testing
Rashmi Vaishya
 
Data analysis using spss
Data analysis using spssData analysis using spss
Data analysis using spss
Muhammad Ibrahim
 
Confidence interval
Confidence intervalConfidence interval
Confidence interval
Dr Renju Ravi
 
Descriptive Statistics
Descriptive StatisticsDescriptive Statistics
Descriptive Statistics
CIToolkit
 
Regression analysis ppt
Regression analysis pptRegression analysis ppt
Regression analysis ppt
Elkana Rorio
 
Structural equation modeling in amos
Structural equation modeling in amosStructural equation modeling in amos
Structural equation modeling in amos
Balaji P
 
regression assumption by Ammara Aftab
regression assumption by Ammara Aftabregression assumption by Ammara Aftab
regression assumption by Ammara Aftab
University of Karachi
 
Multidimensional scaling & Conjoint Analysis
Multidimensional scaling & Conjoint AnalysisMultidimensional scaling & Conjoint Analysis
Multidimensional scaling & Conjoint Analysis
Omer Maroof
 
Bayes' theorem
Bayes' theoremBayes' theorem
Bayes' theorem
Dr. C.V. Suresh Babu
 
Correlation ppt...
Correlation ppt...Correlation ppt...
Correlation ppt...
Shruti Srivastava
 
Chap03 numerical descriptive measures
Chap03 numerical descriptive measuresChap03 numerical descriptive measures
Chap03 numerical descriptive measures
Uni Azza Aunillah
 
Methods of point estimation
Methods of point estimationMethods of point estimation
Methods of point estimation
Suruchi Somwanshi
 
"A basic guide to SPSS"
"A basic guide to SPSS""A basic guide to SPSS"
"A basic guide to SPSS"
Bashir7576
 
Spss session 1 and 2
Spss session 1 and 2Spss session 1 and 2
Spss session 1 and 2
Judianto Nugroho
 
Business Analytics
 Business Analytics  Business Analytics
Business Analytics
ICFAI Business School
 
Test hypothesis
Test hypothesisTest hypothesis
Test hypothesis
Homework Guru
 

What's hot (20)

Probability Distribution
Probability DistributionProbability Distribution
Probability Distribution
 
Multidimensional scaling1
Multidimensional scaling1Multidimensional scaling1
Multidimensional scaling1
 
Introduction to business statistics
Introduction to business statisticsIntroduction to business statistics
Introduction to business statistics
 
Testing of hypotheses
Testing of hypothesesTesting of hypotheses
Testing of hypotheses
 
Hypothesis testing
Hypothesis testingHypothesis testing
Hypothesis testing
 
Data analysis using spss
Data analysis using spssData analysis using spss
Data analysis using spss
 
Confidence interval
Confidence intervalConfidence interval
Confidence interval
 
Descriptive Statistics
Descriptive StatisticsDescriptive Statistics
Descriptive Statistics
 
Regression analysis ppt
Regression analysis pptRegression analysis ppt
Regression analysis ppt
 
Structural equation modeling in amos
Structural equation modeling in amosStructural equation modeling in amos
Structural equation modeling in amos
 
regression assumption by Ammara Aftab
regression assumption by Ammara Aftabregression assumption by Ammara Aftab
regression assumption by Ammara Aftab
 
Multidimensional scaling & Conjoint Analysis
Multidimensional scaling & Conjoint AnalysisMultidimensional scaling & Conjoint Analysis
Multidimensional scaling & Conjoint Analysis
 
Bayes' theorem
Bayes' theoremBayes' theorem
Bayes' theorem
 
Correlation ppt...
Correlation ppt...Correlation ppt...
Correlation ppt...
 
Chap03 numerical descriptive measures
Chap03 numerical descriptive measuresChap03 numerical descriptive measures
Chap03 numerical descriptive measures
 
Methods of point estimation
Methods of point estimationMethods of point estimation
Methods of point estimation
 
"A basic guide to SPSS"
"A basic guide to SPSS""A basic guide to SPSS"
"A basic guide to SPSS"
 
Spss session 1 and 2
Spss session 1 and 2Spss session 1 and 2
Spss session 1 and 2
 
Business Analytics
 Business Analytics  Business Analytics
Business Analytics
 
Test hypothesis
Test hypothesisTest hypothesis
Test hypothesis
 

Viewers also liked

Marekting research applications ppt
Marekting research applications pptMarekting research applications ppt
Marekting research applications ppt
ANSHU TIWARI
 
Introduction to spss
Introduction to spssIntroduction to spss
Introduction to spss
Manish Parihar
 
Marketing reasearch project
Marketing reasearch projectMarketing reasearch project
Marketing reasearch project
Pawan Dubey
 
Training Session on Using Nvivo and SPSS
Training Session on Using Nvivo and SPSS Training Session on Using Nvivo and SPSS
Training Session on Using Nvivo and SPSS
University of Groningen (The Netherlands)
 
Collaborative Composition Histories
Collaborative Composition HistoriesCollaborative Composition Histories
Collaborative Composition Histories
mdbabin
 
Week 6 project
Week 6 projectWeek 6 project
Week 6 project
samkrug
 
Performance indicators for different levels of management
Performance indicators for different levels of managementPerformance indicators for different levels of management
Performance indicators for different levels of management
sree431
 
Time management
Time managementTime management
Time management
Andrea Olmus Tisnés
 
Croutons.org
Croutons.orgCroutons.org
Croutons.org
ethelkatrina
 
kelly marulanda
kelly marulandakelly marulanda
kelly marulanda
Juɑn Rɑmirez
 
Beat the Red Eye - 100+ IDEAS!
Beat the Red Eye - 100+ IDEAS!Beat the Red Eye - 100+ IDEAS!
Beat the Red Eye - 100+ IDEAS!
ethelkatrina
 
Závěrečný úkol KPI
Závěrečný úkol KPIZávěrečný úkol KPI
Závěrečný úkol KPI
Jan Vyhnánek
 
Wallopball
WallopballWallopball
Wallopball
ethelkatrina
 
Performance indicators for different levels of management
Performance indicators for different levels of managementPerformance indicators for different levels of management
Performance indicators for different levels of management
sree431
 
Coderetreat introduction
Coderetreat introductionCoderetreat introduction
Coderetreat introduction
Vaidas Pilkauskas
 
Comp 220 lab 3
Comp 220 lab 3Comp 220 lab 3
Comp 220 lab 3
HomeWork-Fox
 
Venture Lab Creativity: Paying Attention
Venture Lab Creativity: Paying Attention Venture Lab Creativity: Paying Attention
Venture Lab Creativity: Paying Attention
ethelkatrina
 
Simulacro pruebas saber 5ªto
Simulacro pruebas saber 5ªtoSimulacro pruebas saber 5ªto
Simulacro pruebas saber 5ªto
Juɑn Rɑmirez
 
Group 8. part a
Group 8. part aGroup 8. part a
Group 8. part a
Thanh Vinh Do
 

Viewers also liked (20)

Marekting research applications ppt
Marekting research applications pptMarekting research applications ppt
Marekting research applications ppt
 
Introduction to spss
Introduction to spssIntroduction to spss
Introduction to spss
 
Marketing reasearch project
Marketing reasearch projectMarketing reasearch project
Marketing reasearch project
 
Training Session on Using Nvivo and SPSS
Training Session on Using Nvivo and SPSS Training Session on Using Nvivo and SPSS
Training Session on Using Nvivo and SPSS
 
Collaborative Composition Histories
Collaborative Composition HistoriesCollaborative Composition Histories
Collaborative Composition Histories
 
Week 6 project
Week 6 projectWeek 6 project
Week 6 project
 
Performance indicators for different levels of management
Performance indicators for different levels of managementPerformance indicators for different levels of management
Performance indicators for different levels of management
 
Time management
Time managementTime management
Time management
 
Croutons.org
Croutons.orgCroutons.org
Croutons.org
 
kelly marulanda
kelly marulandakelly marulanda
kelly marulanda
 
Beat the Red Eye - 100+ IDEAS!
Beat the Red Eye - 100+ IDEAS!Beat the Red Eye - 100+ IDEAS!
Beat the Red Eye - 100+ IDEAS!
 
Závěrečný úkol KPI
Závěrečný úkol KPIZávěrečný úkol KPI
Závěrečný úkol KPI
 
Wallopball
WallopballWallopball
Wallopball
 
Performance indicators for different levels of management
Performance indicators for different levels of managementPerformance indicators for different levels of management
Performance indicators for different levels of management
 
Coderetreat introduction
Coderetreat introductionCoderetreat introduction
Coderetreat introduction
 
norhane ramdani
norhane ramdaninorhane ramdani
norhane ramdani
 
Comp 220 lab 3
Comp 220 lab 3Comp 220 lab 3
Comp 220 lab 3
 
Venture Lab Creativity: Paying Attention
Venture Lab Creativity: Paying Attention Venture Lab Creativity: Paying Attention
Venture Lab Creativity: Paying Attention
 
Simulacro pruebas saber 5ªto
Simulacro pruebas saber 5ªtoSimulacro pruebas saber 5ªto
Simulacro pruebas saber 5ªto
 
Group 8. part a
Group 8. part aGroup 8. part a
Group 8. part a
 

Similar to marketing research & applications on SPSS

Overview of Advance Marketing Research
Overview of Advance Marketing ResearchOverview of Advance Marketing Research
Overview of Advance Marketing Research
Enamul Islam
 
Pampers CaseIn an increasingly competitive diaper market, P&G’.docx
Pampers CaseIn an increasingly competitive diaper market, P&G’.docxPampers CaseIn an increasingly competitive diaper market, P&G’.docx
Pampers CaseIn an increasingly competitive diaper market, P&G’.docx
bunyansaturnina
 
Basic Statistical Descriptions of Data.pptx
Basic Statistical Descriptions of Data.pptxBasic Statistical Descriptions of Data.pptx
Basic Statistical Descriptions of Data.pptx
Anusuya123
 
Data Processing and Statistical Treatment.pptx
Data Processing and Statistical Treatment.pptxData Processing and Statistical Treatment.pptx
Data Processing and Statistical Treatment.pptx
VamPagauraAlvarado
 
Qnt 275 Enhance teaching / snaptutorial.com
Qnt 275 Enhance teaching / snaptutorial.comQnt 275 Enhance teaching / snaptutorial.com
Qnt 275 Enhance teaching / snaptutorial.com
Baileya33
 
QNT 275 Inspiring Innovation / tutorialrank.com
QNT 275 Inspiring Innovation / tutorialrank.comQNT 275 Inspiring Innovation / tutorialrank.com
QNT 275 Inspiring Innovation / tutorialrank.com
Bromleyz33
 
Unit-III Correlation and Regression.pptx
Unit-III Correlation and Regression.pptxUnit-III Correlation and Regression.pptx
Unit-III Correlation and Regression.pptx
Anusuya123
 
QNT 275 Exceptional Education - snaptutorial.com
QNT 275   Exceptional Education - snaptutorial.comQNT 275   Exceptional Education - snaptutorial.com
QNT 275 Exceptional Education - snaptutorial.com
DavisMurphyB22
 
Introduction to the t test
Introduction to the t testIntroduction to the t test
Introduction to the t test
Sr Edith Bogue
 
Research methodology and iostatistics ppt
Research methodology and iostatistics pptResearch methodology and iostatistics ppt
Research methodology and iostatistics ppt
Nikhat Mohammadi
 
Chapter 11 Psrm
Chapter 11 PsrmChapter 11 Psrm
Chapter 11 Psrm
mandrewmartin
 
The chi square test of indep of categorical variables
The chi square test of indep of categorical variablesThe chi square test of indep of categorical variables
The chi square test of indep of categorical variables
Regent University
 
Correlation
Correlation  Correlation
Application of Statistical and mathematical equations in Chemistry Part 2
Application of Statistical and mathematical equations in Chemistry Part 2Application of Statistical and mathematical equations in Chemistry Part 2
Application of Statistical and mathematical equations in Chemistry Part 2
Awad Albalwi
 
2 UNIT-DSP.pptx
2 UNIT-DSP.pptx2 UNIT-DSP.pptx
2 UNIT-DSP.pptx
PothyeswariPothyes
 
Biostatistics
BiostatisticsBiostatistics
Biostatistics
priyarokz
 
Measure of Association
Measure of AssociationMeasure of Association
Measure of Association
Kalahandi University
 
Statistics
StatisticsStatistics
Statistics
pikuoec
 
IntroStatsSlidesPost.pptx
IntroStatsSlidesPost.pptxIntroStatsSlidesPost.pptx
IntroStatsSlidesPost.pptx
Thanuj Pothula
 
Quantitative Data analysis
Quantitative Data analysisQuantitative Data analysis
Quantitative Data analysis
Muhammad Musawar Ali
 

Similar to marketing research & applications on SPSS (20)

Overview of Advance Marketing Research
Overview of Advance Marketing ResearchOverview of Advance Marketing Research
Overview of Advance Marketing Research
 
Pampers CaseIn an increasingly competitive diaper market, P&G’.docx
Pampers CaseIn an increasingly competitive diaper market, P&G’.docxPampers CaseIn an increasingly competitive diaper market, P&G’.docx
Pampers CaseIn an increasingly competitive diaper market, P&G’.docx
 
Basic Statistical Descriptions of Data.pptx
Basic Statistical Descriptions of Data.pptxBasic Statistical Descriptions of Data.pptx
Basic Statistical Descriptions of Data.pptx
 
Data Processing and Statistical Treatment.pptx
Data Processing and Statistical Treatment.pptxData Processing and Statistical Treatment.pptx
Data Processing and Statistical Treatment.pptx
 
Qnt 275 Enhance teaching / snaptutorial.com
Qnt 275 Enhance teaching / snaptutorial.comQnt 275 Enhance teaching / snaptutorial.com
Qnt 275 Enhance teaching / snaptutorial.com
 
QNT 275 Inspiring Innovation / tutorialrank.com
QNT 275 Inspiring Innovation / tutorialrank.comQNT 275 Inspiring Innovation / tutorialrank.com
QNT 275 Inspiring Innovation / tutorialrank.com
 
Unit-III Correlation and Regression.pptx
Unit-III Correlation and Regression.pptxUnit-III Correlation and Regression.pptx
Unit-III Correlation and Regression.pptx
 
QNT 275 Exceptional Education - snaptutorial.com
QNT 275   Exceptional Education - snaptutorial.comQNT 275   Exceptional Education - snaptutorial.com
QNT 275 Exceptional Education - snaptutorial.com
 
Introduction to the t test
Introduction to the t testIntroduction to the t test
Introduction to the t test
 
Research methodology and iostatistics ppt
Research methodology and iostatistics pptResearch methodology and iostatistics ppt
Research methodology and iostatistics ppt
 
Chapter 11 Psrm
Chapter 11 PsrmChapter 11 Psrm
Chapter 11 Psrm
 
The chi square test of indep of categorical variables
The chi square test of indep of categorical variablesThe chi square test of indep of categorical variables
The chi square test of indep of categorical variables
 
Correlation
Correlation  Correlation
Correlation
 
Application of Statistical and mathematical equations in Chemistry Part 2
Application of Statistical and mathematical equations in Chemistry Part 2Application of Statistical and mathematical equations in Chemistry Part 2
Application of Statistical and mathematical equations in Chemistry Part 2
 
2 UNIT-DSP.pptx
2 UNIT-DSP.pptx2 UNIT-DSP.pptx
2 UNIT-DSP.pptx
 
Biostatistics
BiostatisticsBiostatistics
Biostatistics
 
Measure of Association
Measure of AssociationMeasure of Association
Measure of Association
 
Statistics
StatisticsStatistics
Statistics
 
IntroStatsSlidesPost.pptx
IntroStatsSlidesPost.pptxIntroStatsSlidesPost.pptx
IntroStatsSlidesPost.pptx
 
Quantitative Data analysis
Quantitative Data analysisQuantitative Data analysis
Quantitative Data analysis
 

More from ANSHU TIWARI

Ppt of shamim sir brand war
Ppt of shamim sir brand warPpt of shamim sir brand war
Ppt of shamim sir brand war
ANSHU TIWARI
 
MARKETING STRATEGY OF LIC
MARKETING STRATEGY OF LIC MARKETING STRATEGY OF LIC
MARKETING STRATEGY OF LIC
ANSHU TIWARI
 
presentation just dial how it generate th erevenue
presentation just dial how it generate th erevenuepresentation just dial how it generate th erevenue
presentation just dial how it generate th erevenue
ANSHU TIWARI
 
Diversification strategy final
Diversification strategy finalDiversification strategy final
Diversification strategy final
ANSHU TIWARI
 
Channeldecisionandalternatives 130419093545-phpapp02
Channeldecisionandalternatives 130419093545-phpapp02Channeldecisionandalternatives 130419093545-phpapp02
Channeldecisionandalternatives 130419093545-phpapp02
ANSHU TIWARI
 
Presentation of royal enfield of miraroad
Presentation of  royal enfield of miraroadPresentation of  royal enfield of miraroad
Presentation of royal enfield of miraroad
ANSHU TIWARI
 
Presentation on nokia overall started
Presentation on nokia overall startedPresentation on nokia overall started
Presentation on nokia overall started
ANSHU TIWARI
 
A product demonstration
A product demonstrationA product demonstration
A product demonstration
ANSHU TIWARI
 
New amul the taste of india and a campaign
New amul the taste of india and a campaignNew amul the taste of india and a campaign
New amul the taste of india and a campaign
ANSHU TIWARI
 
Mahindra & Mahindra Tractors In Usa
Mahindra & Mahindra Tractors In UsaMahindra & Mahindra Tractors In Usa
Mahindra & Mahindra Tractors In Usa
ANSHU TIWARI
 

More from ANSHU TIWARI (10)

Ppt of shamim sir brand war
Ppt of shamim sir brand warPpt of shamim sir brand war
Ppt of shamim sir brand war
 
MARKETING STRATEGY OF LIC
MARKETING STRATEGY OF LIC MARKETING STRATEGY OF LIC
MARKETING STRATEGY OF LIC
 
presentation just dial how it generate th erevenue
presentation just dial how it generate th erevenuepresentation just dial how it generate th erevenue
presentation just dial how it generate th erevenue
 
Diversification strategy final
Diversification strategy finalDiversification strategy final
Diversification strategy final
 
Channeldecisionandalternatives 130419093545-phpapp02
Channeldecisionandalternatives 130419093545-phpapp02Channeldecisionandalternatives 130419093545-phpapp02
Channeldecisionandalternatives 130419093545-phpapp02
 
Presentation of royal enfield of miraroad
Presentation of  royal enfield of miraroadPresentation of  royal enfield of miraroad
Presentation of royal enfield of miraroad
 
Presentation on nokia overall started
Presentation on nokia overall startedPresentation on nokia overall started
Presentation on nokia overall started
 
A product demonstration
A product demonstrationA product demonstration
A product demonstration
 
New amul the taste of india and a campaign
New amul the taste of india and a campaignNew amul the taste of india and a campaign
New amul the taste of india and a campaign
 
Mahindra & Mahindra Tractors In Usa
Mahindra & Mahindra Tractors In UsaMahindra & Mahindra Tractors In Usa
Mahindra & Mahindra Tractors In Usa
 

Recently uploaded

The basics of sentences session 6pptx.pptx
The basics of sentences session 6pptx.pptxThe basics of sentences session 6pptx.pptx
The basics of sentences session 6pptx.pptx
heathfieldcps1
 
Top five deadliest dog breeds in America
Top five deadliest dog breeds in AmericaTop five deadliest dog breeds in America
Top five deadliest dog breeds in America
Bisnar Chase Personal Injury Attorneys
 
Chapter 4 - Islamic Financial Institutions in Malaysia.pptx
Chapter 4 - Islamic Financial Institutions in Malaysia.pptxChapter 4 - Islamic Financial Institutions in Malaysia.pptx
Chapter 4 - Islamic Financial Institutions in Malaysia.pptx
Mohd Adib Abd Muin, Senior Lecturer at Universiti Utara Malaysia
 
The History of Stoke Newington Street Names
The History of Stoke Newington Street NamesThe History of Stoke Newington Street Names
The History of Stoke Newington Street Names
History of Stoke Newington
 
South African Journal of Science: Writing with integrity workshop (2024)
South African Journal of Science: Writing with integrity workshop (2024)South African Journal of Science: Writing with integrity workshop (2024)
South African Journal of Science: Writing with integrity workshop (2024)
Academy of Science of South Africa
 
Liberal Approach to the Study of Indian Politics.pdf
Liberal Approach to the Study of Indian Politics.pdfLiberal Approach to the Study of Indian Politics.pdf
Liberal Approach to the Study of Indian Politics.pdf
WaniBasim
 
A Survey of Techniques for Maximizing LLM Performance.pptx
A Survey of Techniques for Maximizing LLM Performance.pptxA Survey of Techniques for Maximizing LLM Performance.pptx
A Survey of Techniques for Maximizing LLM Performance.pptx
thanhdowork
 
The basics of sentences session 5pptx.pptx
The basics of sentences session 5pptx.pptxThe basics of sentences session 5pptx.pptx
The basics of sentences session 5pptx.pptx
heathfieldcps1
 
বাংলাদেশ অর্থনৈতিক সমীক্ষা (Economic Review) ২০২৪ UJS App.pdf
বাংলাদেশ অর্থনৈতিক সমীক্ষা (Economic Review) ২০২৪ UJS App.pdfবাংলাদেশ অর্থনৈতিক সমীক্ষা (Economic Review) ২০২৪ UJS App.pdf
বাংলাদেশ অর্থনৈতিক সমীক্ষা (Economic Review) ২০২৪ UJS App.pdf
eBook.com.bd (প্রয়োজনীয় বাংলা বই)
 
Lapbook sobre os Regimes Totalitários.pdf
Lapbook sobre os Regimes Totalitários.pdfLapbook sobre os Regimes Totalitários.pdf
Lapbook sobre os Regimes Totalitários.pdf
Jean Carlos Nunes Paixão
 
MARY JANE WILSON, A “BOA MÃE” .
MARY JANE WILSON, A “BOA MÃE”           .MARY JANE WILSON, A “BOA MÃE”           .
MARY JANE WILSON, A “BOA MÃE” .
Colégio Santa Teresinha
 
Advanced Java[Extra Concepts, Not Difficult].docx
Advanced Java[Extra Concepts, Not Difficult].docxAdvanced Java[Extra Concepts, Not Difficult].docx
Advanced Java[Extra Concepts, Not Difficult].docx
adhitya5119
 
How to Add Chatter in the odoo 17 ERP Module
How to Add Chatter in the odoo 17 ERP ModuleHow to Add Chatter in the odoo 17 ERP Module
How to Add Chatter in the odoo 17 ERP Module
Celine George
 
Digital Artefact 1 - Tiny Home Environmental Design
Digital Artefact 1 - Tiny Home Environmental DesignDigital Artefact 1 - Tiny Home Environmental Design
Digital Artefact 1 - Tiny Home Environmental Design
amberjdewit93
 
C1 Rubenstein AP HuG xxxxxxxxxxxxxx.pptx
C1 Rubenstein AP HuG xxxxxxxxxxxxxx.pptxC1 Rubenstein AP HuG xxxxxxxxxxxxxx.pptx
C1 Rubenstein AP HuG xxxxxxxxxxxxxx.pptx
mulvey2
 
Introduction to AI for Nonprofits with Tapp Network
Introduction to AI for Nonprofits with Tapp NetworkIntroduction to AI for Nonprofits with Tapp Network
Introduction to AI for Nonprofits with Tapp Network
TechSoup
 
Natural birth techniques - Mrs.Akanksha Trivedi Rama University
Natural birth techniques - Mrs.Akanksha Trivedi Rama UniversityNatural birth techniques - Mrs.Akanksha Trivedi Rama University
Natural birth techniques - Mrs.Akanksha Trivedi Rama University
Akanksha trivedi rama nursing college kanpur.
 
RPMS TEMPLATE FOR SCHOOL YEAR 2023-2024 FOR TEACHER 1 TO TEACHER 3
RPMS TEMPLATE FOR SCHOOL YEAR 2023-2024 FOR TEACHER 1 TO TEACHER 3RPMS TEMPLATE FOR SCHOOL YEAR 2023-2024 FOR TEACHER 1 TO TEACHER 3
RPMS TEMPLATE FOR SCHOOL YEAR 2023-2024 FOR TEACHER 1 TO TEACHER 3
IreneSebastianRueco1
 
Assessment and Planning in Educational technology.pptx
Assessment and Planning in Educational technology.pptxAssessment and Planning in Educational technology.pptx
Assessment and Planning in Educational technology.pptx
Kavitha Krishnan
 
clinical examination of hip joint (1).pdf
clinical examination of hip joint (1).pdfclinical examination of hip joint (1).pdf
clinical examination of hip joint (1).pdf
Priyankaranawat4
 

Recently uploaded (20)

The basics of sentences session 6pptx.pptx
The basics of sentences session 6pptx.pptxThe basics of sentences session 6pptx.pptx
The basics of sentences session 6pptx.pptx
 
Top five deadliest dog breeds in America
Top five deadliest dog breeds in AmericaTop five deadliest dog breeds in America
Top five deadliest dog breeds in America
 
Chapter 4 - Islamic Financial Institutions in Malaysia.pptx
Chapter 4 - Islamic Financial Institutions in Malaysia.pptxChapter 4 - Islamic Financial Institutions in Malaysia.pptx
Chapter 4 - Islamic Financial Institutions in Malaysia.pptx
 
The History of Stoke Newington Street Names
The History of Stoke Newington Street NamesThe History of Stoke Newington Street Names
The History of Stoke Newington Street Names
 
South African Journal of Science: Writing with integrity workshop (2024)
South African Journal of Science: Writing with integrity workshop (2024)South African Journal of Science: Writing with integrity workshop (2024)
South African Journal of Science: Writing with integrity workshop (2024)
 
Liberal Approach to the Study of Indian Politics.pdf
Liberal Approach to the Study of Indian Politics.pdfLiberal Approach to the Study of Indian Politics.pdf
Liberal Approach to the Study of Indian Politics.pdf
 
A Survey of Techniques for Maximizing LLM Performance.pptx
A Survey of Techniques for Maximizing LLM Performance.pptxA Survey of Techniques for Maximizing LLM Performance.pptx
A Survey of Techniques for Maximizing LLM Performance.pptx
 
The basics of sentences session 5pptx.pptx
The basics of sentences session 5pptx.pptxThe basics of sentences session 5pptx.pptx
The basics of sentences session 5pptx.pptx
 
বাংলাদেশ অর্থনৈতিক সমীক্ষা (Economic Review) ২০২৪ UJS App.pdf
বাংলাদেশ অর্থনৈতিক সমীক্ষা (Economic Review) ২০২৪ UJS App.pdfবাংলাদেশ অর্থনৈতিক সমীক্ষা (Economic Review) ২০২৪ UJS App.pdf
বাংলাদেশ অর্থনৈতিক সমীক্ষা (Economic Review) ২০২৪ UJS App.pdf
 
Lapbook sobre os Regimes Totalitários.pdf
Lapbook sobre os Regimes Totalitários.pdfLapbook sobre os Regimes Totalitários.pdf
Lapbook sobre os Regimes Totalitários.pdf
 
MARY JANE WILSON, A “BOA MÃE” .
MARY JANE WILSON, A “BOA MÃE”           .MARY JANE WILSON, A “BOA MÃE”           .
MARY JANE WILSON, A “BOA MÃE” .
 
Advanced Java[Extra Concepts, Not Difficult].docx
Advanced Java[Extra Concepts, Not Difficult].docxAdvanced Java[Extra Concepts, Not Difficult].docx
Advanced Java[Extra Concepts, Not Difficult].docx
 
How to Add Chatter in the odoo 17 ERP Module
How to Add Chatter in the odoo 17 ERP ModuleHow to Add Chatter in the odoo 17 ERP Module
How to Add Chatter in the odoo 17 ERP Module
 
Digital Artefact 1 - Tiny Home Environmental Design
Digital Artefact 1 - Tiny Home Environmental DesignDigital Artefact 1 - Tiny Home Environmental Design
Digital Artefact 1 - Tiny Home Environmental Design
 
C1 Rubenstein AP HuG xxxxxxxxxxxxxx.pptx
C1 Rubenstein AP HuG xxxxxxxxxxxxxx.pptxC1 Rubenstein AP HuG xxxxxxxxxxxxxx.pptx
C1 Rubenstein AP HuG xxxxxxxxxxxxxx.pptx
 
Introduction to AI for Nonprofits with Tapp Network
Introduction to AI for Nonprofits with Tapp NetworkIntroduction to AI for Nonprofits with Tapp Network
Introduction to AI for Nonprofits with Tapp Network
 
Natural birth techniques - Mrs.Akanksha Trivedi Rama University
Natural birth techniques - Mrs.Akanksha Trivedi Rama UniversityNatural birth techniques - Mrs.Akanksha Trivedi Rama University
Natural birth techniques - Mrs.Akanksha Trivedi Rama University
 
RPMS TEMPLATE FOR SCHOOL YEAR 2023-2024 FOR TEACHER 1 TO TEACHER 3
RPMS TEMPLATE FOR SCHOOL YEAR 2023-2024 FOR TEACHER 1 TO TEACHER 3RPMS TEMPLATE FOR SCHOOL YEAR 2023-2024 FOR TEACHER 1 TO TEACHER 3
RPMS TEMPLATE FOR SCHOOL YEAR 2023-2024 FOR TEACHER 1 TO TEACHER 3
 
Assessment and Planning in Educational technology.pptx
Assessment and Planning in Educational technology.pptxAssessment and Planning in Educational technology.pptx
Assessment and Planning in Educational technology.pptx
 
clinical examination of hip joint (1).pdf
clinical examination of hip joint (1).pdfclinical examination of hip joint (1).pdf
clinical examination of hip joint (1).pdf
 

marketing research & applications on SPSS

  • 2. Presented By :- Anshu Tiwari Roll No:- 2012098
  • 3.        Marketing researchers often need to answer questions about the single variable For eg:users of brand may be characterized by brand loyal. Familiar with the new product offering. Mean familiarity rating Income distributions of Brand Users. Distributions skewed towards the low income bracket. For all the above questions the answers can be determined by examining frequency distributions.
  • 4. Value Label Very Unfamiliar Valu Frequency (N) e % Valid % Cumulative % 1 0 0.0 0.0 0.0 2 2 6.7 6.9 6.9 3 6 20.0 20.7 27.6 4 6 20.0 20.7 48.3 5 3 10.0 10.3 58.6 6 8 26.7 27.6 86.2 Very Familiar 7 4 13.3 13.8 100.0 Missing 9 1 3.3 Total 30 100.0 100.0
  • 5. The most commonly used statistics associated with frequencies are measures of Location (mean, mode & median), measures of variability (range, interquartile range. Standard deviation, and coefficient of variation) and measures of shape (skewness & kurtosis).  Mean:- X bar = ∑ Xin / n where i=1 & X bar is given, Xi = observed values of the variable X N= Number of observations (sample size) X bar = (2*2+6*3+6*4+3*5+8*6+4*7) / 29 = (4+18+24+15+48+28) / 29 = 137/29 = 4.724  Mode :- Mode is the value that occurs most frequently. It represents the highest peak of the distribution. So the mode here is 6 . 
  • 6. Median:- The median of a sample is the middle value when the data are arranged in ascending or descending order. So the median is an appropriate measure odf central tendency for ordinal data. The median is 5.  So the mean= 4.724, mode = 6, Median = 5 . So when the measures of central tendency in a different way. So which measures should be used.  Measures of Variability : Range:- = X largest – X smallest i.e 7-2 = 5  Interquartile Range = Difference between the 75th & 25th percentile. So the interquartile range is 6-3 = 3  Variance & Standard Deviation :- Variance can never be negative. Standard Deviation is the saquare root of the variance. So it can be calculated as s = √ ∑ (Xi – X bar )2 / n-1  S square { 2*(2-4.724)2square + 6-(3-4.724)2 + 6*(4-4.724)2 + 3*(5-4.724)2 + 8*(6-4.724)2 + 4*(7-4.724)2 } / 29-1 = {14.840+17.833+3.145+0.299+13.025+20.721} / 28, = 69.793/28, = 2.493 S = √2.493 = 1.579 
  • 7.   Skewness:- Distribution can be either be symmetric or skewed. In a symmetric distribution, the values on either isde of the center of the distribution are the same, and the mean, mode & median are equal. In a skewed distribution the positive & negative deviations from the mean are unequal. Kurtosis:- It is a measure of the relative peakedness or flatness of the curve defined by the frequency distribution. The kurtosis of a normal distribution is zero. If the kurtosis is positive, then the distribution is more peaked than a normal distribution. A negative value means that the distribution is flatter than a normal distribution.
  • 8.       The concepts of sampling distribution , standard error of the mean or the proportion, and the confidence interval. All these concepts are relevant to hypothesis testing and should be reviewed. Eg of Hypotheses generated in marketing research :The department store is being patronized by more than 105% of the households, The heavy and light users of a brand differ in terms of psychographic characteristics. Familiarity with a restaurant results in a greater preference for that restaurant. One hotel has a more upscale image than its close competitor.
  • 9.  Formulate the null hypothesis Ho and the alternative H1.  Select an appropriate statistical technique and the corresponding test statistic.  Choose the level of significance, ά.  Determine the size & collect the data.  Determine probability & Determine the critical value of the test.  Compare the probability & Determine if TSCR falls into rejection.  Making statistical decision to reject or not reject the null hypothesis.  Express the statistical decision in terms of the marketing research problem.
  • 10.  Two Variables :- Cross tabulation is also know as bivariate crosstabulation. Consider again the cross-tabulation of Internet usage with sex (male & female).  Three Variables:- The third variable clarifies the initial association (or lack of it) observed between the two variables.   Reveal Suppressed Association - Over here the researcher suspected desire to travel abroad may be influenced by age. However, a cross-tabulation of the two variables produced the result. General Comments on Cross-Tabulation:More than three variables can be cross-tabulated, but the interpretation is quite complex. Also because the number of cells increases multiplicatively, maintaining an adequate no. of respondents or cases in each cell can be problematic.
  • 11.  The statistical significance of the observed association is commonly measured by the Chi-Square statistic.  The strength of association, or degree of association, is important from a practical or substantive perspective.  The strength of the association can be meausred by the phi correlation coefficient, the contigency co-efficient, Cramer’s V, & the lambda coeficient.  Explanation of all the above coefficient are explained on the next slide.
  • 12.       The chi-square statistic (χ square) is used to test the statistical significance of the observed association in a cross-tabulation. The null hypothesis, Ho is that there is no association between the variables. The value of chi-square is calculated as:Χ square = ∑ (fo - fe)square / fe(denoted value). fo is observed frequency. The chi-square distribution is a skewed distribution whose shape depends solely on the number of degrees of freedom. As the number of degrees of freedom increases, the chi-square distribution becomes more symmetrical.
  • 13.  The phi coefficient (ф) is used as a measure of the strength of association in the special case of table with two rows & two columns (a 2*2table).  The phi coefficient is proportional to the √ of the chisquare statistic.  Sample size n, this statistic is calculated as:- √χsquare/n. ф=
  • 14.  The phi coefficient is specific to a 2*2 table, the contigency coefficient (C) can be used to assess the strength of association in a table of any size.  Chi-square   :- C = √ / χsquare χsquare + n The contingency coefficient varies between 0 & 1. Where 0 value occurs in the case of no association (i.e., the variables are statistically independent), but the maximum value of 1 is never achieved. This value of C indicates that the association is not very strong. Another statistic that can be calculated for any table is Cramer’s V.
  • 15.    Cramer’s V is a modified version of the phi coefficient, ф , and is used in tables larger than 2* 2. When phi is calculated for a table larger than 2*2, it has no upper limit. Cramer’s V is obtaining by adjusting phi for either the number of rows o r the number of columns in the table, based on which of the two is smaller. For a table with r rows & c columns, the relationship between Cramer’s V and the phi correlation coefficient is expressed as :- V = √ф square / min(r-1), (c-1) Or V =  √χ square/n / min(r-1),(c-1) Another statistic commomly estimated is the lambda coefficient
  • 16.  Lambda assumes that the variables are measured on a nominal scale.  A symmetric lambda measures the % improvement in predicting the value of the dependent variable, given the value of the independent variable.  Lambda also varies between 0 & 1.  A value of 0 means no improvement in prediction.  A value of 1 indicates that the predication can be made without error.  This happens when each independent variable is associated with a single category of the dependent variable.
  • 17.        The previous section considered hypothesis testing to associations. Now we would be focusing on hypothesis testing related to differences. Hypothesis-testing procedures can be broadly classified as parametric or non-parametric, based on the measurement scale of the variables involved. Parametric tests assume that the variables of interest are measured on at least an interval scale. Non-parametric tests assume that the variables are measured on a nominal or ordinal scale. They are been further classified based on whether one, two, or more samples are involved. The no. of samples is determined based on how the data are treated for the purpose of analysis, not based on how the data were collected.
  • 18. Independent Samples Parametric Tests (Metric Data) Two Samples Paired Samples One Sample t =test z = test Two group t= test z = test Paired t test
  • 20.  Parametric Tests provide inferences for making statements about the means of parent population.  A t test is commonly used for purpose.  The test is based on the student’s t statistic .  The t statistic assumes that the variable is normally distributed, with mean is known (or assumed to be known), and the population variance is estimated from the sample.  One or two samples and compute the mean and standard deviation for each sample.
  • 21.  Non parametric tests are used when the independent variables are nonmetric.  Like parametric tests, nonparametric tests are available for testing variables from one sample, two independent samples, or two related samples
  • 22.  An important nonparametric test for examining differences in the location of two populations based on paired observations is the Wilcoxon matched-pairs signed-rank test.  The test analyzes the differences between the paired observation, taking into account the magnitude of the differences.  It computes the differences between the pairs of variables and ranks the absolute differences.  The next step is to sum the positive & negative ranks.