Download to read offline


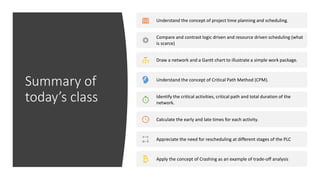
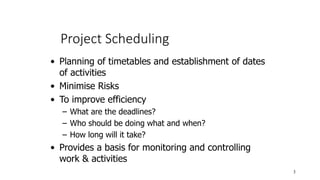

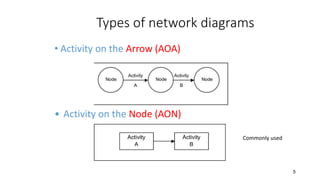
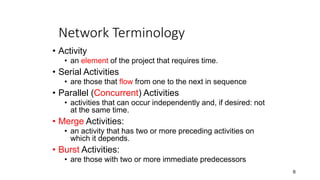
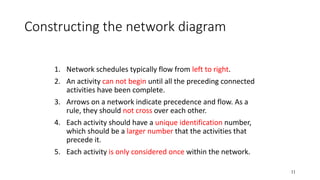
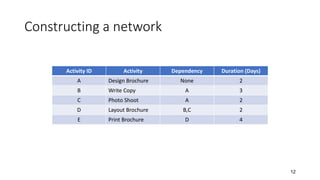

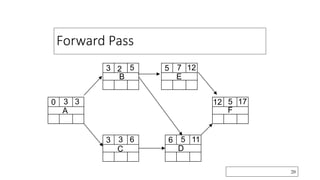
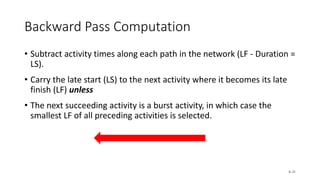
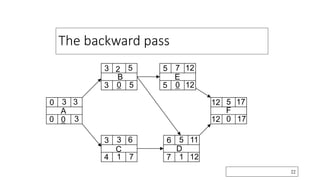
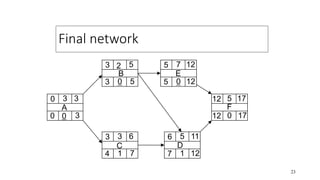


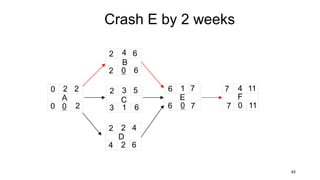
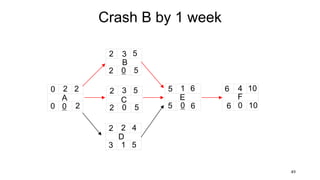
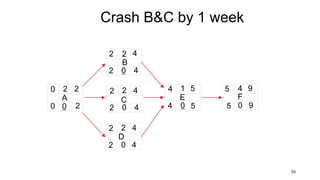
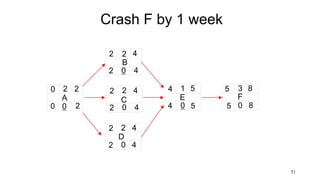
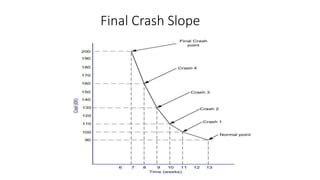


The document covers project management scheduling, focusing on concepts such as project time planning, critical path method (CPM), and various scheduling techniques including Gantt charts and network diagrams. It emphasizes the importance of defining and sequencing activities, estimating durations, and controlling project schedules while discussing trade-offs in resource allocation and project crashing. Additionally, comparisons between logic-driven and resource-driven scheduling, as well as deterministic and probabilistic scheduling, are explored.


