Download to read offline


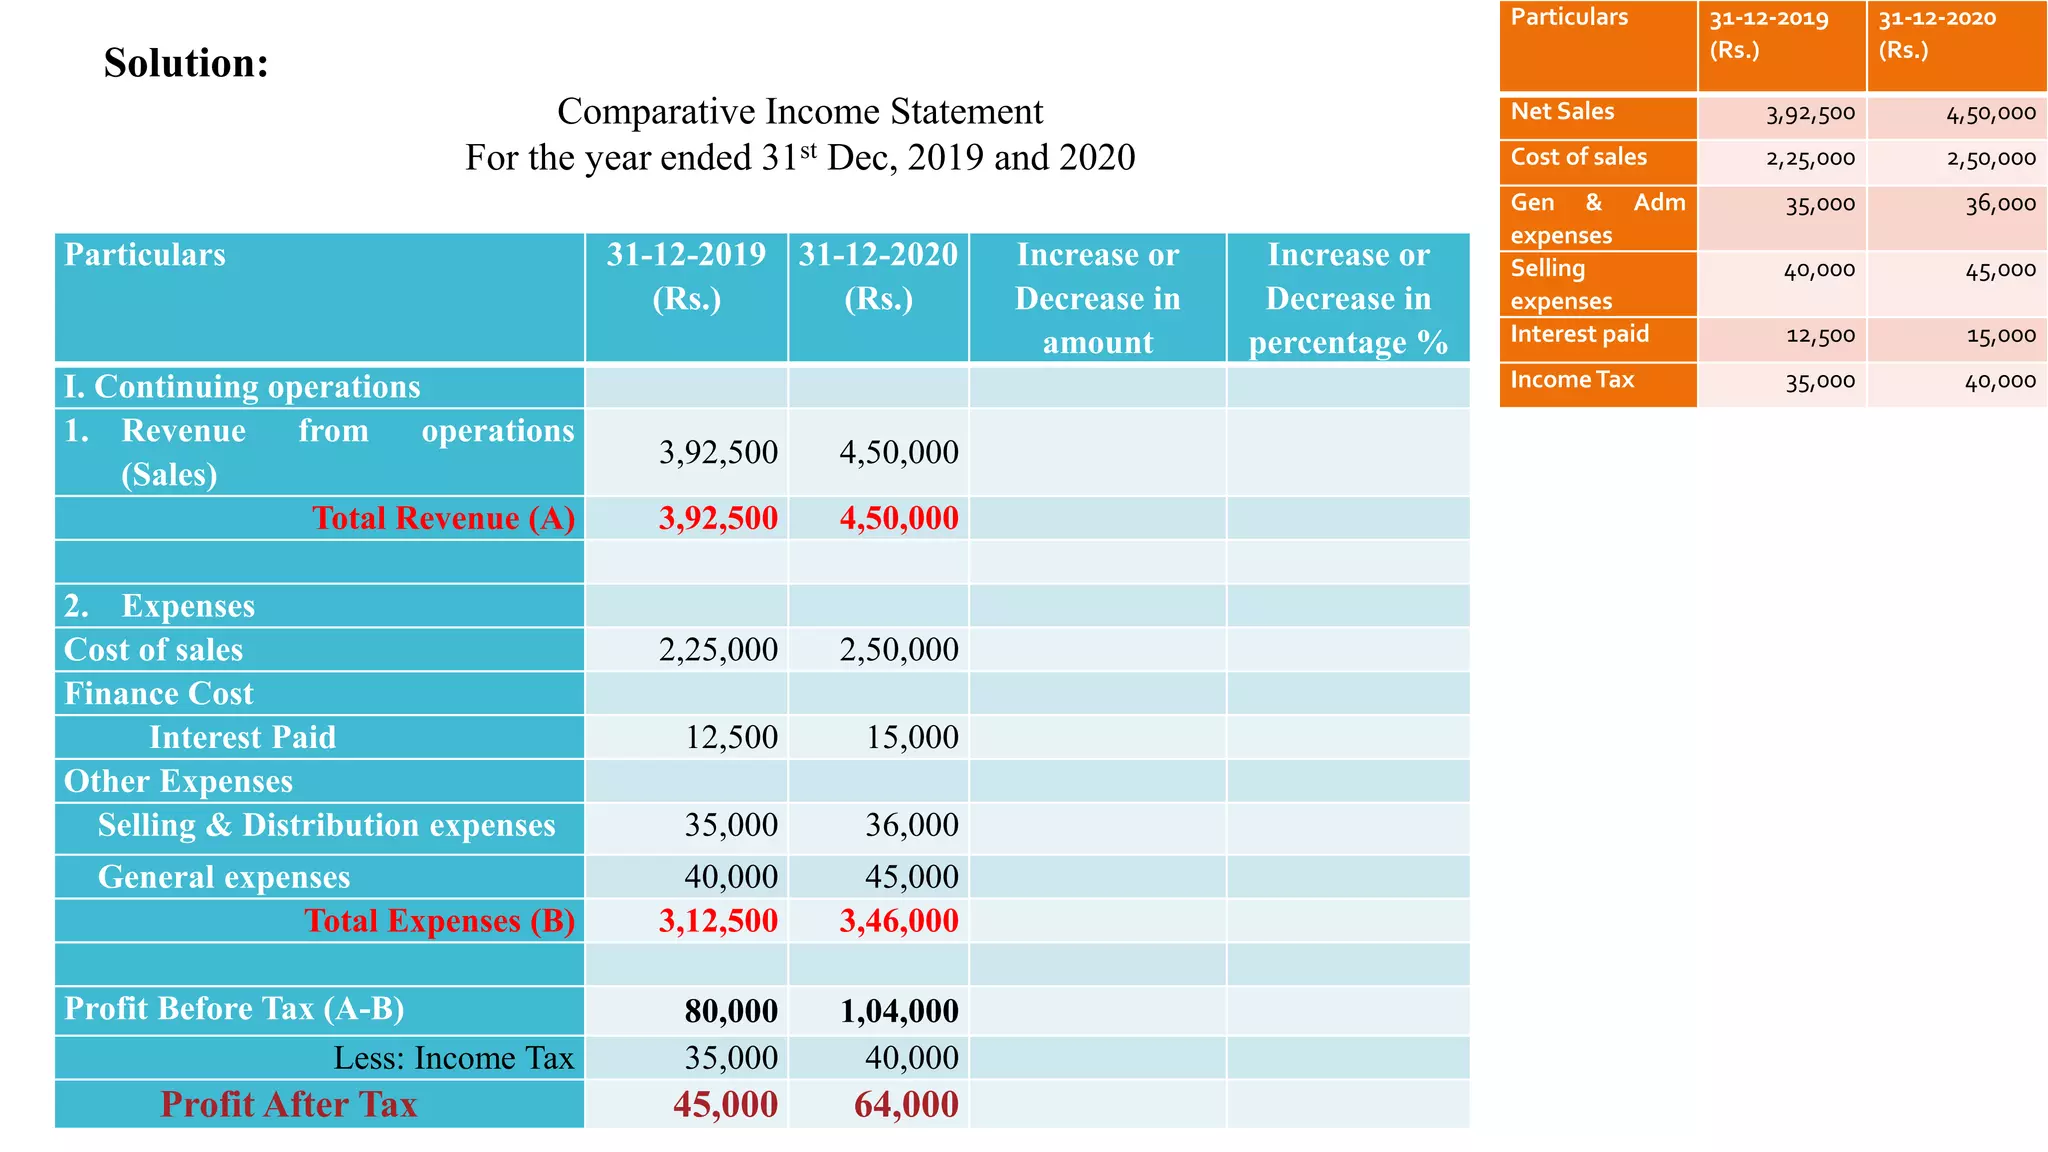
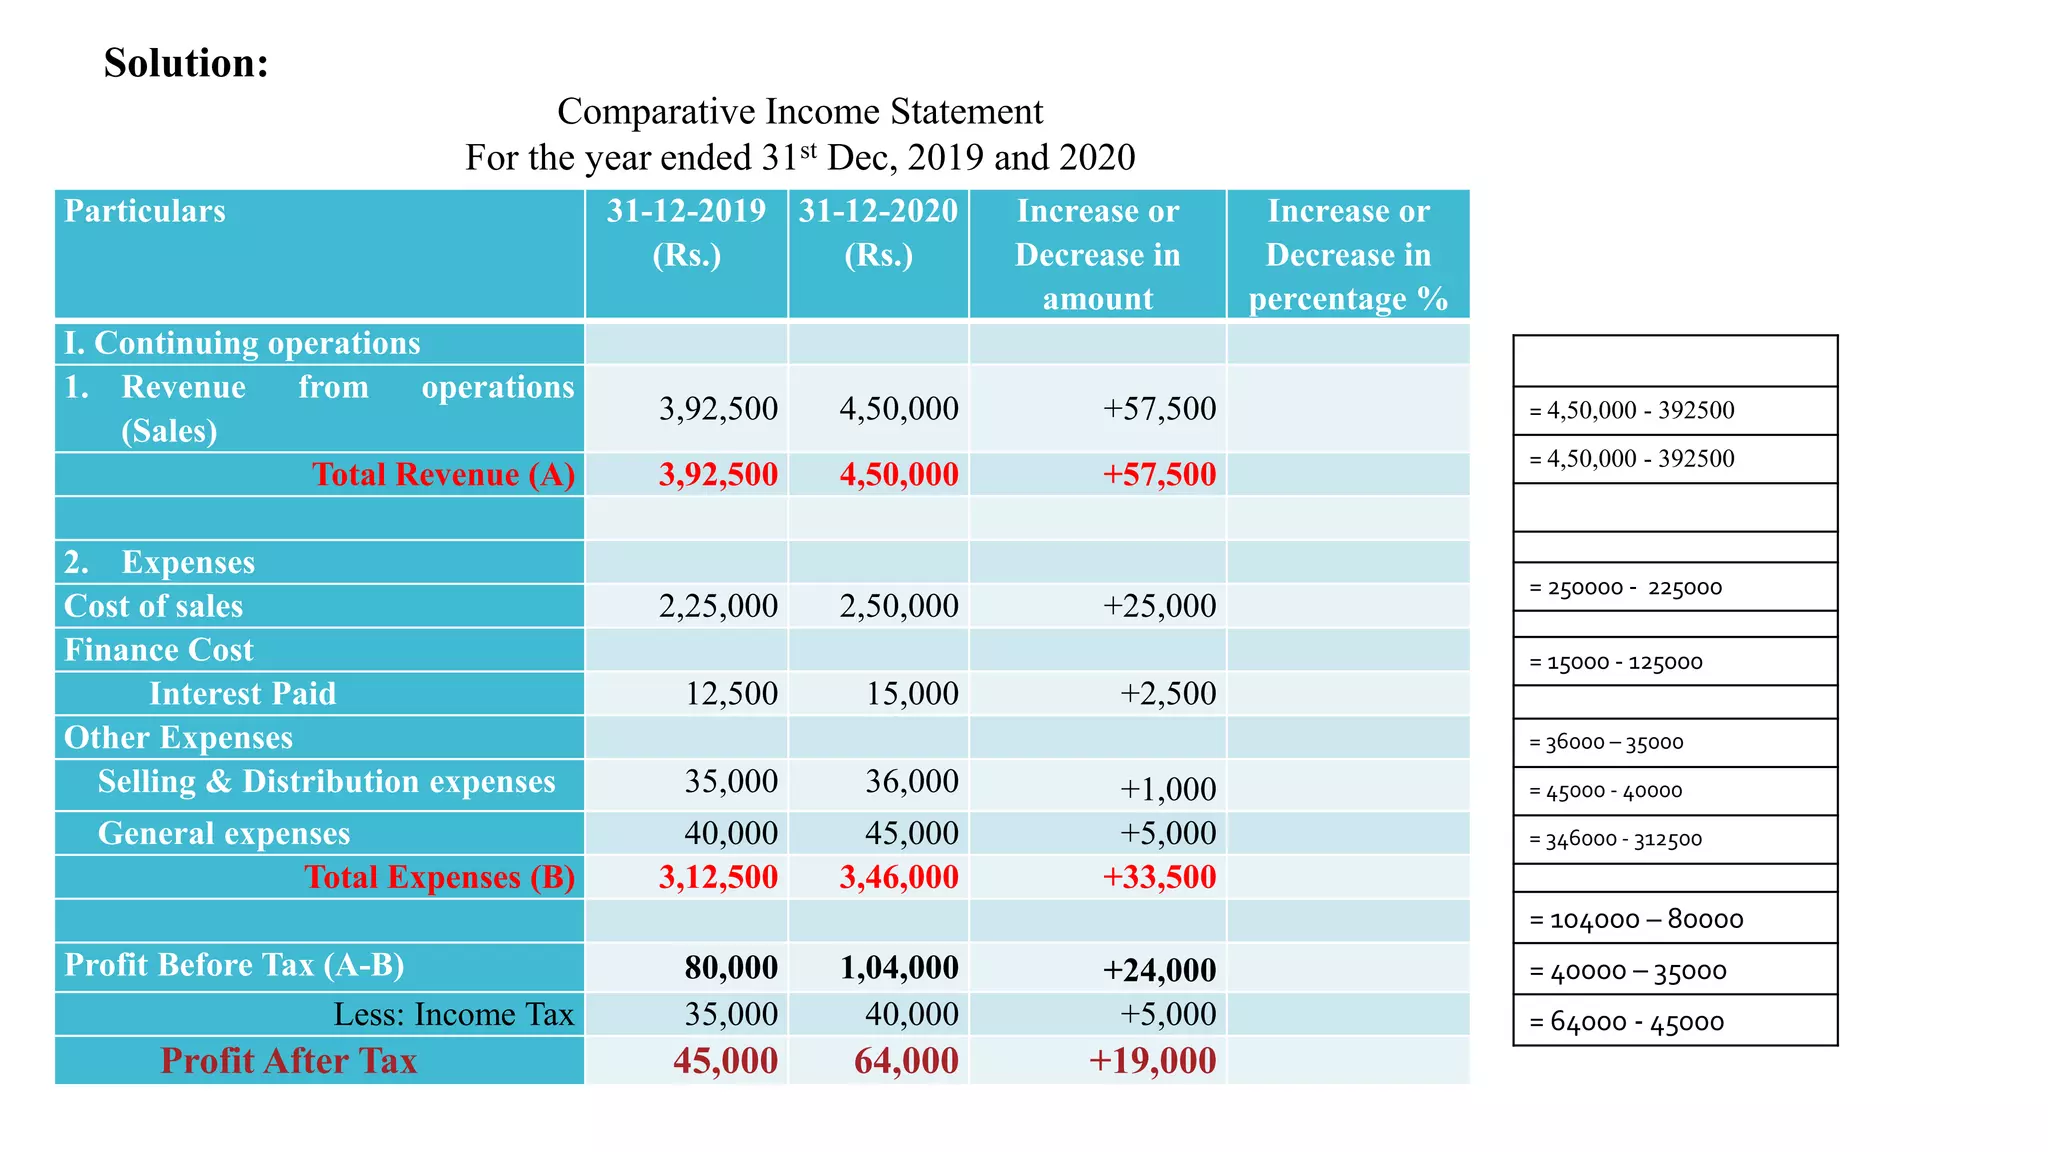


The document provides information on comparative financial statement analysis including examples of comparative income statements for two companies. The first example compares the income statement of a company for the years ending December 31, 2019 and 2020. It shows increases in most line items including net sales, cost of sales, expenses and profit. The second example compares the income statement of another company for 2019 and 2020. It also shows increases in most line items, including revenue, expenses and profit, with the exception of other income and finance costs which decreased. Percentage increases and decreases are also provided. The document concludes with an illustration showing how to calculate sales figures for a comparative income statement based on given cost of sales and profit margin information for two