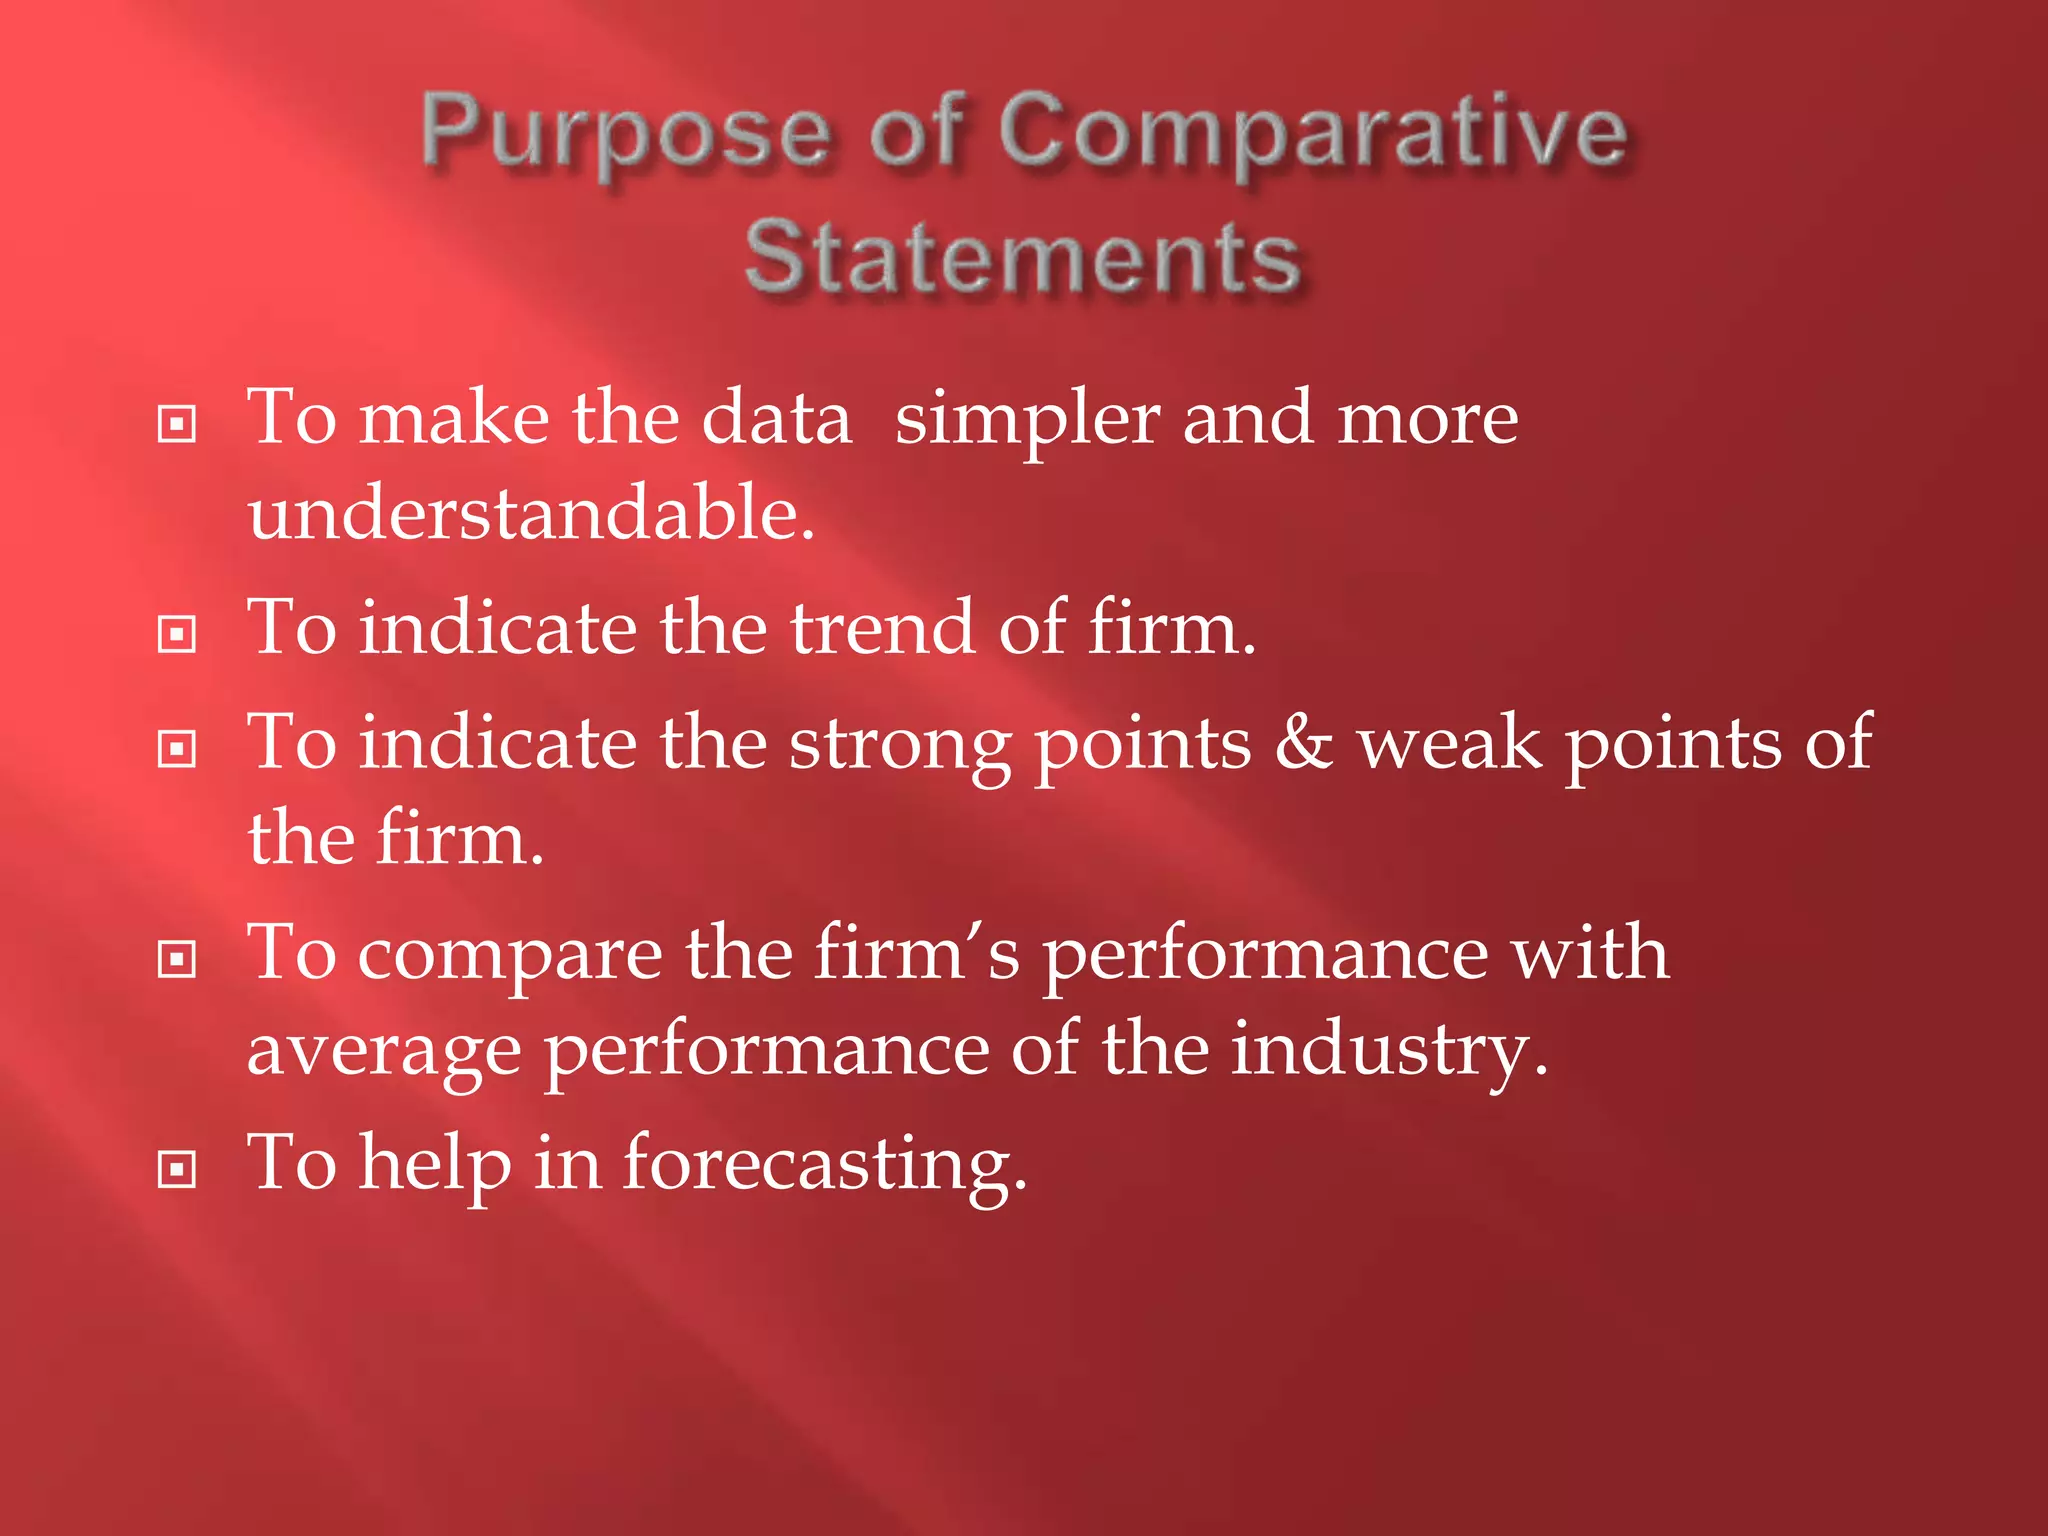
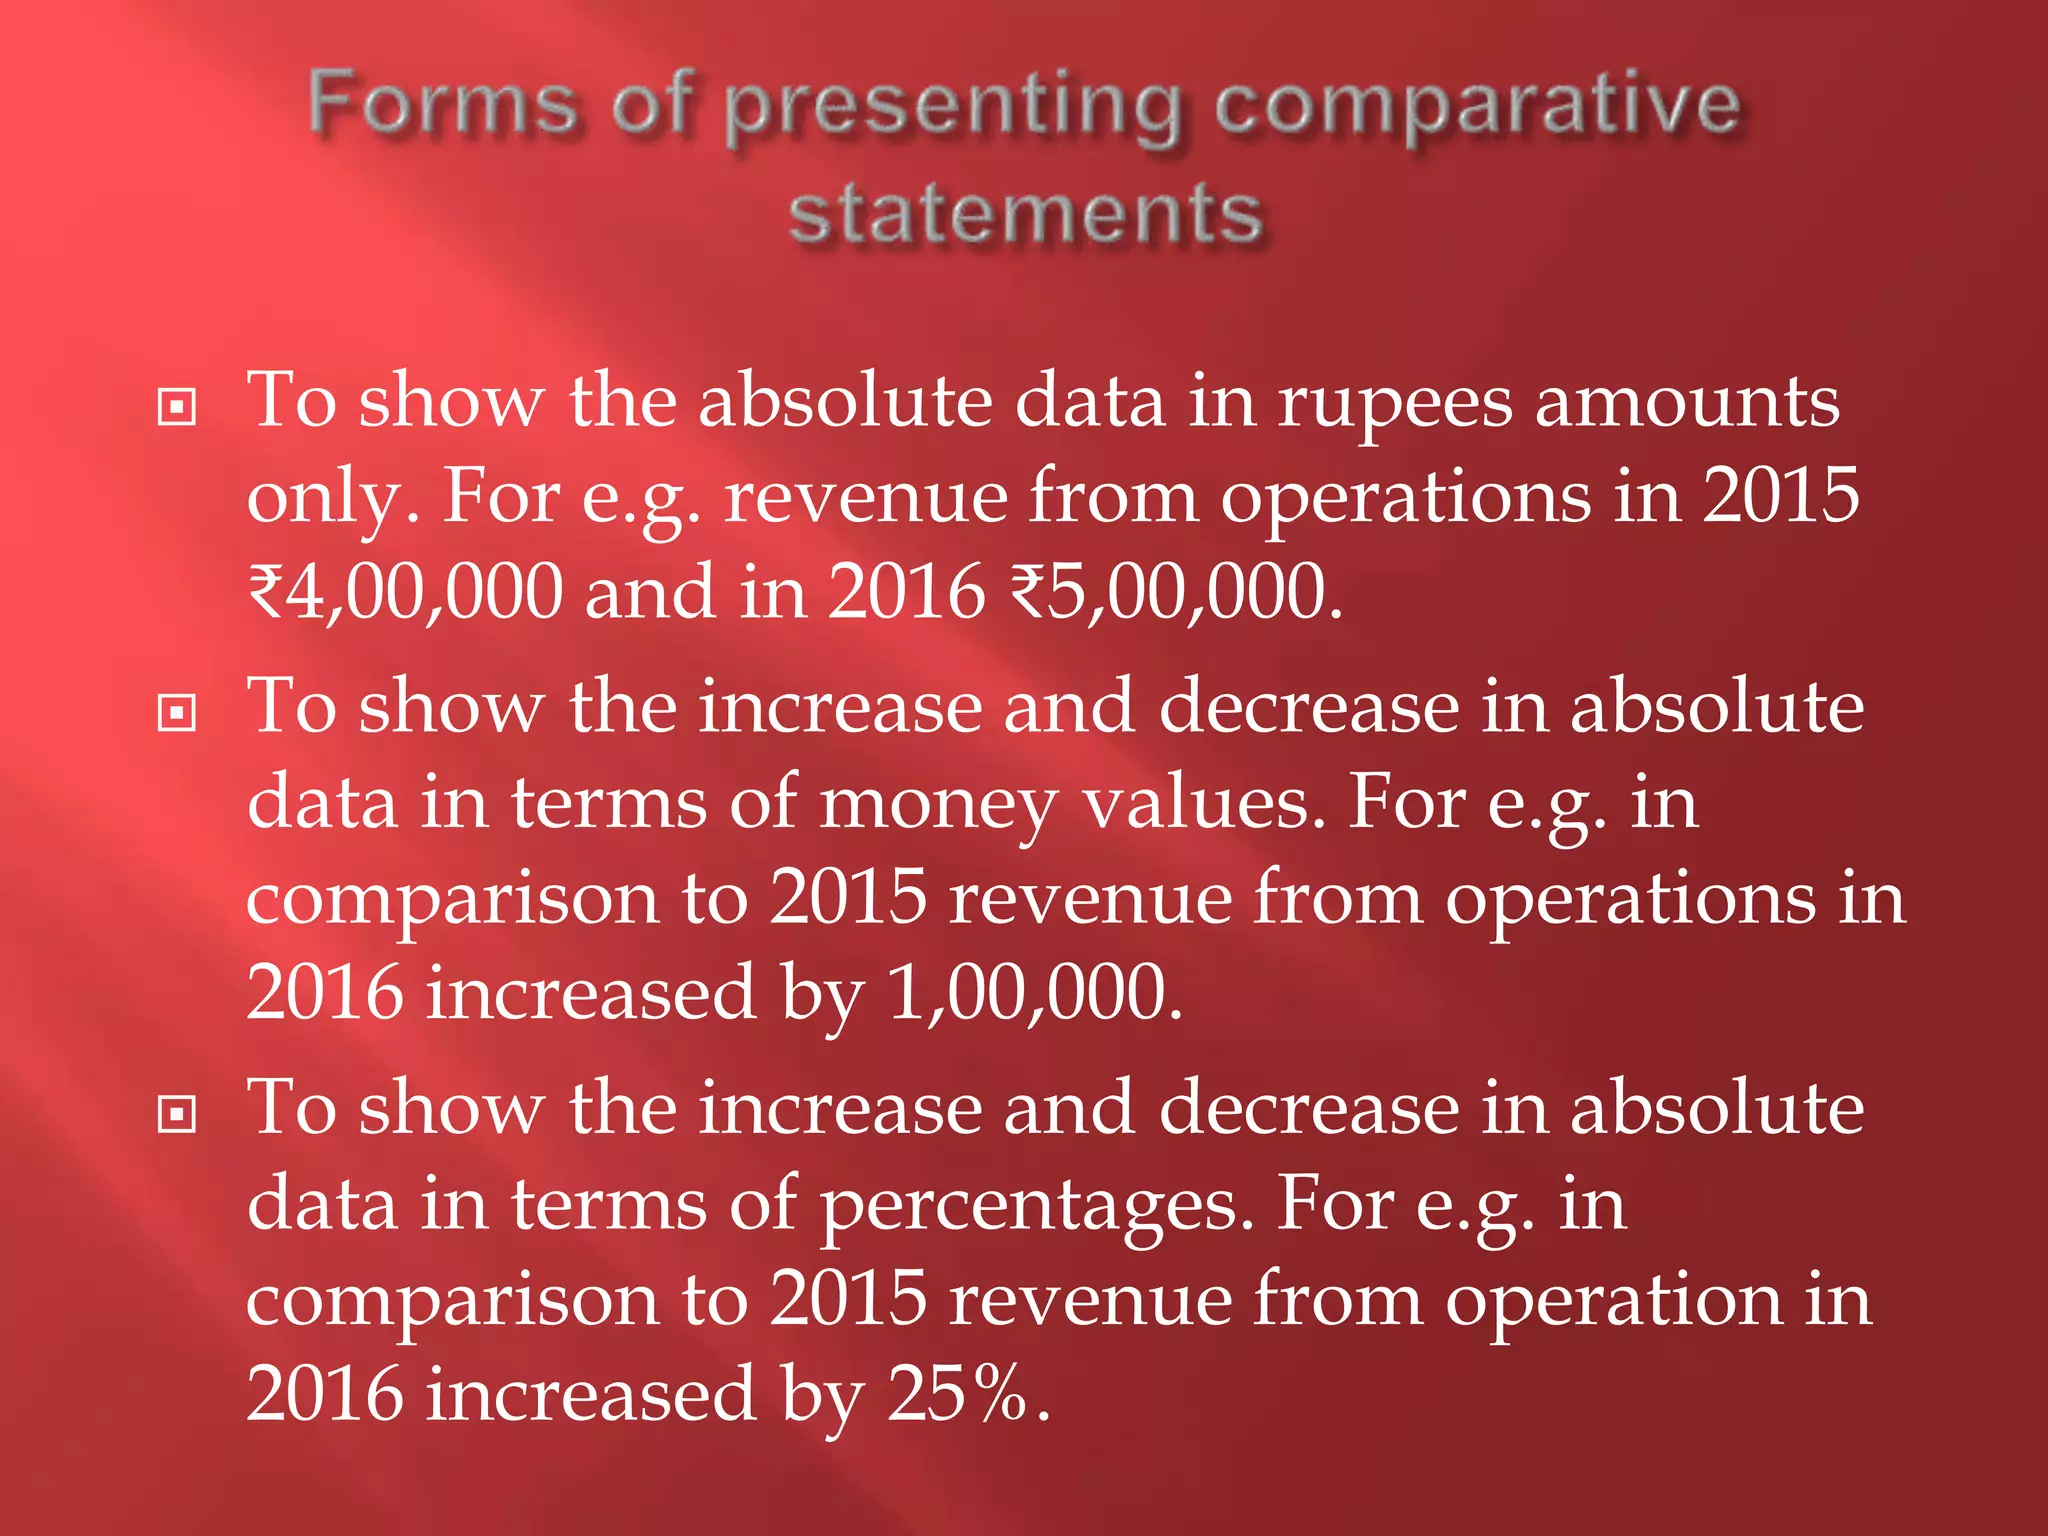
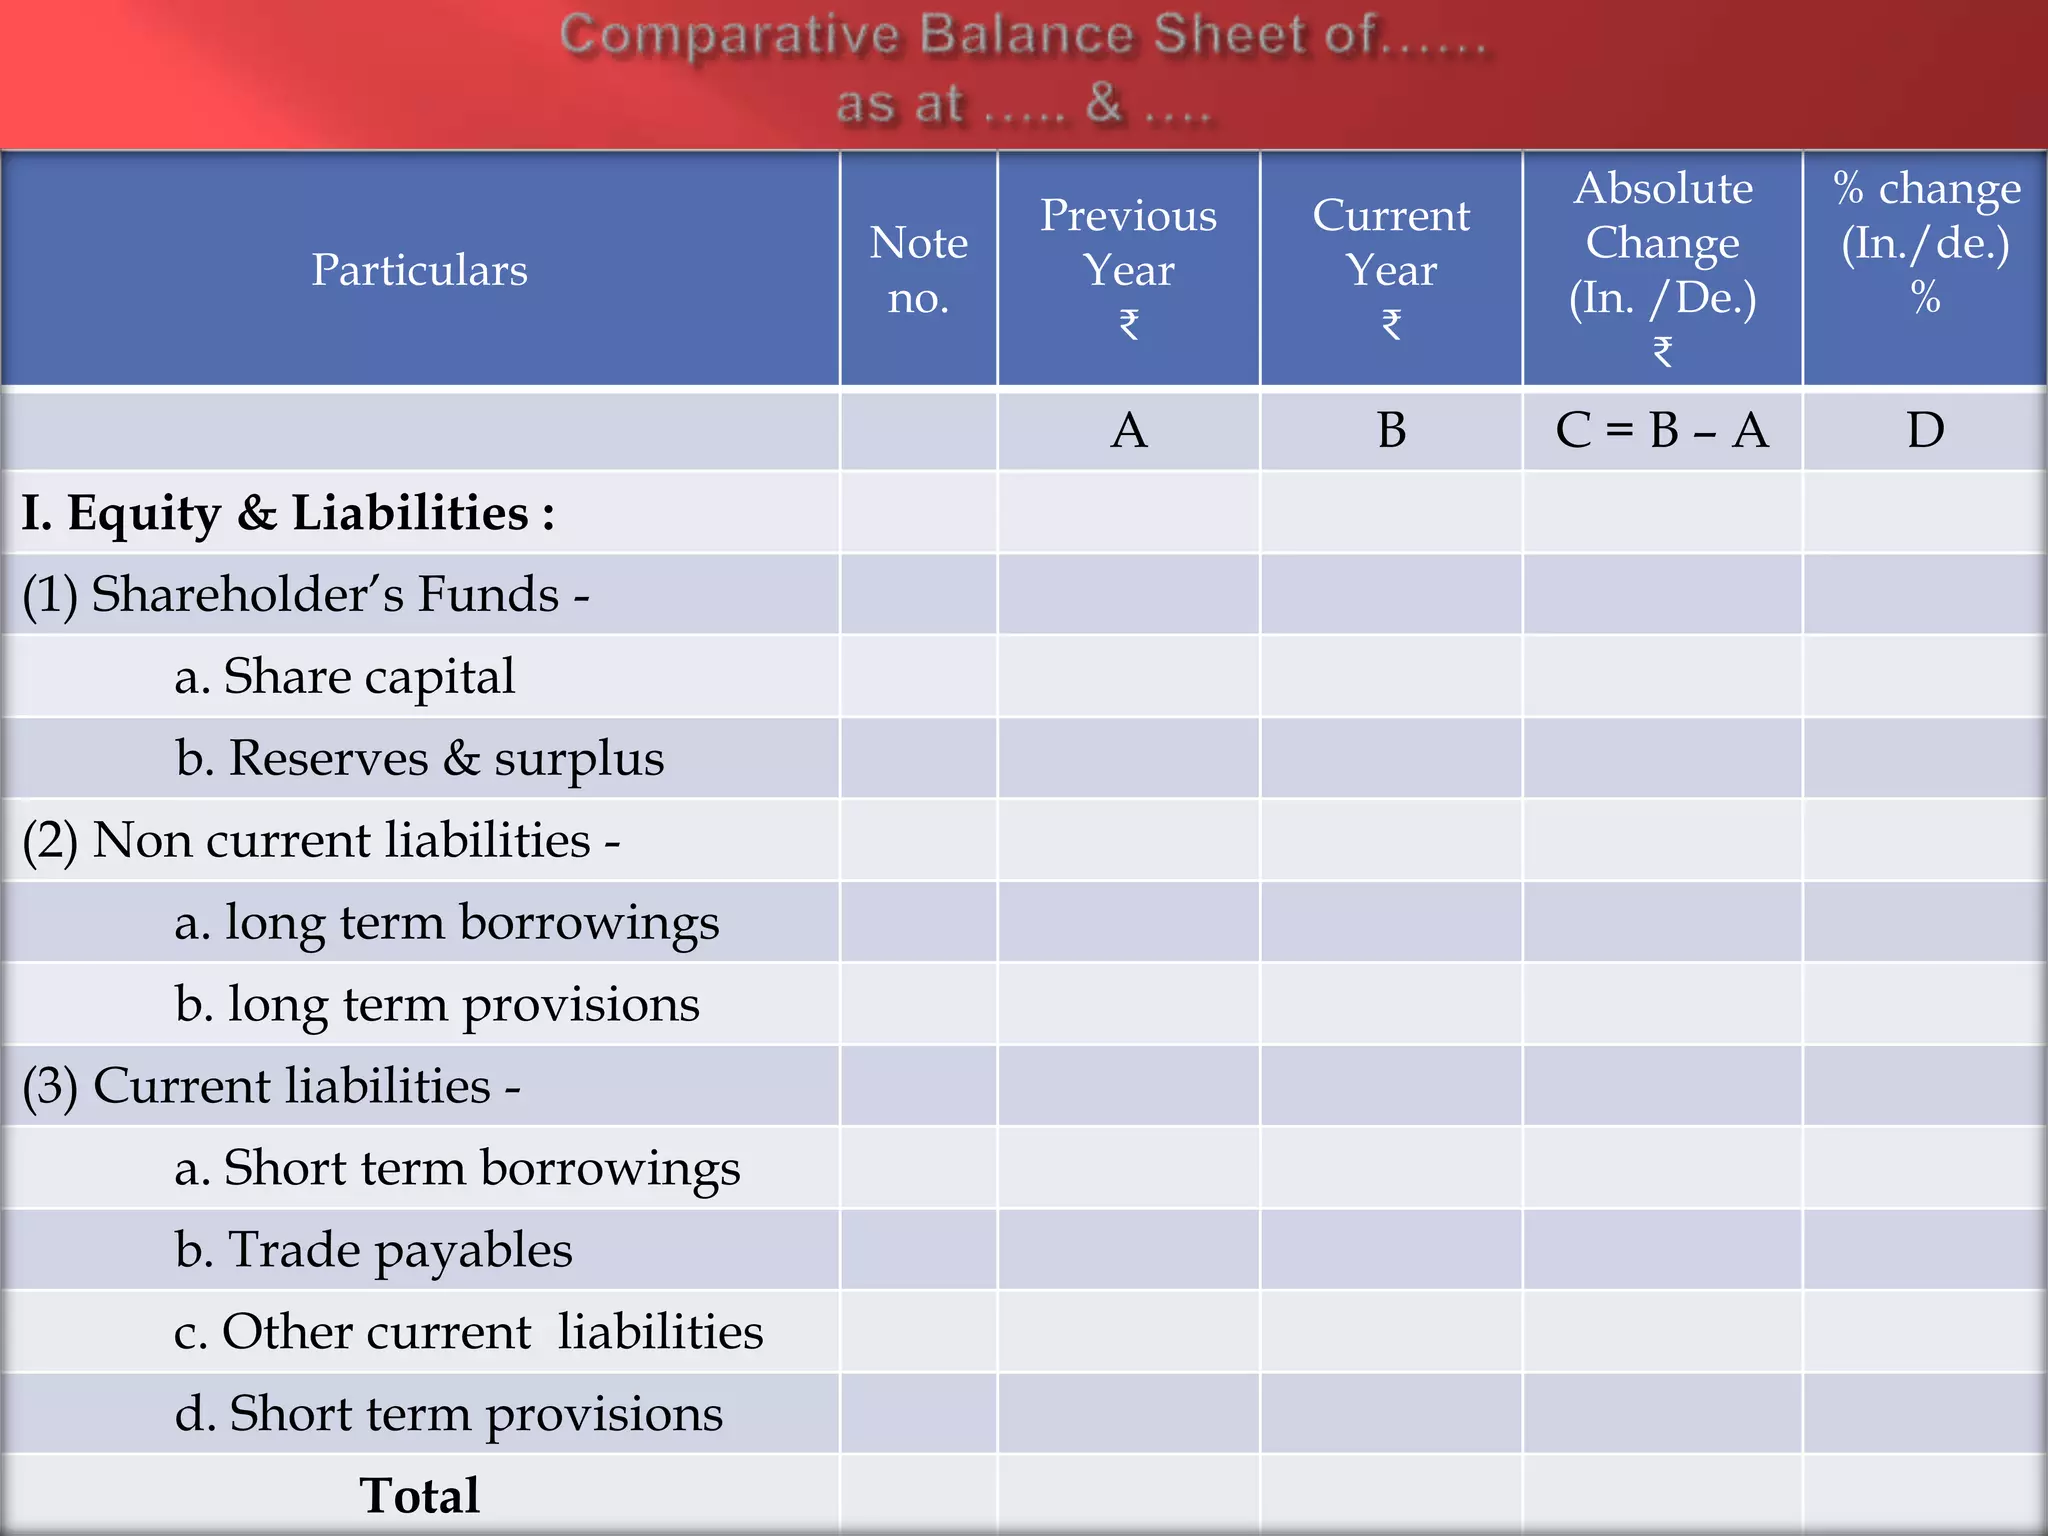
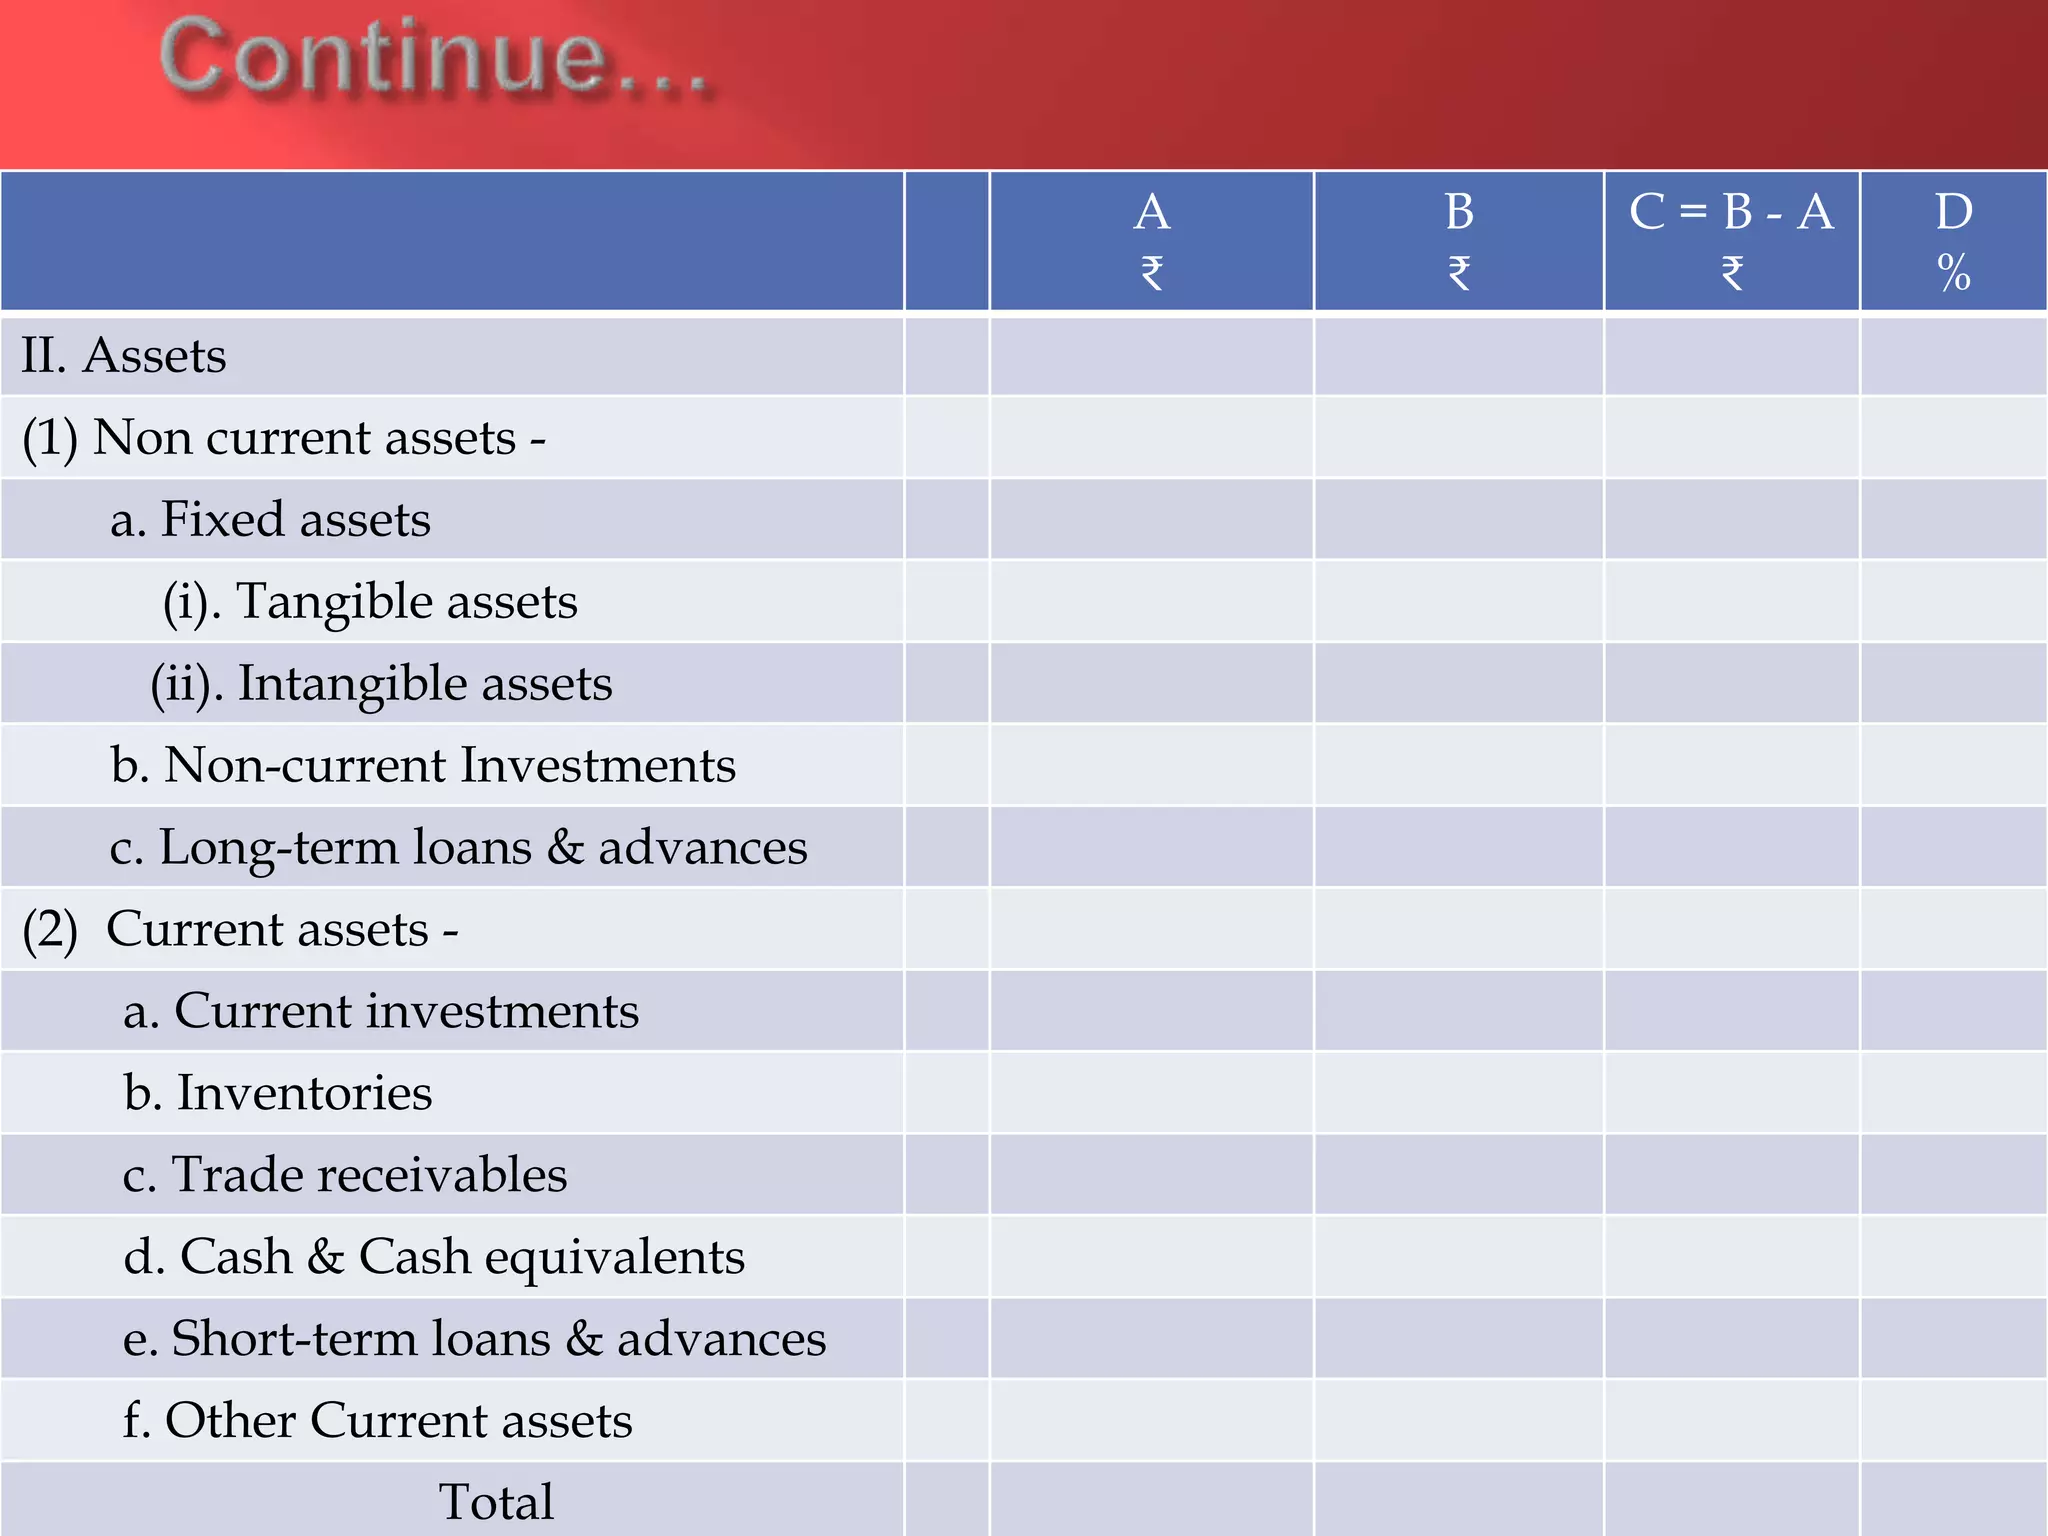
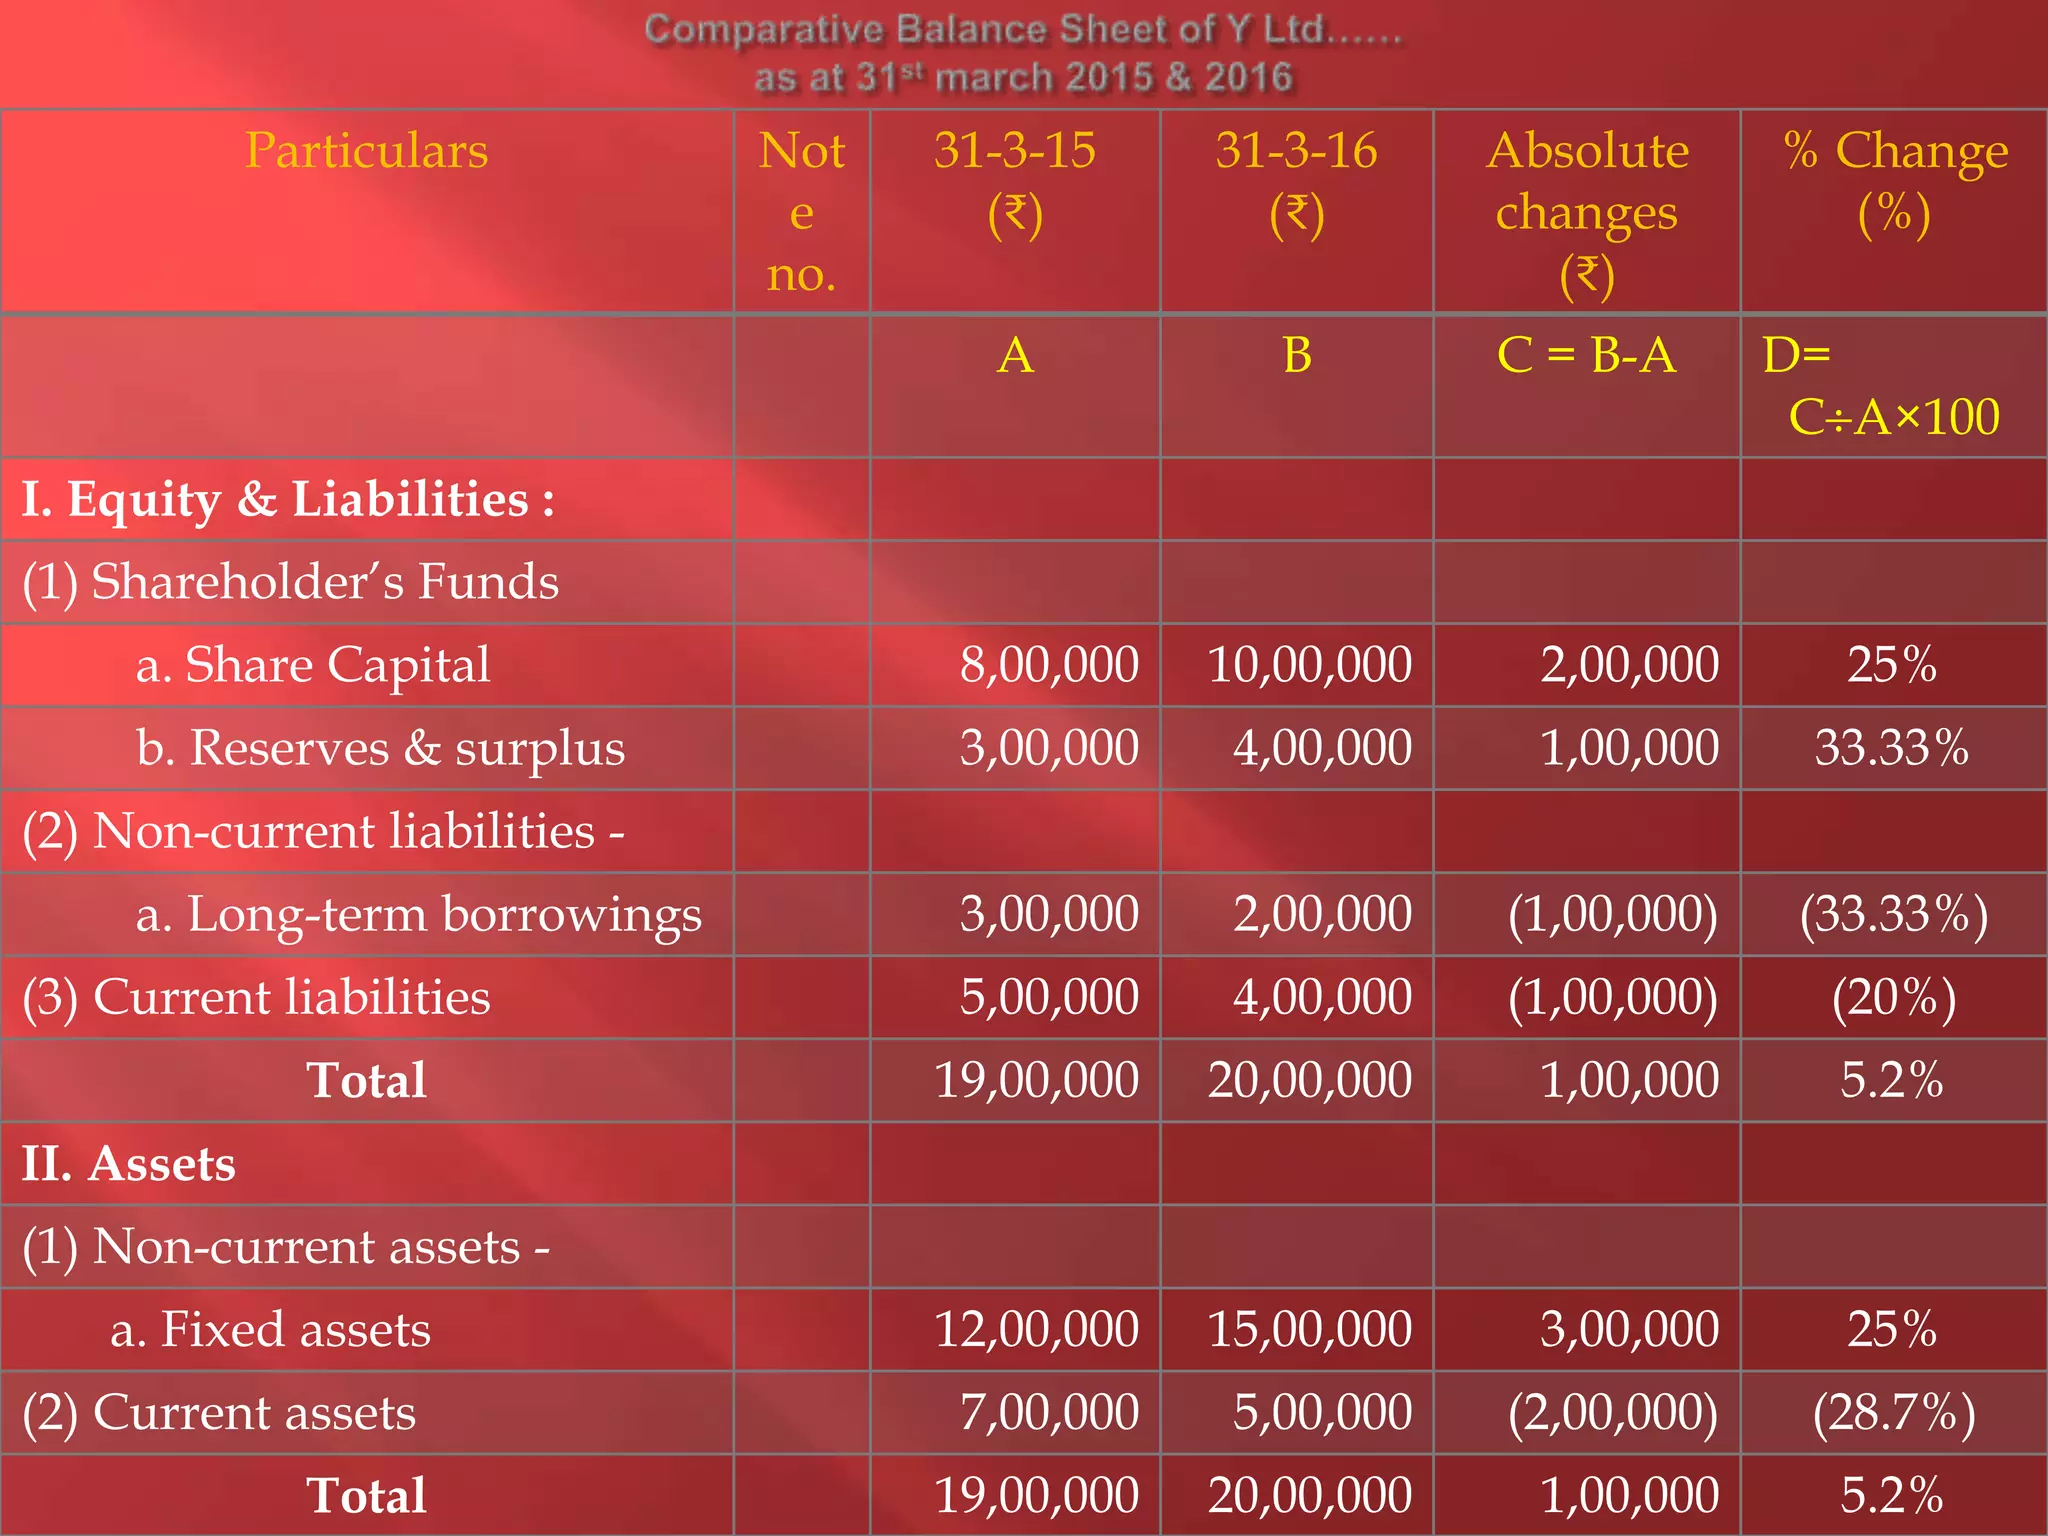
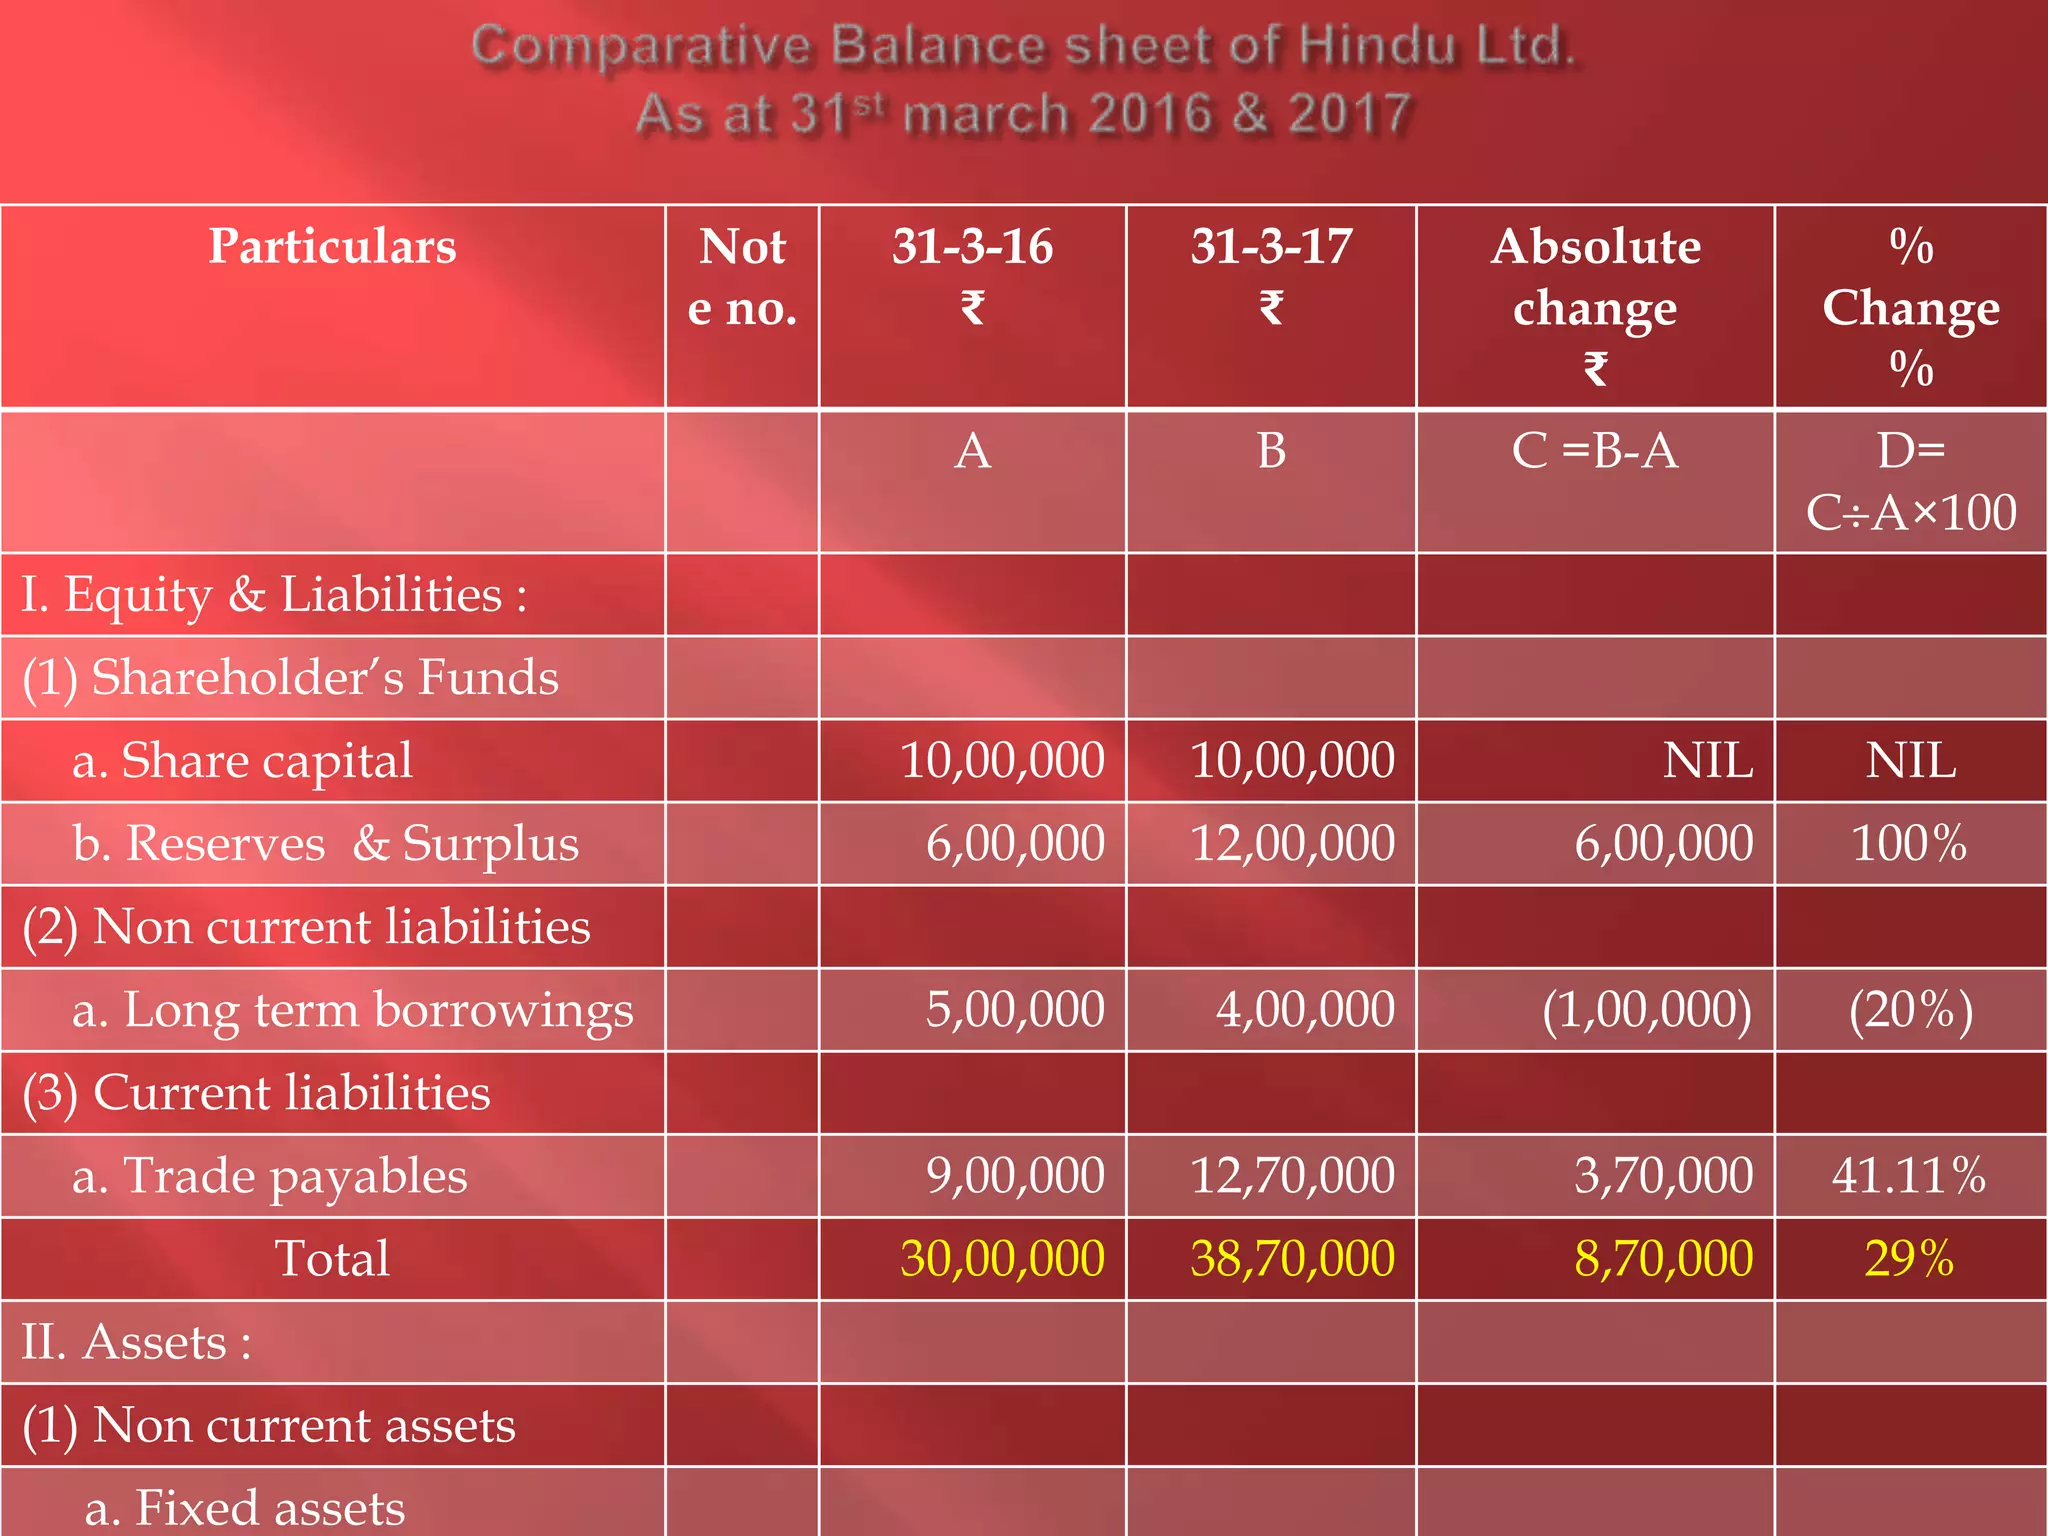
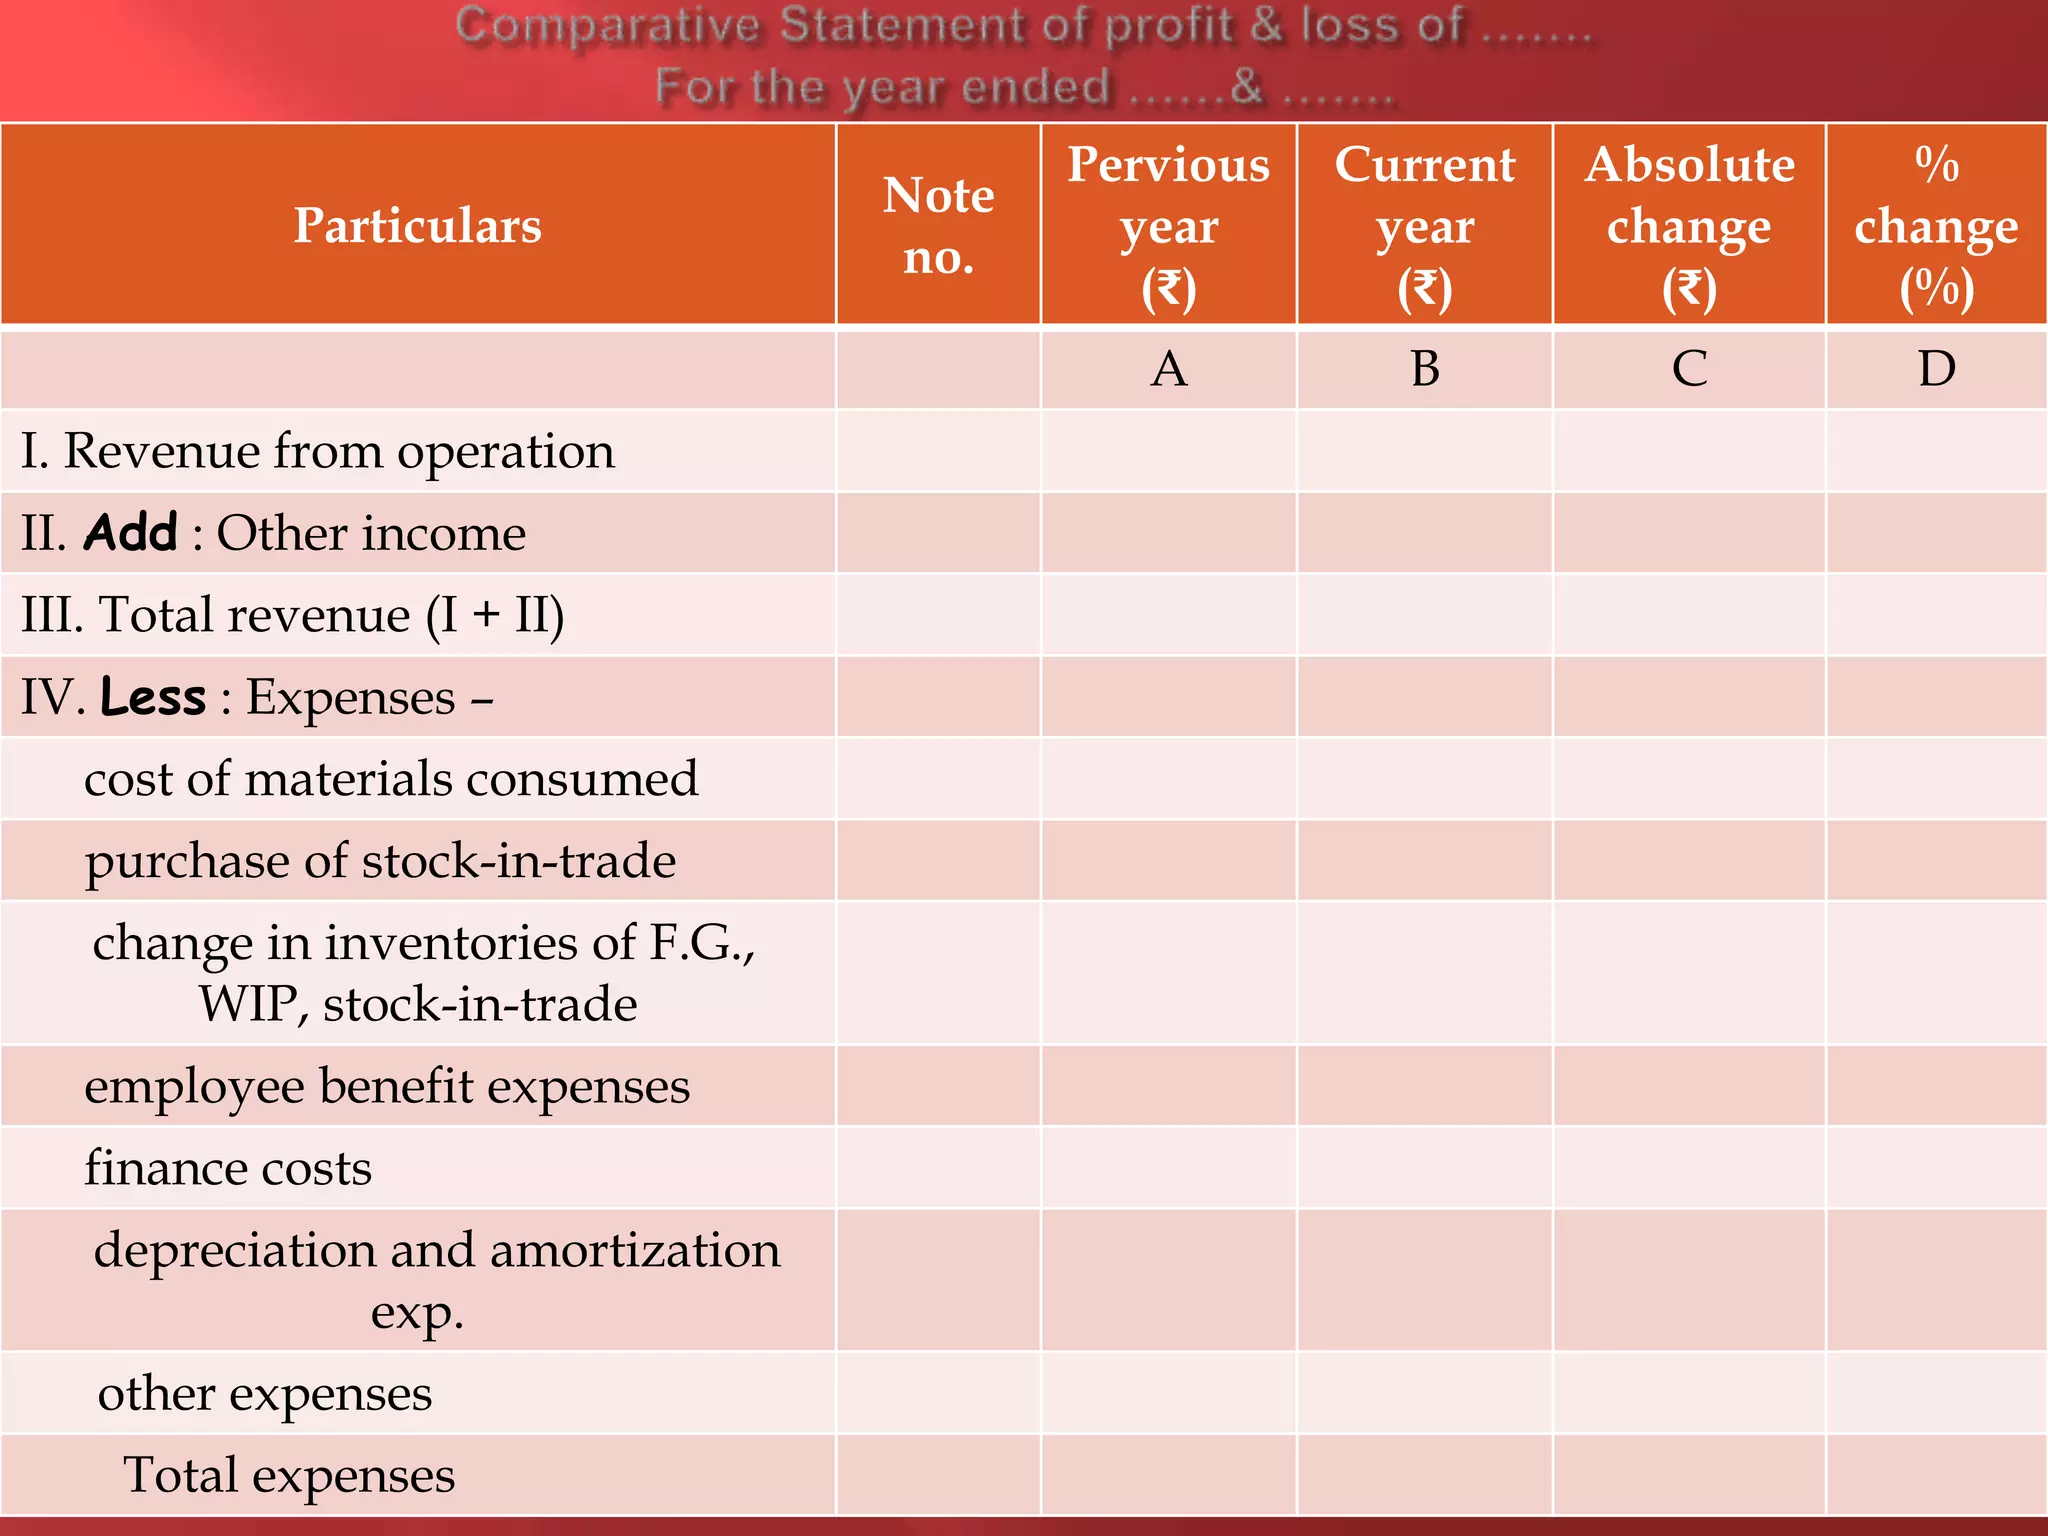
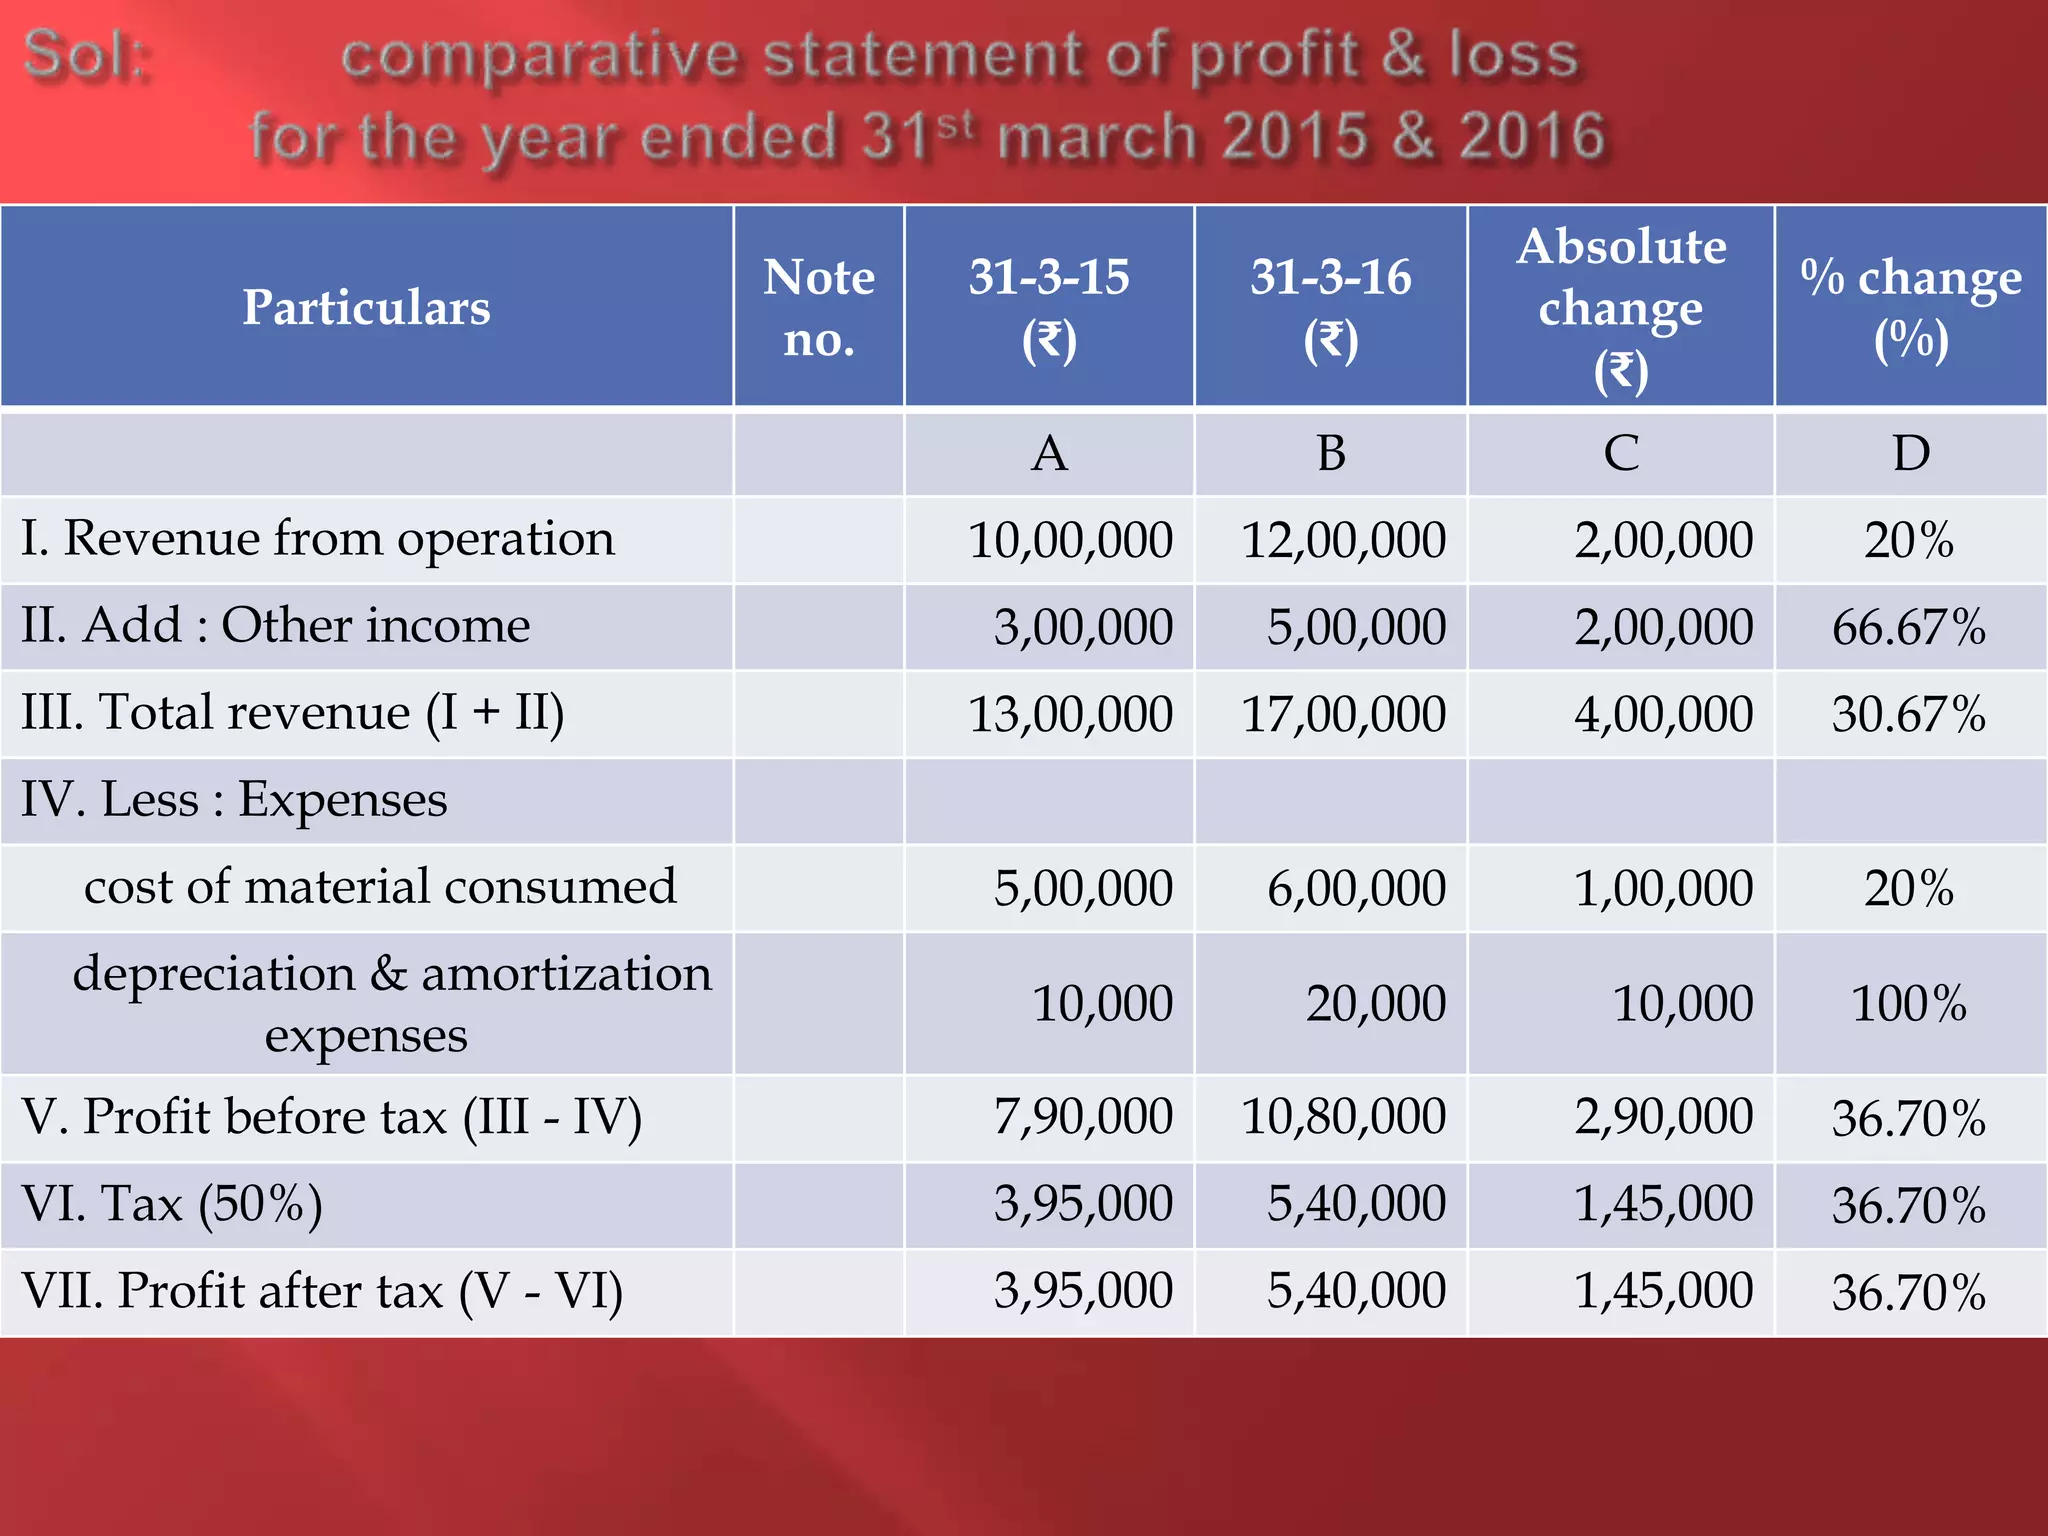
Meaning
Purpose
Forms of presenting comparative statement
Comparative Balance Sheet
Advantage of comparative balance sheet
Format of comparative balance sheet
Illustration
Exercise
Comparative statements of profit & loss
Objective of comparative statement of profit & loss
Format of comparative statement of profit & loss
Illustration
Exercise
1. to understand the basic principles of Material Control
2. to study the procedures of Purchase, Storing and Issues
3. to acquaint with the latest techniques in inventory control
4. to understand the pricing of issues
1. to understand the basic principles of Material Control
2. to study the procedures of Purchase, Storing and Issues
3. to acquaint with the latest techniques in inventory control
4. to understand the pricing of issues
Common Size Income Statement and Balance Sheet | AccountingTransweb Global Inc
“An Income Statement or profit and loss account (also referred to as a profit and loss statement (P&L), statement of profit or loss, revenue statement, statement of financial performance, earnings statement, operating statement, or statement of operations) is one of the financial statements of a company and shows the company’s revenues and expenses during a particular period.” (Helfert, Erich A. 2001). Copy the link given below and paste it in new browser window to get more information on Common Size Income Statement and Balance Statement:- http://www.transtutors.com/homework-help/accounting/common-size-income-statement-and-balance-sheet.aspx
Meaning
Purpose or utility of common size statement
Common Size Balance sheet
Purpose of common size balance sheet
Format of common size balance sheet
Illustration
Exercise
Common Size Statement of profit & loss
Purpose of common size statement of profit & loss
Format of common size statement of profit & loss
Illustration
Exercise
This presentation is made by Toran Lal Verma. Meaning, nature, and scope of Financial Management are discussed. scope and objectives of financial management have been discussed along with merits and demerits.
Management Accounting - Trend Analysis - Income Statementuma reur
Meaning of Trend Analysis:
Comparison of past data over a period of time with a base year is Trend Analysis.
It computes the changes in percentage for different variables over a long period and then makes a comparative study of them.
Each item in the base year is taken as 100 and on that basis, trend analysis for the corresponding items in the other years are calculated.
Compute the trend percentage from the following data taking 2010 as the base year.
Comparative balance sheets of two or more different dates can be used for comparing assets and liabilities and finding out any increase or decrease in those assets.
A comparative balance sheet has four columns:
First Column, Last year’s absolute figures.
Second Column, Current year’s absolute figures.
Third Column, increase or decrease in figures as recorded plus(+) for increase and minus(-) for decrease.
Fourth Column, percentage of increase or decrease.
Meaning of financial statement
Objectives of financial statement
Characteristics of financial statement
Nature of financial statement
Balance sheet
Format of balance sheet
Illustrations
Exercises
Statement of profit & loss
Format of statement of profit & loss
Notes of statement of profit &loss
Illustrations
Exercises
Reconstruction of Companies problem with answer is discussed in this PPt.
#ReconstructionofComapnies
#Dr MamataRathi
#InternalReconstruction
#Externalreconstruction
#ReconstructionNotes
#ReconstructionBcomSY
#Accounting
#Corporate Accounting
Strategies To Overcome Bankruptcy PowerPoint Presentation SlidesSlideTeam
Strategies To Overcome Bankruptcy PowerPoint Presentation Slides is a virtual solution for astute business professionals. Our well-structured PowerPoint theme is suitable to showcase strategies to avoid bankruptcy. Elaborate on the influence of bankruptcy on an organization and illustrate ways to settle outstanding debts. Elucidate the financial health from the last 3 years, current risk areas, and unsettled liabilities to represent the present scenario. Utilize our issues of bankruptcy PPT template deck to present a detailed financial investigation. Portray key financial ratios, income statement, balance sheet, and cash flow statement. Our challenges of insolvency PowerPoint presentation help you in consolidating the impact, and future forecast after implementing strategies on the organization. Employ tabular format to compile methods of communicating with the stakeholders. Describe bankruptcy risk identification and mitigation strategies through this PPT slideshow. Address the bankruptcy process including the filing procedures and consequences. So, hit the button and begin instant personalization. Our Strategies To Overcome Bankruptcy PowerPoint Presentation Slides are explicit and effective. They combine clarity and concise expression. https://bit.ly/386saCu
This ppt is about and Indirect method cash flow statwment and the various activities considered under it. it attempt's to describe the direct and indirect method of preparing cash flow statement
this covers the following topics
Meaning of Accounting
Characteristics of accounting
Objectives of accounting
Sub-fields of Accounting
Advantages & Disadvantages of Accounting
Book-keeping, Accounting & Accountancy
Users of accounting
also get video of this topics
Introduction of accountancy Part - I
https://youtu.be/NzDaR13kCxQ
Introduction to Accountancy Part - II
https://youtu.be/2SA_vH4txWM
watch these videos to understand these topics
this ppt is helpful for BBA/B.tech//MBA/M.tech students.
the ppt is on simulation topic...its covers -
Meaning
Advantages & Disadvantages
Uses
Process
Monte Carlo SImulation
Advantages & Disadvantages
Its example
THIS ASSIGNMENT IS ON QUALITY AWARDS-
THIS COVERS -
Meaning of Quality
Meaning of Quality Awards
Types of Quality Awards
Quality Parameters
CASE STUDY -
Ceat Tyres
Lava International Limited
Tata Power Solar
Conclusion
Bibliography
Supply Chain Management Assignment on ITC- DiversificationYamini Kahaliya
This is report on supply chain management of ITC- Diversification.
this is beneficial for the BBA/b.om /mba students.
this includes following topics -
Supply chain
Supply chain management
Key benefits of supply chain management
Goals of supply chain management
Process of supply chain management
Types of process floe of supply chain
Introduction of company
Supply chain of Cigarettes
Supply chain of Agarbattis
Supply chain of e-Choupal
Supply chain of hotel
Supply chain of paper
Conclusion
Bibliography
ASSIGNMENT ON IMPACT OF GLOBALISATION ON TOYOTAYamini Kahaliya
this is my college assignment on impact of globalisation on Toyota. this is beneficial for BBA/B.com/MBA/M.com students.
it covers following topics -
Meaning of Globalization
Positive impact of Globalization
Negative impact of Globalization
Case study on Toyota
Introduction
Impact of globalization on Toyota
Production graph of Toyota
Conclusion
Bibliography
PROJECT MANAGEMENT - ASSIGNMENT ON BRIDGE CONSTRUCTION PLAYS A ROLE OF PROJEC...Yamini Kahaliya
This Assignment is on role of project manager in the bridge construction.
the subject is project management
this is beneficial for bba/mba students
covers the following topics -
Meaning of Project Management
Meaning & role of Project Manager
Project Life Cycle
Introduction
First step
Second step
Third step
Fourth step
Fifth step
Conclusion
Bibliography
Security Analysis & Portfolio Management Assignment on Mutual Fund Of SBIYamini Kahaliya
This is the project report on SBI mutual fund.
it contains following topics -
Meaning of Mutual Fund
Types of Mutual Fund
Introduction of Organisation
Key information of SBI mutual funds
Different types of SBI mutual fund
Conclusion
Bibliography
this is for BBA/B.com/MBA students
Supply Chain Management Assignment on Lean manufacturing wit real life Exampl...Yamini Kahaliya
This document is on Lean manufacturing with real life example of Jaguar company.
this is short assignment.
it includes -
1. Meaning of Lean manufacturing system
2. Objective of Lean manufacturing system
3. Principles of lean manufacturing system
4. Types of waste in traditional production system
5. Tools & Techniques of Lean manufacturing system
6. Case study on Jaguar -
7. Introduction of Company
8. Case study
9. Conclusion
10. Bibliography
International business assignment on Globalization of Toyota (For BBA/B.com S...Yamini Kahaliya
in this project report the focus is on globalization impact on Toyota.
the topics covered in this assignment are :-
1. Meaning of globalization
2. Positive & Negative impact of Globalisation
3. case study on Toyota (impact of Globalisation)
this assignment beneficial for BBA/B.Com students.
Introduction of Security analysis & portfolio managementYamini Kahaliya
this is ppt on introduction of security analysis & portfolio management.this ppt is for BBA/B.com/Mba students. this is related to finance. this ppt is in easily & understandable language.....
This PPT contains the full detail of topic leverage in financial management
it covers following topics :-
Meaning of Leverage
Types of Leverage
Operating Leverage
Financial Leverage
Difference between Operating & Financial Leverage
Combined Leverage
Illustrations
Exercise
for purchasing this pdf click on below link :
https://www.instagram.com/ysyastore/
this is the PDF of subject Human resource management.
this PDF is in simple & easily understandable language.
it covers the following chapters:-
1.Introduction of Human Resource Management
2.Human Resource Planning
3.Job Analysis
4.Recruitment & Selection
5.Training
6.Performance Appraisal
7.Executive Development programme
8.Remuneration
9.Wage rate System
10.Dispute
11.Trade union
Macroeconomics- Movie Location
This will be used as part of your Personal Professional Portfolio once graded.
Objective:
Prepare a presentation or a paper using research, basic comparative analysis, data organization and application of economic information. You will make an informed assessment of an economic climate outside of the United States to accomplish an entertainment industry objective.
Unit 8 - Information and Communication Technology (Paper I).pdfThiyagu K
This slides describes the basic concepts of ICT, basics of Email, Emerging Technology and Digital Initiatives in Education. This presentations aligns with the UGC Paper I syllabus.
Francesca Gottschalk - How can education support child empowerment.pptxEduSkills OECD
Francesca Gottschalk from the OECD’s Centre for Educational Research and Innovation presents at the Ask an Expert Webinar: How can education support child empowerment?
Read| The latest issue of The Challenger is here! We are thrilled to announce that our school paper has qualified for the NATIONAL SCHOOLS PRESS CONFERENCE (NSPC) 2024. Thank you for your unwavering support and trust. Dive into the stories that made us stand out!
Palestine last event orientationfvgnh .pptxRaedMohamed3
An EFL lesson about the current events in Palestine. It is intended to be for intermediate students who wish to increase their listening skills through a short lesson in power point.
Instructions for Submissions thorugh G- Classroom.pptxJheel Barad
This presentation provides a briefing on how to upload submissions and documents in Google Classroom. It was prepared as part of an orientation for new Sainik School in-service teacher trainees. As a training officer, my goal is to ensure that you are comfortable and proficient with this essential tool for managing assignments and fostering student engagement.
A Strategic Approach: GenAI in EducationPeter Windle
Artificial Intelligence (AI) technologies such as Generative AI, Image Generators and Large Language Models have had a dramatic impact on teaching, learning and assessment over the past 18 months. The most immediate threat AI posed was to Academic Integrity with Higher Education Institutes (HEIs) focusing their efforts on combating the use of GenAI in assessment. Guidelines were developed for staff and students, policies put in place too. Innovative educators have forged paths in the use of Generative AI for teaching, learning and assessments leading to pockets of transformation springing up across HEIs, often with little or no top-down guidance, support or direction.
This Gasta posits a strategic approach to integrating AI into HEIs to prepare staff, students and the curriculum for an evolving world and workplace. We will highlight the advantages of working with these technologies beyond the realm of teaching, learning and assessment by considering prompt engineering skills, industry impact, curriculum changes, and the need for staff upskilling. In contrast, not engaging strategically with Generative AI poses risks, including falling behind peers, missed opportunities and failing to ensure our graduates remain employable. The rapid evolution of AI technologies necessitates a proactive and strategic approach if we are to remain relevant.
Welcome to TechSoup New Member Orientation and Q&A (May 2024).pdfTechSoup
In this webinar you will learn how your organization can access TechSoup's wide variety of product discount and donation programs. From hardware to software, we'll give you a tour of the tools available to help your nonprofit with productivity, collaboration, financial management, donor tracking, security, and more.
4. Meaning
Purpose
Forms of presenting comparative statement
Comparative Balance Sheet
Advantage of comparative balance sheet
Format of comparative balance sheet
Illustration
Exercise
Comparative statements of profit & loss
Objective of comparative statement of profit & loss
Format of comparative statement of profit & loss
Illustration
Exercise
5. When financial statements figures for two or
more years are placed side-by-side to facilitate
comparison, these are called “comparative
Financial Statements”.
Such statements provide for columns to
indicate the increase or decrease in these
figures from one year to another in absolute
figures and in percentage form.
6. To make the data simpler and more
understandable.
To indicate the trend of firm.
To indicate the strong points & weak points of
the firm.
To compare the firm’s performance with
average performance of the industry.
To help in forecasting.
7. To show the absolute data in rupees amounts
only. For e.g. revenue from operations in 2015
₹4,00,000 and in 2016 ₹5,00,000.
To show the increase and decrease in absolute
data in terms of money values. For e.g. in
comparison to 2015 revenue from operations in
2016 increased by 1,00,000.
To show the increase and decrease in absolute
data in terms of percentages. For e.g. in
comparison to 2015 revenue from operation in
2016 increased by 25%.
8. Comparison expressed by ratios. For e.g. if the
trade receivables in 2016 ₹1,00,000 and in 2017
₹2,00,00; then ratio will be
2,00,000
1,00,000
= 2:1.
Use of cumulative figures and averages. For
e.g. land & building in 2013, 2014, 2015, 2016
and 2017 were ₹1,00,000; ₹1,50,000; ₹2,00,000;
₹1,10,000; ₹2,40,000 respectively. For e.g.
average land & buildings
8,00,000
5
= 1,60,000.
10. A single year’s balance sheet shows only the
balances of accounts on a particular date,
whereas the comparative balance sheet shows
not only the balances of accounts as on
different dates but also extent of increase or
decrease in various items of balance sheet.
The balance sheet focuses on status, but the
comparative focus on changes.
11. It consists of five column. Such as in
1st column = items of balance sheet
2nd column = data of previous year
3rd column = data of current year
4th column = increase or decrease in absolute
data in terms of rupees
5th column = percentage of increase or decrease in
absolute data.
It is in the vertical form as per schedule III.
12. Particulars
Note
no.
Previous
Year
₹
Current
Year
₹
Absolute
Change
(In. /De.)
₹
% change
(In./de.)
%
A B C = B – A D
I. Equity & Liabilities :
(1) Shareholder’s Funds -
a. Share capital
b. Reserves & surplus
(2) Non current liabilities -
a. long term borrowings
b. long term provisions
(3) Current liabilities -
a. Short term borrowings
b. Trade payables
c. Other current liabilities
d. Short term provisions
Total
13. A
₹
B
₹
C = B - A
₹
D
%
II. Assets
(1) Non current assets -
a. Fixed assets
(i). Tangible assets
(ii). Intangible assets
b. Non-current Investments
c. Long-term loans & advances
(2) Current assets -
a. Current investments
b. Inventories
c. Trade receivables
d. Cash & Cash equivalents
e. Short-term loans & advances
f. Other Current assets
Total
14. 1. Y Ltd. Was in the business of manufacturing plastic bags. The company decided to
manufacture low cost jute bags instead of plastic bags. Following are the balance
sheets of Y Ltd. As at 31st march, 2015 & 2016. Prepare a comparative balance sheet.
Particulars Note
No.
31-3-16
₹
31-3-15
₹
I. Equity & Liabilities :
(1) Shareholder’s Funds-
a. Share Capital 10,00,000 8,00,000
b. Reserves & surplus 4,00,000 3,00,000
(2) Non-current liabilities-
a. long-term borrowings 2,00,000 3,00,000
(3) Current liabilities 4,00,000 5,00,000
Total 20,00,000 19,00,000
II. Assets :
(1) Non-current assets -
a. Fixed assets 15,00,000 12,00,000
(2) Current assets 5,00,000 7,00,000
Total 20,00,000 19,00,000
15. Particulars Not
e
no.
31-3-15
(₹)
31-3-16
(₹)
Absolute
changes
(₹)
% Change
(%)
A B C = B-A D=
CA×100
I. Equity & Liabilities :
(1) Shareholder’s Funds
a. Share Capital 8,00,000 10,00,000 2,00,000 25%
b. Reserves & surplus 3,00,000 4,00,000 1,00,000 33.33%
(2) Non-current liabilities -
a. Long-term borrowings 3,00,000 2,00,000 (1,00,000) (33.33%)
(3) Current liabilities 5,00,000 4,00,000 (1,00,000) (20%)
Total 19,00,000 20,00,000 1,00,000 5.2%
II. Assets
(1) Non-current assets -
a. Fixed assets 12,00,000 15,00,000 3,00,000 25%
(2) Current assets 7,00,000 5,00,000 (2,00,000) (28.7%)
Total 19,00,000 20,00,000 1,00,000 5.2%
16. Bracket denotes negative sign.
D = C A × 100.
So,
2,00,000
8,00,000
× 100 = 25%.
17. Particulars 31-3-17 31-3-16
₹ ₹
Reserves & Surplus 12,00,000 6,00,000
Share Capital 10,00,000 10,00,000
Trade payables 12,70,000 9,00,000
Land & buildings 16,00,000 15,00,000
Plant & machinery 6,30,000 5,00,000
Goodwill NIL 5,00,000
Investments 1,20,000 1,00,000
Current Assets 15,20,000 8,00,000
Long term borrowings 4,00,000 5,00,000
Note :- if in any question the proper balance sheet is not given so first prepare the
balance sheet then solve the question.
18. Particulars No
te
no.
31-3-17
₹
31-3-2016
₹
I. Equity & liabilities :
(1) Shareholder’s Funds -
a. Share Capital 10,00,000 10,00,000
b. Reserves & surplus 12,00,000 6,00,000
(2) Non current liabilities -
a. Long-term borrowings 4,00,000 5,00,000
(3) Current liabilities -
a. Trade payables 12,70,000 9,00,000
Total 38,70,000 30,00,000
II. Assets
(1) Non current assets
a. Fixed assets
i). Tangible assets 22,30,000 20,00,000
20. Particulars Not
e no.
31-3-16
₹
31-3-17
₹
Absolute
change
₹
%
Change
%
A B C =B-A D=
CA×100
I. Equity & Liabilities :
(1) Shareholder’s Funds
a. Share capital 10,00,000 10,00,000 NIL NIL
b. Reserves & Surplus 6,00,000 12,00,000 6,00,000 100%
(2) Non current liabilities
a. Long term borrowings 5,00,000 4,00,000 (1,00,000) (20%)
(3) Current liabilities
a. Trade payables 9,00,000 12,70,000 3,70,000 41.11%
Total 30,00,000 38,70,000 8,70,000 29%
II. Assets :
(1) Non current assets
a. Fixed assets
22. Particulars
Note
no.
31-3-2014
₹
31-3-13
₹
I. Equity & Liabilities :
(1) Shareholder’s Funds -
a. Share capital 8,00,000 4,00,000
b. Reserves & Surplus 1,00,000 1,00,000
(2) Non current liabilities -
a. Long term borrowings 5,00,000 4,00,000
(3) Current liabilities -
a. Short term borrowings 1,00,000 1,00,000
Total 15,00,000 10,00,000
II. Assets
(1) Non current assets 7,00,000 5,00,000
(2) Current assets
a. Inventories 4,00,000 3,00,000
1. From the following balance sheet of Royal Industries as at 31st march 2013 & 2014,
prepare a comparative balance sheet :-
23. b. Trade receivables 2,00,000 1,00,000
c. Cash & cash equivalents 2,00,000 1,00,000
Total 15,00,000 10,00,000
24. Particulars
31-3-15
₹(in lakh)
31-3-14
₹(in lakh)
Share capital 25 25
Reserves & surplus 10 8
Goodwill 3 2
Land & Buildings 20 15
Plant & machinery 10 15
Long term borrowings 3 2
Investments 2 1
Trade payables 1 1
Short term provisions 1 2
Current assets 5 5
25. A comparative statement
of profit & loss shows
the net profits or loss
for number of years so
that changes in absolute
in terms of money as
well as in terms of
percentage may be
known.
26. Rate of increase or decrease in revenue from
operations (sales).
Rate of increase or decrease in cost of materials
consumed.
Rate of increase or decrease in incomes and
expenses.
Rate of increase or decrease in net profit.
27. To facilitate comparison of various items of
income & expenditure for two or more years.
To analyse the increase or decrease in the
income & expenditure in terms of rupee and
also in percentage from one year to another.
To analyse the increase or decrease in the
profits of the enterprise.
To help in forecasting the profitability of the
business concern.
28. It consists of five column :-
1st column = particulars
2nd column = previous year data
3rd column = current year data
4th column = increase or decrease in absolute data
5th column increase or decrease in various items in
the form of percentage.
It is in the vertical form as per schedule III.
29. Particulars
Note
no.
Pervious
year
(₹)
Current
year
(₹)
Absolute
change
(₹)
%
change
(%)
A B C D
I. Revenue from operation
II. Add : Other income
III. Total revenue (I + II)
IV. Less : Expenses –
cost of materials consumed
purchase of stock-in-trade
change in inventories of F.G.,
WIP, stock-in-trade
employee benefit expenses
finance costs
depreciation and amortization
exp.
other expenses
Total expenses
30. V. Profit before tax (III – IV)
VI. Less : Tax
VII. Profit after tax (V - VI)
31. Particulars
31-3-15
₹
31-3-16
₹
I. Revenue from operation 10,00,000 12,00,000
II. Add : Other income 3,00,000 5,00,000
III. Total Revenue (I + II) 13,00,000 17,00,000
IV. Less : Expenses
Cost of material consumed 5,00,000 6,00,000
Depreciation & amortization expenses 10,000 20,000
V. Profit before tax (III - IV) 7,90,000 10,80,000
1. From the following information, prepare the comparative statement of profit & loss
:-
Note :- tax on profit is 50%.
32. Particulars
Note
no.
31-3-15
(₹)
31-3-16
(₹)
Absolute
change
(₹)
% change
(%)
A B C D
I. Revenue from operation 10,00,000 12,00,000 2,00,000 20%
II. Add : Other income 3,00,000 5,00,000 2,00,000 66.67%
III. Total revenue (I + II) 13,00,000 17,00,000 4,00,000 30.67%
IV. Less : Expenses
cost of material consumed 5,00,000 6,00,000 1,00,000 20%
depreciation & amortization
expenses
10,000 20,000 10,000 100%
V. Profit before tax (III - IV) 7,90,000 10,80,000 2,90,000 36.70%
VI. Tax (50%) 3,95,000 5,40,000 1,45,000 36.70%
VII. Profit after tax (V - VI) 3,95,000 5,40,000 1,45,000 36.70%
33. Particulars
Note
no.
31-12-16
₹
31-12-17
₹
I. Revenue from operations 20,00,000 22,00,000
II. Less : Expenses :
cost of materials consumed 7,00,000 6,00,000
finance cost 10,000 20,000
Total expenses 7,10,000 6,20,000
III. Profit before tax (I - II) 12,90,000 15,80,000
IV. Tax (45%) 5,80,500 7,11,000
VI. Profit before tax 7,09,500 8,69,000
1. Prepare a comparative statement of profit & loss from the following
information :-