Download to read offline

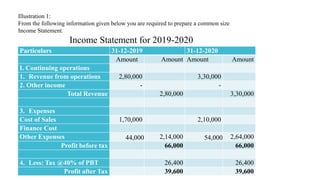
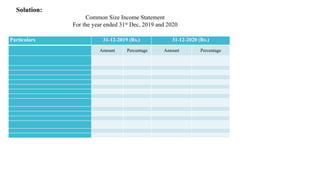
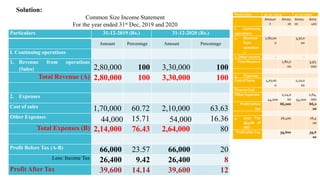
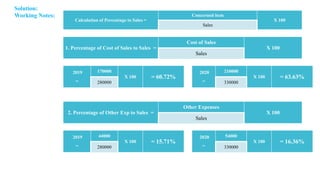
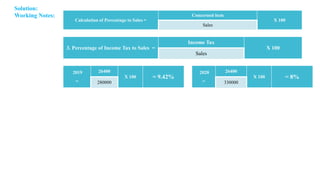
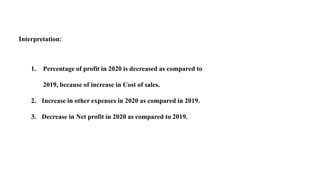
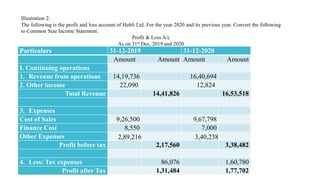
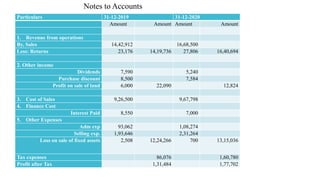


The document discusses management accounting principles, focusing on financial statement analysis, including common size statements. It explains how common size income statements and balance sheets convert financial figures into percentages, allowing for comparative analysis across periods. Practical problems and illustrations are provided to demonstrate the preparation and interpretation of these financial statements.


