Poster presented at the May 2015 Conference for Advancing Evidence-Based Teaching, Center for Advancing Learning and Teaching Through Research, Northeastern University, Boston, MA
Course revision is a reality of daily life in higher education. Each semester, faculty review their courses to ensure that they are presenting current concepts and providing proper methods of assessment and interaction for their students. Unfortunately, most review and revision is done during periods of frantic activity just before or during the beginning of the semester. This methodology does not allow for deep consideration of issues and can negatively affect learning for students.
Focused revision is a methodology of review that tasks faculty to review a course over a longer period of time and focus on one pedagogical aspect, such as interaction, content presentation, rubric development, etc. Focusing on a specific aspect of a course, to the exclusion of others, increases the efficacy of that aspect of the course while maintaining the current level of quality on the other aspects. This methodology also changes course revision from a summative process to a formative process and allows for the effective inclusion of student feedback into course design. The process also allows faculty to create efficiencies in their process to maximize time and minimize work. Multiple focused revisions may build on each other to create a synergy between course components, thus creating a more effective learning environment in both the physical and the digital classrooms, leading to increased student engagement and learning.
SDEC2011 Replacing legacy Telco DB/DW to Hadoop and HiveKorea Sdec
Currently telecom companies store their data in database or data warehouse, treating them through ETL process and working on statistics and analysis by using OLAP tools or data mining engines. However, due to the data explosion along with the spread of Smart Phones traditional data storages like DB and DW aren’t sufficient to cope with these “Big Data”. As an alternative the method of storing data in Hadoop and performing ETL process and Ad-hoc Query with Hive is being introduced, and China Mobile is being mentioned as the most representative example. But, they are adopted mainly by new projects, which have low barriers in applying the new Hive data model and HQL. On the other hand, it is extremely difficult to replace the existing database with the combination of Hadoop and Hive if there are already a number of tables and SQL queries. NexR is migrating the telecom company’s data from Oracle DB to Hadoop, and converting a lot of existing Oracle SQL queries to Hive HQL queries. Though HQL supports a similar syntax to ANSI-SQL, it lacks a large portion of basic functions and hardly supports Oracle analytic functions like rank() which are utilized mainly in statistical analysis. Furthermore, the difference of data types like null value is also blocking the application of it. In this presentation, we will share the experience converting Oracle SQL to Hive HQL and developing additional functions with MapReduce. Also, we will introduce several ideas and trials to improve Hive performance.
http://sdec.kr/
Technology & Innovation Management models and business diagrams for professional presentations.
More business diagrams to download on
http://www.drawpack.com
your visual business knowledge
Highlights From Future of Education - mSchool + DreamBox LearningDreamBox Learning
In the edWeb.net Blended Learning community’s latest webinar, Elliot Sanchez joined Dr. Tim Hudson, Senior Director of Curriculum Design for DreamBox Learning, Inc., and discussed the future of math education. Elliot, Founder & CEO of mSchool, and one of the 2014 Forbes 30 Under 30, is a leading education innovator with 14 state-funded classrooms that successfully leverage blended learning. Elliot and Tim discussed mSchool’s approach and successes, blended learning, formative assessment, meeting the diverse needs of all students, Common Core State Standards, and digital learning technologies. They provided a recap of insights from the January 22, 2014 The Future of Math Education: A Panel Discussion of Promising Practices webinar, with a focus on blended learning. That panel included NCSM President Valerie Mills, renowned math educator; author Dr. Cathy Fosnot, and past NCTM and AMTE President Dr. Francis (Skip) Fennell. Everyone interested in the success of all students in learning mathematics—educators, parents, and community members— can appreciate the valuable insights and approach to innovation from these education thought leaders.
AN E XAMINATION OF T HE E FFECTIVENESS OF T EACHING D ATA M ODELLING C ONCEPTSijdms
The effective teaching of data modelling concepts i
s very important; it constitutes the fundament of d
ata-
base planning methods and the handling of databases
with the help of database management languages,
typically SQL. We examined three courses. The stude
nts of two courses prepared for the exam by solving
tests, while the students of the third course prepa
red by solving tasks from a printed exercise book.
The
number of task for the second course was 2.5 times
more than the number of task for the first course.
The
main purpose of our examination was to determine th
e effectiveness of the teaching of data modelling c
on-
cepts, and to decide if there is a significant diff
erence between the results of the three courses. Ac
cording to
our examination, with increasing the number of test
tasks and with the use of exercise book, the resul
ts
became significantly better
Presentation given for a panel presentation at the AAC&U 2019 meeting. Abstract: In this panel presentation, three institutions explored how ePortfolio curriculum prompts new ways of thinking about education. In Northeastern University’s online master’s education program, students draw from and transform their earlier “learning ePortfolios” into professional ePortfolios showing accomplishment and career readiness. Key to this transition are four critical moves: remembering, analyzing, envisioning, and synthesizing. In Florida State University’s Rhetoric and Composition ePortfolio, a signature practice is selection, supported by an ePortfolio curatorial process helping students make decisions about what’s to select for the ePortfolio and what to leave behind. Across all three programs, students report that these supportive practices are fundamental.
What can we learn about ePortfolio programs by listening to graduates?Gail Matthews-DeNatale
AAC&U 2017 Presentation Abstract: The ePortfolio community has long been dedicated to documenting, analyzing, and communicating the value of ePortfolios in higher education. But what happens to our students after they graduate? How do alumni perceive the value of their ePortfolio experience? Do they incorporate evidence-based, multimodal, and metacognitive practices into their daily life and work, and if so in what ways? What other insights might they share? This session will present the prominent themes that emerged during interviews and email exchanges with graduates from Northeastern University and Florida State University. The session will also include time for attendees to explore how they might incorporate alumni outreach into their own ePortfolio work and research.
November 2011 presentation given at a day-long assessment workshop co-sponsored by NERCOMP and ELI, titled Innovations in Learning: Measuring the Impact
Presentation on the use of digital storytelling as a strategy for crating digital cases. Given to the Harvard Business School Brain Gain Speaker series in August 2007.
Welcome to TechSoup New Member Orientation and Q&A (May 2024).pdfTechSoup
In this webinar you will learn how your organization can access TechSoup's wide variety of product discount and donation programs. From hardware to software, we'll give you a tour of the tools available to help your nonprofit with productivity, collaboration, financial management, donor tracking, security, and more.
Safalta Digital marketing institute in Noida, provide complete applications that encompass a huge range of virtual advertising and marketing additives, which includes search engine optimization, virtual communication advertising, pay-per-click on marketing, content material advertising, internet analytics, and greater. These university courses are designed for students who possess a comprehensive understanding of virtual marketing strategies and attributes.Safalta Digital Marketing Institute in Noida is a first choice for young individuals or students who are looking to start their careers in the field of digital advertising. The institute gives specialized courses designed and certification.
for beginners, providing thorough training in areas such as SEO, digital communication marketing, and PPC training in Noida. After finishing the program, students receive the certifications recognised by top different universitie, setting a strong foundation for a successful career in digital marketing.
Operation “Blue Star” is the only event in the history of Independent India where the state went into war with its own people. Even after about 40 years it is not clear if it was culmination of states anger over people of the region, a political game of power or start of dictatorial chapter in the democratic setup.
The people of Punjab felt alienated from main stream due to denial of their just demands during a long democratic struggle since independence. As it happen all over the word, it led to militant struggle with great loss of lives of military, police and civilian personnel. Killing of Indira Gandhi and massacre of innocent Sikhs in Delhi and other India cities was also associated with this movement.
2024.06.01 Introducing a competency framework for languag learning materials ...Sandy Millin
http://sandymillin.wordpress.com/iateflwebinar2024
Published classroom materials form the basis of syllabuses, drive teacher professional development, and have a potentially huge influence on learners, teachers and education systems. All teachers also create their own materials, whether a few sentences on a blackboard, a highly-structured fully-realised online course, or anything in between. Despite this, the knowledge and skills needed to create effective language learning materials are rarely part of teacher training, and are mostly learnt by trial and error.
Knowledge and skills frameworks, generally called competency frameworks, for ELT teachers, trainers and managers have existed for a few years now. However, until I created one for my MA dissertation, there wasn’t one drawing together what we need to know and do to be able to effectively produce language learning materials.
This webinar will introduce you to my framework, highlighting the key competencies I identified from my research. It will also show how anybody involved in language teaching (any language, not just English!), teacher training, managing schools or developing language learning materials can benefit from using the framework.
Biological screening of herbal drugs: Introduction and Need for
Phyto-Pharmacological Screening, New Strategies for evaluating
Natural Products, In vitro evaluation techniques for Antioxidants, Antimicrobial and Anticancer drugs. In vivo evaluation techniques
for Anti-inflammatory, Antiulcer, Anticancer, Wound healing, Antidiabetic, Hepatoprotective, Cardio protective, Diuretics and
Antifertility, Toxicity studies as per OECD guidelines
Synthetic Fiber Construction in lab .pptxPavel ( NSTU)
Synthetic fiber production is a fascinating and complex field that blends chemistry, engineering, and environmental science. By understanding these aspects, students can gain a comprehensive view of synthetic fiber production, its impact on society and the environment, and the potential for future innovations. Synthetic fibers play a crucial role in modern society, impacting various aspects of daily life, industry, and the environment. ynthetic fibers are integral to modern life, offering a range of benefits from cost-effectiveness and versatility to innovative applications and performance characteristics. While they pose environmental challenges, ongoing research and development aim to create more sustainable and eco-friendly alternatives. Understanding the importance of synthetic fibers helps in appreciating their role in the economy, industry, and daily life, while also emphasizing the need for sustainable practices and innovation.
Making Student Learning Visible: Using Concept Map Analysis as an Assessment Tool
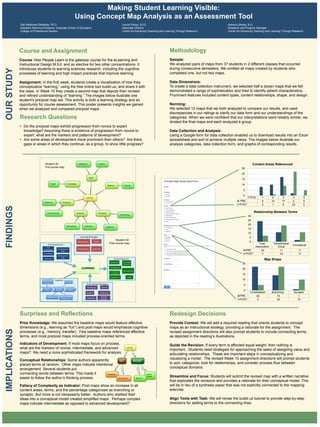
1. Course and Assignment
Course: How People Learn is the gateway course for the eLearning and
Instructional Design M.Ed. and an elective for two other concentrations. It
introduces students to learning sciences research, including the cognitive
processes of learning and high impact practices that improve learning.
Assignment: In the first week, students create a visualization of how they
conceptualize “learning,” using the free online tool bubbl.us, and share it with
the class. In Week 10 they create a second map that depicts their revised
and refined understanding of “learning.” The images below illustrate one
student’s pre/post map set. This activity is both a learning strategy and an
opportunity for course assessment. This poster presents insights we gained
when we analyzed and compared pre/post maps.
Methodology
Sample:
We analyzed pairs of maps from 37 students in 2 different classes that occurred
during consecutive semesters. We omitted all maps created by students who
completed one, but not two maps.
Data Dimensions:
To create a data collection instrument, we selected half a dozen maps that we felt
demonstrated a range of sophistication and tried to identify salient characteristics.
Prominent features included content types, content relationships, shape, and design.
Norming:
We selected 12 maps that we both analyzed to compare our results, and used
discrepancies in our ratings to clarify our data form and our understandings of the
categories. When we were confident that our interpretations were reliably similar, we
divided the final maps and each analyzed a group.
Data Collection and Analysis:
Using a Google form for data collection enabled us to download results into an Excel
spreadsheet and sort to achieve multiple views. The images below illustrate our
analysis categories, data collection form, and graphs of corresponding results.
Making Student Learning Visible:
Using Concept Map Analysis as an Assessment Tool
Gail Matthews-DeNatale, Ph.D.
Assistant Teaching Professor, Graduate School of Education
College of Professional Studies
Laurie Poklop, Ed.D.
Associate Director
Center for Advancing Teaching and Learning Through Research
Kaleena Seeley, B.A.
Research and Program Manager
Center for Advancing Teaching and Learning Through Research
Research Questions
• Do the pre/post maps exhibit progression from novice to expert
knowledge? Assuming there is evidence of progression from novice to
expert, what are the markers and patterns of development?
• Are some areas of development more prominent than others? Are there
gaps or areas in which they continue, as a group, to show little progress?
FINDINGS
Surprises and Reflections
Prior Knowledge: We assumed the baseline maps would feature affective
dimensions (e.g., learning as “fun”) and post maps would emphasize cognitive
processes (e.g., memory, transfer). Few baseline maps referenced affective
terms, and most pre/post maps included process-oriented terms.
Indicators of Development: If most maps focus on process,
what are the markers of novice, intermediate, and advanced
maps? We need a more sophisticated framework for analysis.
Redesign Decisions
Provide Context: We will add a required reading that orients students to concept
maps as an instructional strategy, providing a rationale for the assignment. The
revised assignment directions will also prompt students to include connecting terms,
as depicted in the reading’s illustrations.
Guide the Revision: If every term is afforded equal weight, then nothing is
important. Students need strategies for approaching the tasks of assigning value and
articulating relationships. These are important steps in conceptualizing and
visualizing a model. The revised Week 10 assignment directions will prompt students
to sort, categorize, look for relationships, and consider process flow between
conceptual domains.
Streamline and Focus: Students will submit the revised map with a written narrative
that explicates the revisions and provides a rationale for their conceptual model. This
will be in lieu of a synthesis paper that was not explicitly connected to the mapping
exercise.
Align Tools with Task: We will revise the bubbl.us tutorial to provide step-by-step
directions for adding terms to the connecting lines.
TOTAL 1 2 3 4 5
PRE 8 10 17 2 0
POST 0 1 9 22 5
0
5
10
15
20
25
Content Areas Referenced
Student 30:
Post-course map
OURSTUDYIMPLICATIONS
Free
Association
Tiered/Hierar
chical
Conceptual
PRE 24 11 2
POST 7 19 11
0
5
10
15
20
25
30
Relationship Between Terms
Constellation Branching Synaptic
PRE 22 14 1
POST 5 22 10
0
5
10
15
20
25
Map Shape
Fallacy of Complexity as Indicator: Post maps show an increase in all
content areas, terms, and the percentage categorized as branching or
synaptic. But more is not necessarily better. Authors who distilled their
ideas into a conceptual model created simplified maps. Perhaps complex
maps indicate intermediate as opposed to advanced development?
Conceptual Relationships: Some authors apparently
placed terms at random. Other maps indicate intentional
arrangement. Several students put
connecting words between terms. This made it
easier to follow the author’s thinking process.
Student 30:
Pre-course map