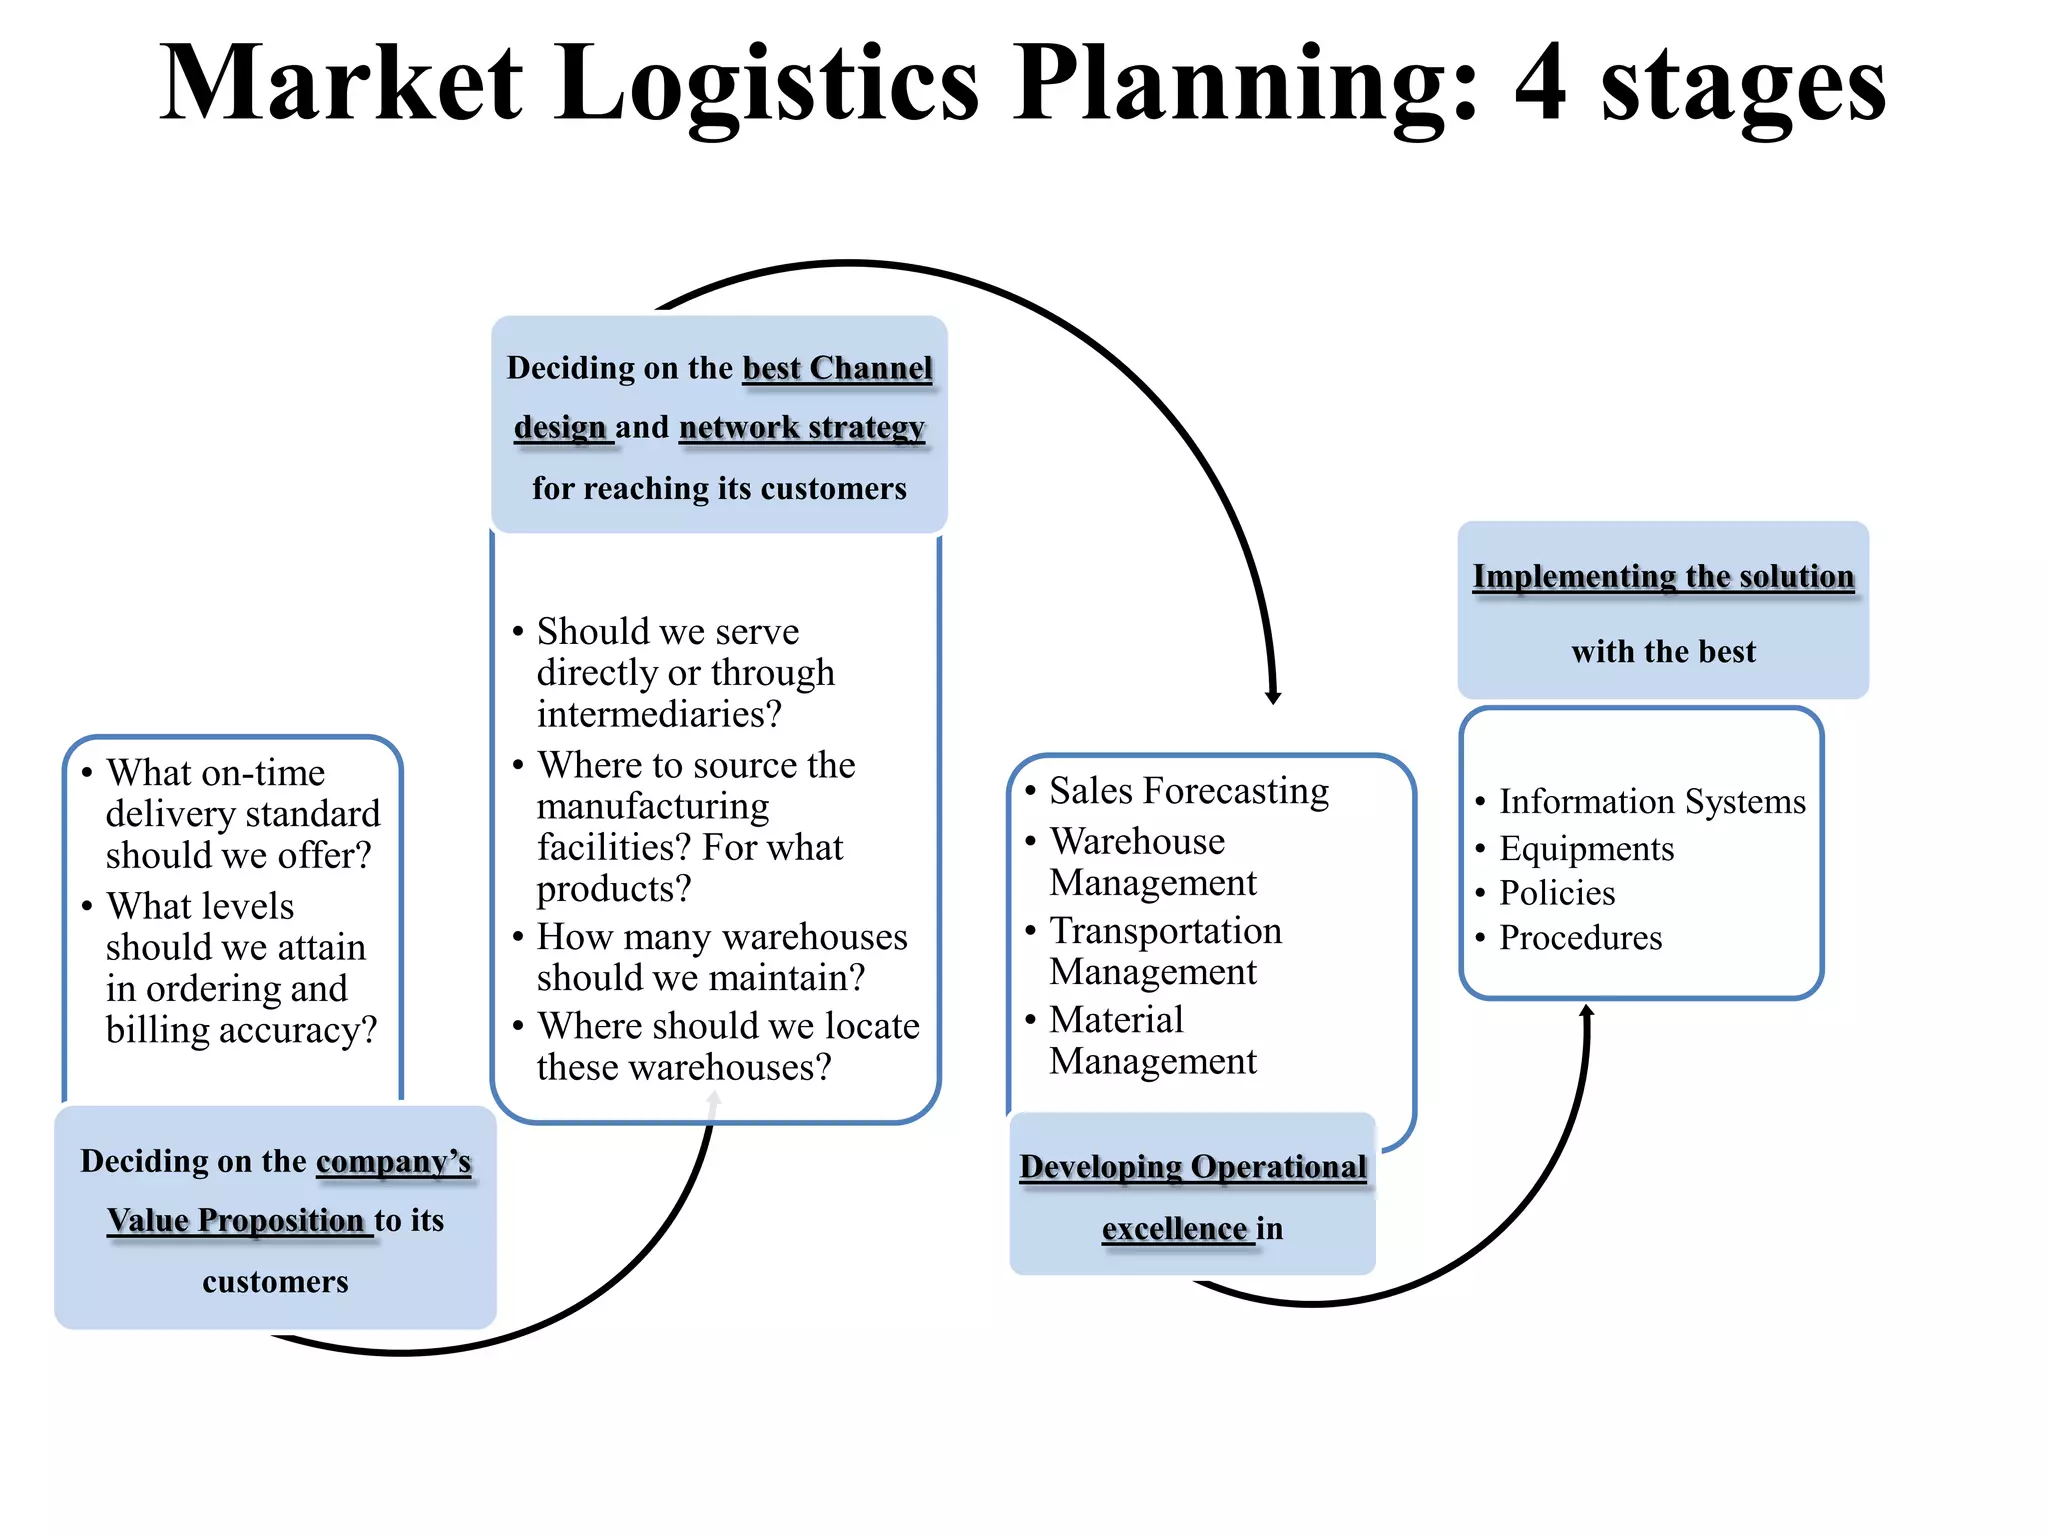
Session:
Supply Chain and
    Logistics


      IIM Rohtak
Market Logistics
• Physical Distribution starts from the factory.
• Managers chooses a set of (a) Warehouses (stocking
  points); and (b) transportation carriers that will
  deliver the goods to final destination in the desired
  time and at the lowest total cost.
• Physical Distribution has now expanded into a broader
  concept of Supply Chain Management (SCM).
• SCM starts from:
  – strategically procuring the right inputs (raw materials and
    capital equipments);
  – converting them efficiently into finished products; and
  – dispatching them to the final destination.
Market Logistics Planning: 4 stages

                            Deciding on the best Channel
                            design and network strategy
                             for reaching its customers

                                                                                    Implementing the solution
                            • Should we serve                                               with the best
                              directly or through
                              intermediaries?
• What on-time              • Where to source the
                              manufacturing                • Sales Forecasting      •   Information Systems
  delivery standard
  should we offer?            facilities? For what         • Warehouse              •   Equipments
                              products?                      Management             •   Policies
• What levels
  should we attain          • How many warehouses          • Transportation         •   Procedures
  in ordering and             should we maintain?            Management
  billing accuracy?         • Where should we locate       • Material
                              these warehouses?              Management

Deciding on the company’s                                  Developing Operational
 Value Proposition to its                                       excellence in
       customers
Supply Chain for an Individual Firm


Transportation                             Transportation            Customers
                   Warehousing


                                           Information
                                           flows
   Factory


Transportation


                                                            Vendors/plants/ports
 Warehousing              Transportation

                                                                                   1-2
Logistics Defined
Logistics is the process of planning, implementing and
controlling the efficient, cost-effective flow and storage
of raw materials, in-process inventory, finished goods
and related information from the point of origin to point
of consumption for the purpose of conforming to
customer requirements.
                         Council of Logistics Management

Supply Chain Management Defined
SCM is the integration of all activities associated with the
flow and transformation of goods from raw materials
through to end user, as well as information flows, through
improved supply chain relationships, to achieve a
sustainable competitive advantage.
                                       Handfield and Nichols
                                                         1-5
The Logistics/Supply Chain Mission

Getting the right goods or services to
the right place, at the right time, and in
the desired condition at the lowest cost
and highest return on investment.

                                       1-6
Evolution of Supply Chain Management
 Activity fragmentation to 1960   Activity Integration 1960 to 2000               2000+

Demand forecasting

Purchasing

Requirements planning
                                        Purchasing/
Production planning                      Materials
                                        Management
Manufacturing inventory

Warehousing
                                                                      Logistics
Material handling

Packaging

Finished goods inventory                                                           Supply Chain
                                           Physical                                 Supply Chain
                                                                                   Management
                                          Distribution                              Management
Distribution planning

Order processing

Transportation

Customer service

Strategic planning

Information services

Marketing/sales

Finance
                                                                                          1-7
Significance of Logistics
Costs are high
   About 10.5% of GDP domestically
   About 12% of GDP internationally
   A range of 4 to 30% of sales for individual firms, avg. about 10%
   A high as 70-80% of sales if purchasing and production are
   included
Customers are more demanding of the supply chain
   Desire for quick response
   Desire for mass customization
An integral part of company strategy
    Generate revenue
    Improve profit
Logistical lines are lengthening
   Local vs. long distance supply
Logistics is a key to trade and an increased standard of living
   Law of comparative economic advantage applies
Logistics adds value
   Time and place utilities                                       1-8
Effect on Logistics Outsourcing
Internal handling      Outsourcing
       Profit              Profit     Increase

     Marketing
                         Marketing

     Logistics                        Increase
                         Logistics

    Overhead              Tariffs
                         Overhead
     Materials
                         Materials

      Labor                          Reduction
                          Labor
                                         1-9
Scope of the Supply Chain for Most Firms
                                   Business logistics


                 Physical supply                        Physical distribution
             (Materials management)

Sources of                                   Plants/
                                                                                   Customers
  supply                                   operations

               •Transportation                          •Transportation
               •Inventory maintenance                   •Inventory maintenance
               •Order processing                        •Order processing
               •Acquisition/ Procurement                •Product scheduling
               •Protective packaging                    •Protective packaging
               •Warehousing                             •Warehousing
               •Materials handling                      •Materials handling
               •Information maintenance                 •Information maintenance


                        Focus firm’s internal supply chain
                                                                                          1-14
Key Activities/Processes
Primary
- Setting customer service goals
- Transportation
- Inventory management
- Location

Secondary, or supporting
- Warehousing
- Materials handling
- Acquisition (purchasing)
- Protective packaging
- Product scheduling
- Order processing
                                   1-11
The Logistics Strategy Triangle
Inventory Strategy
  Forecasting
  Storage fundamentals                         Transport Strategy
  Inventory decisions                            Transport fundamentals
  Purchasing and supply                          Transport decisions
    scheduling decisions
                         Customer
  Storage decisions
                         service goals
                           The product
                           Logistics service
                           Information sys.


                                  Location Strategy
                                    Location decisions
                                   The network planning process


                                                                     1-12
Strategic, Tactical, and Operational Decision Making
Decision area    Strategic                    Tactical              Operational

Transportation   Mode selection               Seasonal equip-       Dispatching
                                              ment leasing

Inventories      Location, Control policies   Safety stock levels   Order filling

Order            Order entry, transmittal,                          Processing
processing       and processing system                              orders, Filling
                 design                                             back orders

Purchasing       Development of supplier-     Contracting,          Expediting
                 buyer relations              Forward buying

Warehousing      Handling equipment           Space utilization     Order picking
                 selection, Layout design                           and restocking

Facility         Number, size, and
location         location of warehouses
                                                                                      2-7
Integrated Logistics Systems (ILS)
• ILS is used by many firms, with the help of
  Information Technology for tracking and coordinating
  the following functions effectively:
   – Material management
   – Material flow systems
   – Physical distribution
• Volvo operates their warehouse in Memphis with the
  support of third party suppliers, FedEx Logistics
  Services, to handle stocks of truck parts. If a Volvo
  dealer needed a part in an emergency, phones a toll-free
  number and the part is flown out the same day and
  delivered that night at either the airport or the dealer’s
  office.
Market Logistics Objectives
 Situations where logistics planning may go wrong:
• The Traffic/ Logistics manager favours rail shipment over air shipment
  because of the less rail cost. However, because the rail transport are slower,
  it ties up working capital longer, delay customer payment, and might cause
  customers to buy from competitors who offer faster service.
• The Shipping department uses cheap containers to minimize shipping
  costs. Cheaper containers lead to a higher rate of damaged goods.
• The Inventory manager favours low inventory. This increases the
  possibility of ‘stockouts’, back orders, huge paperwork etc.

    Major objectives for any company logistics planning:
•   On-time delivery
•   Effectively meet emergency needs
•   Careful handling of merchandise
•   Willingness to take back defective goods and resupply them quickly.
Indian Logistic System: Scenario
  IndustryOverview
• Logistics functions are currently an in-house activity for
  companies that hire discrete services such as transportation and
  warehousing while internally performing order processing, distribution,
  and logistics planning for inbound and outbound logistics.
• Outsourcing of entire logistics to third-party logistics service
  providers is highly limited.
• The practice of complete logistics outsourcing is recent in
  India with multinational companies being the major users of
  this service.
Indian Logistic System: Scenario
• The logistics industry in India is highly fragmented.
  This is mainly due to the nature of the
  transportation industry.

• In India, over 50 percent of goods are transported
  by road. The road transport sector is highly
  fragmented with vehicle ownership firmly in the
  hands of individual trucks owners with 67 percent
  of the owners with a fleet of less than five vehicles.
Indian Logistic Scenario
• Inventory carrying costs account for approximately
  24 percent of the logistics cost.
• Order processing and administrative costs account
  for a significant 10 percent of the logistics costs.
• Stock filing and warehouse management in many cases is
  done manually increasing the administrative costs at the
  same time adding an element of inefficiency in warehouse
  management.
Indian Logistic Scenario
• Companies in India are slowly moving towards total
  outsourcing of logistics that provides access to
  logistics services to their production facility,
  warehouses, and IT systems.
• A high level of integration is required between the
  company and logistics service providers to provide
  logistics services that fulfill the strategic objective of
  the companies.
Indian Logistic Structure
• The total logistics market consists of market participants
  from the unorganized segment to highly technology savvy
  and process driven service providers with high levels of
  expertise in the area of logistics management.
• The market participants in this industry can be broadly
  classified into three broad segments, namely:
   – Pure transporters
   – Integrated transporters with warehousing facilities
   – Third-party logistics service providers (3PLs)
Pure & Integrated Transporters
• Transporters are involved only in the physical
  movement of goods. They can be classified as
  – small, medium and large based on the ownership
    pattern of vehicles and their revenue.
• Transporters are considered to be highly
  unorganized although many large transporters form
  a part of the organized segment of the market.
• Many large transporters are diversifying their
  operations to include total logistics management.
Third Party Logistics (3PLs)
  Third-party logistics service providers
• (3PLs) are involved in the complete value chain of
  logistics management including inbound logistics,
  supply chain management, tracking and data
  reporting, warehousing, (JIT) deliveries, and
  outbound logistics.
• 3PL companies currently present in India are multi-
  national companies with wide experience in
  handling international logistics.
Indian Supply Chain Scenario
                            Some Facts
• GDP                        : Rs. 27.55 Lakh Crores*
• Inventory tied up          : Rs. 1.17 Lakh Crores
• Logistics Cost             : 14% of our GDP
• 1% Reduction in LC         : Rs. 27550 Crores
• 2% Reduction in LC         : Rs. 55100 Crores


* Economic Survey 2003-04
Logistics Cost
  Country                                        GDP (USD b)* Logistics Cost as % of GDP


  Australia                                             393.0            10-11

  Asian Region

  China Mainland                                       1237.1            14.5

  India                                                 460.0            14.0

  Japan                                                3996.2            10.5

  Korea                                                 468.7            12.4

  Singapore                                              87.0            12.4
  Taiwan                                                281.5            13.5

* World Competitiveness Year Book 2003
Logistics Cost                   cont…
  Country                                        GDP (USD b)*       Logistics Cost as % of GDP


  European Region
  France                                                   1419.3             11.7
  Germany                                                  1987.0             11.8
  Italy                                                    1186.0             12.6
  Netherlands                                               418.8             12.2
  Spain                                                     654.0             12.1
  UK                                                       1555.2             12.2

  North American Region

  Canada                                                    729.3             11.8
  Mexico                                                    637.3             14.4
  USA                                                     10445.6             08.7
* World Competitiveness Year Book 2003
International Comparison of Customer Orientation
 Parameters         Product     Product Design      On-Time     After-Sales    Managing
                    Quality                         Delivery     Service      Distribution

 Brazil              52.39          56.62               36.34     39.15          51.83

 Canada              68.13          58.06               62.19     62.50          66.45

 France              55.94          66.96               44.64     45.56          66.09

 Germany             92.50          71.39               88.06     78.61          75.83

 India               41.08          34.05               30.27     41.08          52.43

 Japan               92.68          81.46               93.17     89.76          72.20

 Netherlands         72.89           63.11              69.78     68.44          74.76

 South Korea         60.71          48.57               59.29     47.14          57.14

 Thailand            63.00          58.50               57.00     54.00          66.50

 USA                 59.67          69.84               62.62     57.70          74.43


Note:     Companies are rated 0=poor to 100=excellent
Elements of Logistics cost
• Transportation                        35%

• Inventories                           25%

• Losses                                14%

• Packaging                             11%

• Handling and Warehousing              9%

• Customers' shopping                   6%
Ma r k e t O p p o r t u n i t i e s a n d
              Forecasts

Figure 1-1 and Chart 1.1 present the revenue

forecast of the Indian logistics industry over

the period 2002 to 2009.
Figure1-1

   Logistics Industry: Revenue Forecasts (India), 2002-2009
    Revenues                                 Year ($ Billion)
        2002                                                    12.66
        2003                                                    13.46
        2004                                                    14.31
        2005                                                    15.22
        2006                                                    16.19
        2007                                                    17.24
        2008                                                    18.35
        2009                                                    19.54
Compound Annual Growth Rate (2003-2009): 6.4%
Note: All figures are rounded; the base year is 2003. Source: Frost & Sullivan
Figure 1-2 and Chart 1.2 present the revenue

forecast of the third-party logistics solutions

market over the period 2002 to 2009.
End-userDemandAnalysis


Figure 1-3 and Chart 1.3 present the industry wise

revenue contribution to the total Indian logistics

industry.
Challenges Facing the Logistics Industry in India
What’s New in Supply Chain?
• Global competition
• Well informed more powerful Customers
• Customer Expectations
• Shorter product life cycle
• New, low-cost distribution channels
• Internet and E-Business strategies

Logistics and Supply Chain

  • 1.
    Session: Supply Chain and Logistics IIM Rohtak
  • 2.
    Market Logistics • PhysicalDistribution starts from the factory. • Managers chooses a set of (a) Warehouses (stocking points); and (b) transportation carriers that will deliver the goods to final destination in the desired time and at the lowest total cost. • Physical Distribution has now expanded into a broader concept of Supply Chain Management (SCM). • SCM starts from: – strategically procuring the right inputs (raw materials and capital equipments); – converting them efficiently into finished products; and – dispatching them to the final destination.
  • 3.
    Market Logistics Planning:4 stages Deciding on the best Channel design and network strategy for reaching its customers Implementing the solution • Should we serve with the best directly or through intermediaries? • What on-time • Where to source the manufacturing • Sales Forecasting • Information Systems delivery standard should we offer? facilities? For what • Warehouse • Equipments products? Management • Policies • What levels should we attain • How many warehouses • Transportation • Procedures in ordering and should we maintain? Management billing accuracy? • Where should we locate • Material these warehouses? Management Deciding on the company’s Developing Operational Value Proposition to its excellence in customers
  • 4.
    Supply Chain foran Individual Firm Transportation Transportation Customers Warehousing Information flows Factory Transportation Vendors/plants/ports Warehousing Transportation 1-2
  • 5.
    Logistics Defined Logistics isthe process of planning, implementing and controlling the efficient, cost-effective flow and storage of raw materials, in-process inventory, finished goods and related information from the point of origin to point of consumption for the purpose of conforming to customer requirements. Council of Logistics Management Supply Chain Management Defined SCM is the integration of all activities associated with the flow and transformation of goods from raw materials through to end user, as well as information flows, through improved supply chain relationships, to achieve a sustainable competitive advantage. Handfield and Nichols 1-5
  • 6.
    The Logistics/Supply ChainMission Getting the right goods or services to the right place, at the right time, and in the desired condition at the lowest cost and highest return on investment. 1-6
  • 7.
    Evolution of SupplyChain Management Activity fragmentation to 1960 Activity Integration 1960 to 2000 2000+ Demand forecasting Purchasing Requirements planning Purchasing/ Production planning Materials Management Manufacturing inventory Warehousing Logistics Material handling Packaging Finished goods inventory Supply Chain Physical Supply Chain Management Distribution Management Distribution planning Order processing Transportation Customer service Strategic planning Information services Marketing/sales Finance 1-7
  • 8.
    Significance of Logistics Costsare high About 10.5% of GDP domestically About 12% of GDP internationally A range of 4 to 30% of sales for individual firms, avg. about 10% A high as 70-80% of sales if purchasing and production are included Customers are more demanding of the supply chain Desire for quick response Desire for mass customization An integral part of company strategy Generate revenue Improve profit Logistical lines are lengthening Local vs. long distance supply Logistics is a key to trade and an increased standard of living Law of comparative economic advantage applies Logistics adds value Time and place utilities 1-8
  • 9.
    Effect on LogisticsOutsourcing Internal handling Outsourcing Profit Profit Increase Marketing Marketing Logistics Increase Logistics Overhead Tariffs Overhead Materials Materials Labor Reduction Labor 1-9
  • 10.
    Scope of theSupply Chain for Most Firms Business logistics Physical supply Physical distribution (Materials management) Sources of Plants/ Customers supply operations •Transportation •Transportation •Inventory maintenance •Inventory maintenance •Order processing •Order processing •Acquisition/ Procurement •Product scheduling •Protective packaging •Protective packaging •Warehousing •Warehousing •Materials handling •Materials handling •Information maintenance •Information maintenance Focus firm’s internal supply chain 1-14
  • 11.
    Key Activities/Processes Primary - Settingcustomer service goals - Transportation - Inventory management - Location Secondary, or supporting - Warehousing - Materials handling - Acquisition (purchasing) - Protective packaging - Product scheduling - Order processing 1-11
  • 12.
    The Logistics StrategyTriangle Inventory Strategy Forecasting Storage fundamentals Transport Strategy Inventory decisions Transport fundamentals Purchasing and supply Transport decisions scheduling decisions Customer Storage decisions service goals The product Logistics service Information sys. Location Strategy Location decisions The network planning process 1-12
  • 13.
    Strategic, Tactical, andOperational Decision Making Decision area Strategic Tactical Operational Transportation Mode selection Seasonal equip- Dispatching ment leasing Inventories Location, Control policies Safety stock levels Order filling Order Order entry, transmittal, Processing processing and processing system orders, Filling design back orders Purchasing Development of supplier- Contracting, Expediting buyer relations Forward buying Warehousing Handling equipment Space utilization Order picking selection, Layout design and restocking Facility Number, size, and location location of warehouses 2-7
  • 14.
    Integrated Logistics Systems(ILS) • ILS is used by many firms, with the help of Information Technology for tracking and coordinating the following functions effectively: – Material management – Material flow systems – Physical distribution • Volvo operates their warehouse in Memphis with the support of third party suppliers, FedEx Logistics Services, to handle stocks of truck parts. If a Volvo dealer needed a part in an emergency, phones a toll-free number and the part is flown out the same day and delivered that night at either the airport or the dealer’s office.
  • 15.
    Market Logistics Objectives Situations where logistics planning may go wrong: • The Traffic/ Logistics manager favours rail shipment over air shipment because of the less rail cost. However, because the rail transport are slower, it ties up working capital longer, delay customer payment, and might cause customers to buy from competitors who offer faster service. • The Shipping department uses cheap containers to minimize shipping costs. Cheaper containers lead to a higher rate of damaged goods. • The Inventory manager favours low inventory. This increases the possibility of ‘stockouts’, back orders, huge paperwork etc. Major objectives for any company logistics planning: • On-time delivery • Effectively meet emergency needs • Careful handling of merchandise • Willingness to take back defective goods and resupply them quickly.
  • 16.
    Indian Logistic System:Scenario IndustryOverview • Logistics functions are currently an in-house activity for companies that hire discrete services such as transportation and warehousing while internally performing order processing, distribution, and logistics planning for inbound and outbound logistics. • Outsourcing of entire logistics to third-party logistics service providers is highly limited. • The practice of complete logistics outsourcing is recent in India with multinational companies being the major users of this service.
  • 17.
    Indian Logistic System:Scenario • The logistics industry in India is highly fragmented. This is mainly due to the nature of the transportation industry. • In India, over 50 percent of goods are transported by road. The road transport sector is highly fragmented with vehicle ownership firmly in the hands of individual trucks owners with 67 percent of the owners with a fleet of less than five vehicles.
  • 18.
    Indian Logistic Scenario •Inventory carrying costs account for approximately 24 percent of the logistics cost. • Order processing and administrative costs account for a significant 10 percent of the logistics costs. • Stock filing and warehouse management in many cases is done manually increasing the administrative costs at the same time adding an element of inefficiency in warehouse management.
  • 19.
    Indian Logistic Scenario •Companies in India are slowly moving towards total outsourcing of logistics that provides access to logistics services to their production facility, warehouses, and IT systems. • A high level of integration is required between the company and logistics service providers to provide logistics services that fulfill the strategic objective of the companies.
  • 20.
    Indian Logistic Structure •The total logistics market consists of market participants from the unorganized segment to highly technology savvy and process driven service providers with high levels of expertise in the area of logistics management. • The market participants in this industry can be broadly classified into three broad segments, namely: – Pure transporters – Integrated transporters with warehousing facilities – Third-party logistics service providers (3PLs)
  • 21.
    Pure & IntegratedTransporters • Transporters are involved only in the physical movement of goods. They can be classified as – small, medium and large based on the ownership pattern of vehicles and their revenue. • Transporters are considered to be highly unorganized although many large transporters form a part of the organized segment of the market. • Many large transporters are diversifying their operations to include total logistics management.
  • 22.
    Third Party Logistics(3PLs) Third-party logistics service providers • (3PLs) are involved in the complete value chain of logistics management including inbound logistics, supply chain management, tracking and data reporting, warehousing, (JIT) deliveries, and outbound logistics. • 3PL companies currently present in India are multi- national companies with wide experience in handling international logistics.
  • 23.
    Indian Supply ChainScenario Some Facts • GDP : Rs. 27.55 Lakh Crores* • Inventory tied up : Rs. 1.17 Lakh Crores • Logistics Cost : 14% of our GDP • 1% Reduction in LC : Rs. 27550 Crores • 2% Reduction in LC : Rs. 55100 Crores * Economic Survey 2003-04
  • 24.
    Logistics Cost Country GDP (USD b)* Logistics Cost as % of GDP Australia 393.0 10-11 Asian Region China Mainland 1237.1 14.5 India 460.0 14.0 Japan 3996.2 10.5 Korea 468.7 12.4 Singapore 87.0 12.4 Taiwan 281.5 13.5 * World Competitiveness Year Book 2003
  • 25.
    Logistics Cost cont… Country GDP (USD b)* Logistics Cost as % of GDP European Region France 1419.3 11.7 Germany 1987.0 11.8 Italy 1186.0 12.6 Netherlands 418.8 12.2 Spain 654.0 12.1 UK 1555.2 12.2 North American Region Canada 729.3 11.8 Mexico 637.3 14.4 USA 10445.6 08.7 * World Competitiveness Year Book 2003
  • 26.
    International Comparison ofCustomer Orientation Parameters Product Product Design On-Time After-Sales Managing Quality Delivery Service Distribution Brazil 52.39 56.62 36.34 39.15 51.83 Canada 68.13 58.06 62.19 62.50 66.45 France 55.94 66.96 44.64 45.56 66.09 Germany 92.50 71.39 88.06 78.61 75.83 India 41.08 34.05 30.27 41.08 52.43 Japan 92.68 81.46 93.17 89.76 72.20 Netherlands 72.89 63.11 69.78 68.44 74.76 South Korea 60.71 48.57 59.29 47.14 57.14 Thailand 63.00 58.50 57.00 54.00 66.50 USA 59.67 69.84 62.62 57.70 74.43 Note: Companies are rated 0=poor to 100=excellent
  • 27.
    Elements of Logisticscost • Transportation 35% • Inventories 25% • Losses 14% • Packaging 11% • Handling and Warehousing 9% • Customers' shopping 6%
  • 28.
    Ma r ke t O p p o r t u n i t i e s a n d Forecasts Figure 1-1 and Chart 1.1 present the revenue forecast of the Indian logistics industry over the period 2002 to 2009.
  • 29.
    Figure1-1 Logistics Industry: Revenue Forecasts (India), 2002-2009 Revenues Year ($ Billion) 2002 12.66 2003 13.46 2004 14.31 2005 15.22 2006 16.19 2007 17.24 2008 18.35 2009 19.54 Compound Annual Growth Rate (2003-2009): 6.4% Note: All figures are rounded; the base year is 2003. Source: Frost & Sullivan
  • 31.
    Figure 1-2 andChart 1.2 present the revenue forecast of the third-party logistics solutions market over the period 2002 to 2009.
  • 34.
    End-userDemandAnalysis Figure 1-3 andChart 1.3 present the industry wise revenue contribution to the total Indian logistics industry.
  • 40.
    Challenges Facing theLogistics Industry in India
  • 44.
    What’s New inSupply Chain? • Global competition • Well informed more powerful Customers • Customer Expectations • Shorter product life cycle • New, low-cost distribution channels • Internet and E-Business strategies