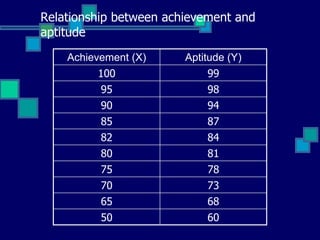
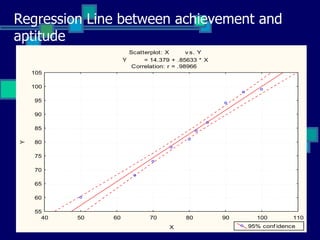
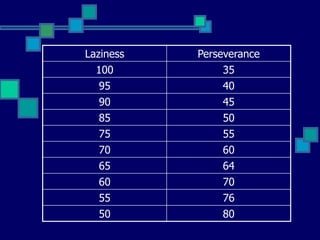
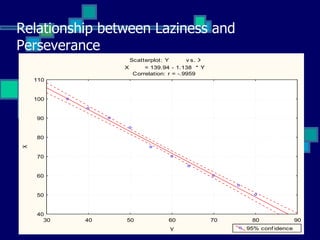
Linear Regression
Linear Regression

   Involves two variables that are paired
    because there is a relationship between
    them
   Deal with measurements made on two
    variables X and Y - bivariate
   Ex. height and weight, achievement &
    learning approach, study habits &
    grades, achievement and aptitude
Linear Regression

   There is a straight line relationship
    between variables X and Y
   When X increases, Y also increases-
    positive relationship
   When X increases, Y decreases or vice
    versa – negative relationship
Relationship between achievement and
aptitude
    Achievement (X)     Aptitude (Y)
         100                99
         95                 98
         90                 94
          85                87
          82                84
          80                81
          75                78
          70                73
          65                68
          50                60
Regression Line between achievement and
aptitude
                       Scatterplot: X       v s. Y
                     Y      = 14.379 + .85633 * X
                        Correlation: r = .98966
    105

    100

    95

    90

    85

    80
Y


    75

    70

    65

    60

    55
      40   50   60            70          80         90     100         110
                                    X                     95% conf idence
Laziness   Perseverance
  100           35
  95           40
  90           45
  85           50
  75           55
  70           60
  65           64
  60           70
  55           76
  50           80
Relationship between Laziness and
Perseverance
                  Scatterplot: Y       v s. X
                X      = 139.94 - 1.138 * Y
                   Correlation: r = -.9959
    110


    100


    90


    80
X


    70


    60


    50


    40
      30   40   50             60               70    80               90
                                Y                    95% conf idence
Y can be predicted based on
the value of X
   Y = a + bX

Linear regression

  • 1.
  • 2.
    Linear Regression  Involves two variables that are paired because there is a relationship between them  Deal with measurements made on two variables X and Y - bivariate  Ex. height and weight, achievement & learning approach, study habits & grades, achievement and aptitude
  • 3.
    Linear Regression  There is a straight line relationship between variables X and Y  When X increases, Y also increases- positive relationship  When X increases, Y decreases or vice versa – negative relationship
  • 4.
    Relationship between achievementand aptitude Achievement (X) Aptitude (Y) 100 99 95 98 90 94 85 87 82 84 80 81 75 78 70 73 65 68 50 60
  • 5.
    Regression Line betweenachievement and aptitude Scatterplot: X v s. Y Y = 14.379 + .85633 * X Correlation: r = .98966 105 100 95 90 85 80 Y 75 70 65 60 55 40 50 60 70 80 90 100 110 X 95% conf idence
  • 6.
    Laziness Perseverance 100 35 95 40 90 45 85 50 75 55 70 60 65 64 60 70 55 76 50 80
  • 7.
    Relationship between Lazinessand Perseverance Scatterplot: Y v s. X X = 139.94 - 1.138 * Y Correlation: r = -.9959 110 100 90 80 X 70 60 50 40 30 40 50 60 70 80 90 Y 95% conf idence
  • 8.
    Y can bepredicted based on the value of X  Y = a + bX