Download as PDF, PPTX


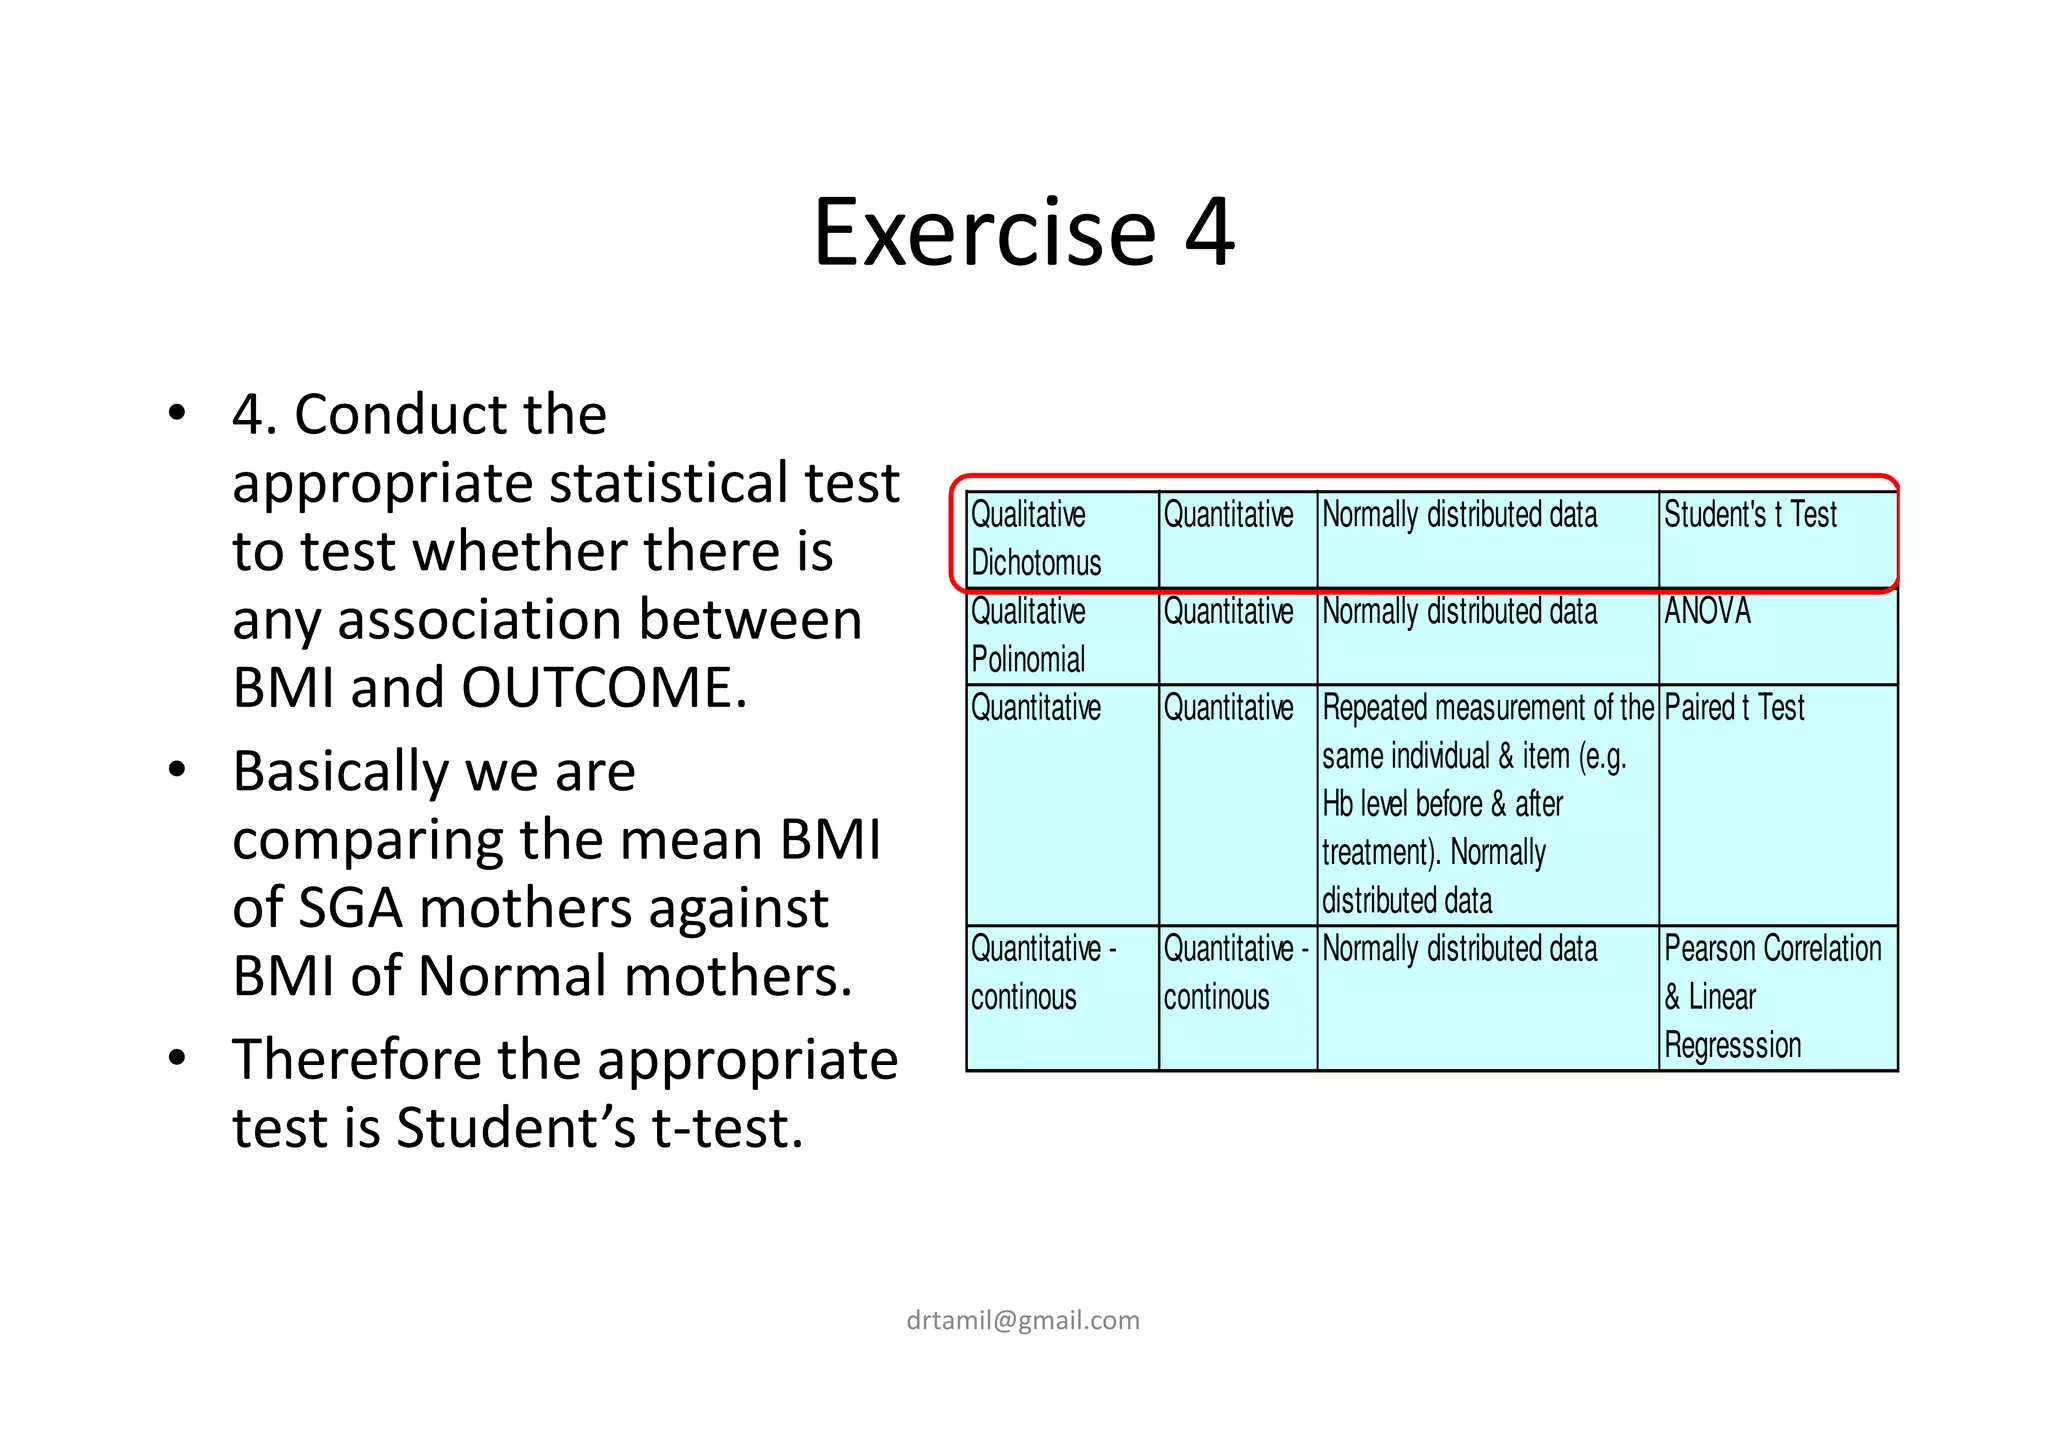


This document outlines different statistical tests used for different types of variables and data distributions. For quantitative-quantitative data that is normally distributed, Pearson correlation or linear regression is used. For qualitative-quantitative data that is normally distributed, a Student's t-test is used. For repeated measurements on the same individual, a paired t-test is used if the data is normally distributed. Non-parametric tests like Wilcoxon rank sum are used for data that is not normally distributed.