Download to read offline


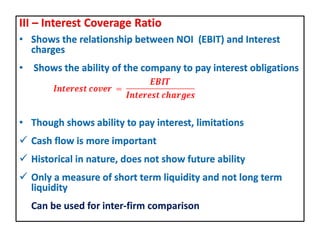
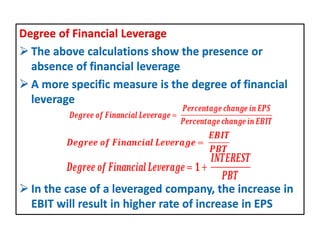
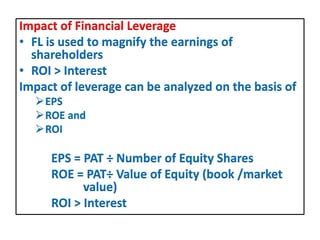
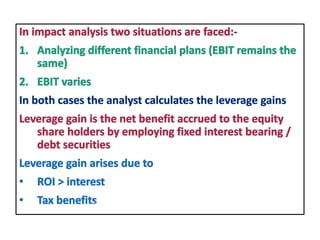
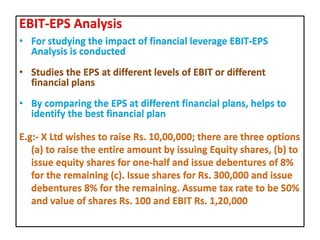
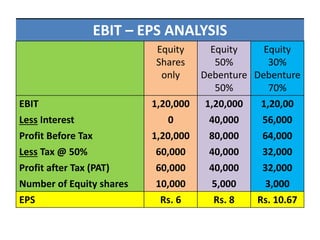
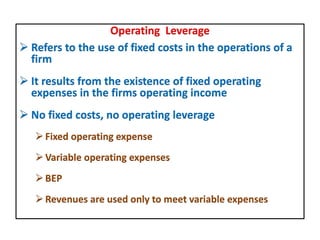
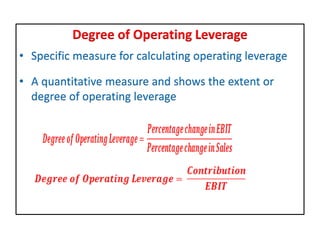
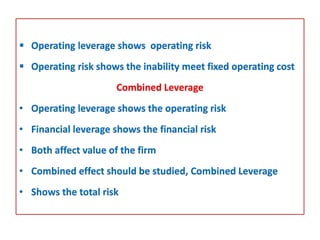
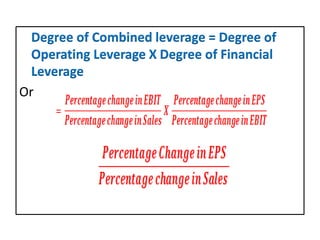

This document discusses different types of financial leverage used by firms, including short-term, medium-term, and long-term leverage as well as ownership and creditorship securities. It also discusses why firms employ borrowed funds through financial leverage, such as to gain tax advantages and earn returns higher than interest rates. Methods for calculating financial leverage ratios are presented, including debt ratio, debt-equity ratio, and interest coverage ratio. The impact of financial leverage on earnings per share, return on equity, and return on investment is explained through EBIT-EPS analysis. Operating leverage and its relationship to financial leverage in determining a firm's overall combined leverage and risk is also covered.


