**Financial Management 2: Advanced Concepts and Applications**
### **Introduction**
Financial Management is a critical aspect of any business, focusing on planning, organizing, directing, and controlling financial resources to achieve an organization's goals. **Financial Management 2** builds upon the foundational principles introduced in the first course and delves into advanced topics such as capital structure, financial leverage, risk management, investment decisions, and corporate valuation. This course is essential for finance professionals, business managers, and students aiming to gain in-depth knowledge of financial strategies and their applications.
### **Key Topics in Financial Management 2**
#### **1. Capital Structure and Leverage**
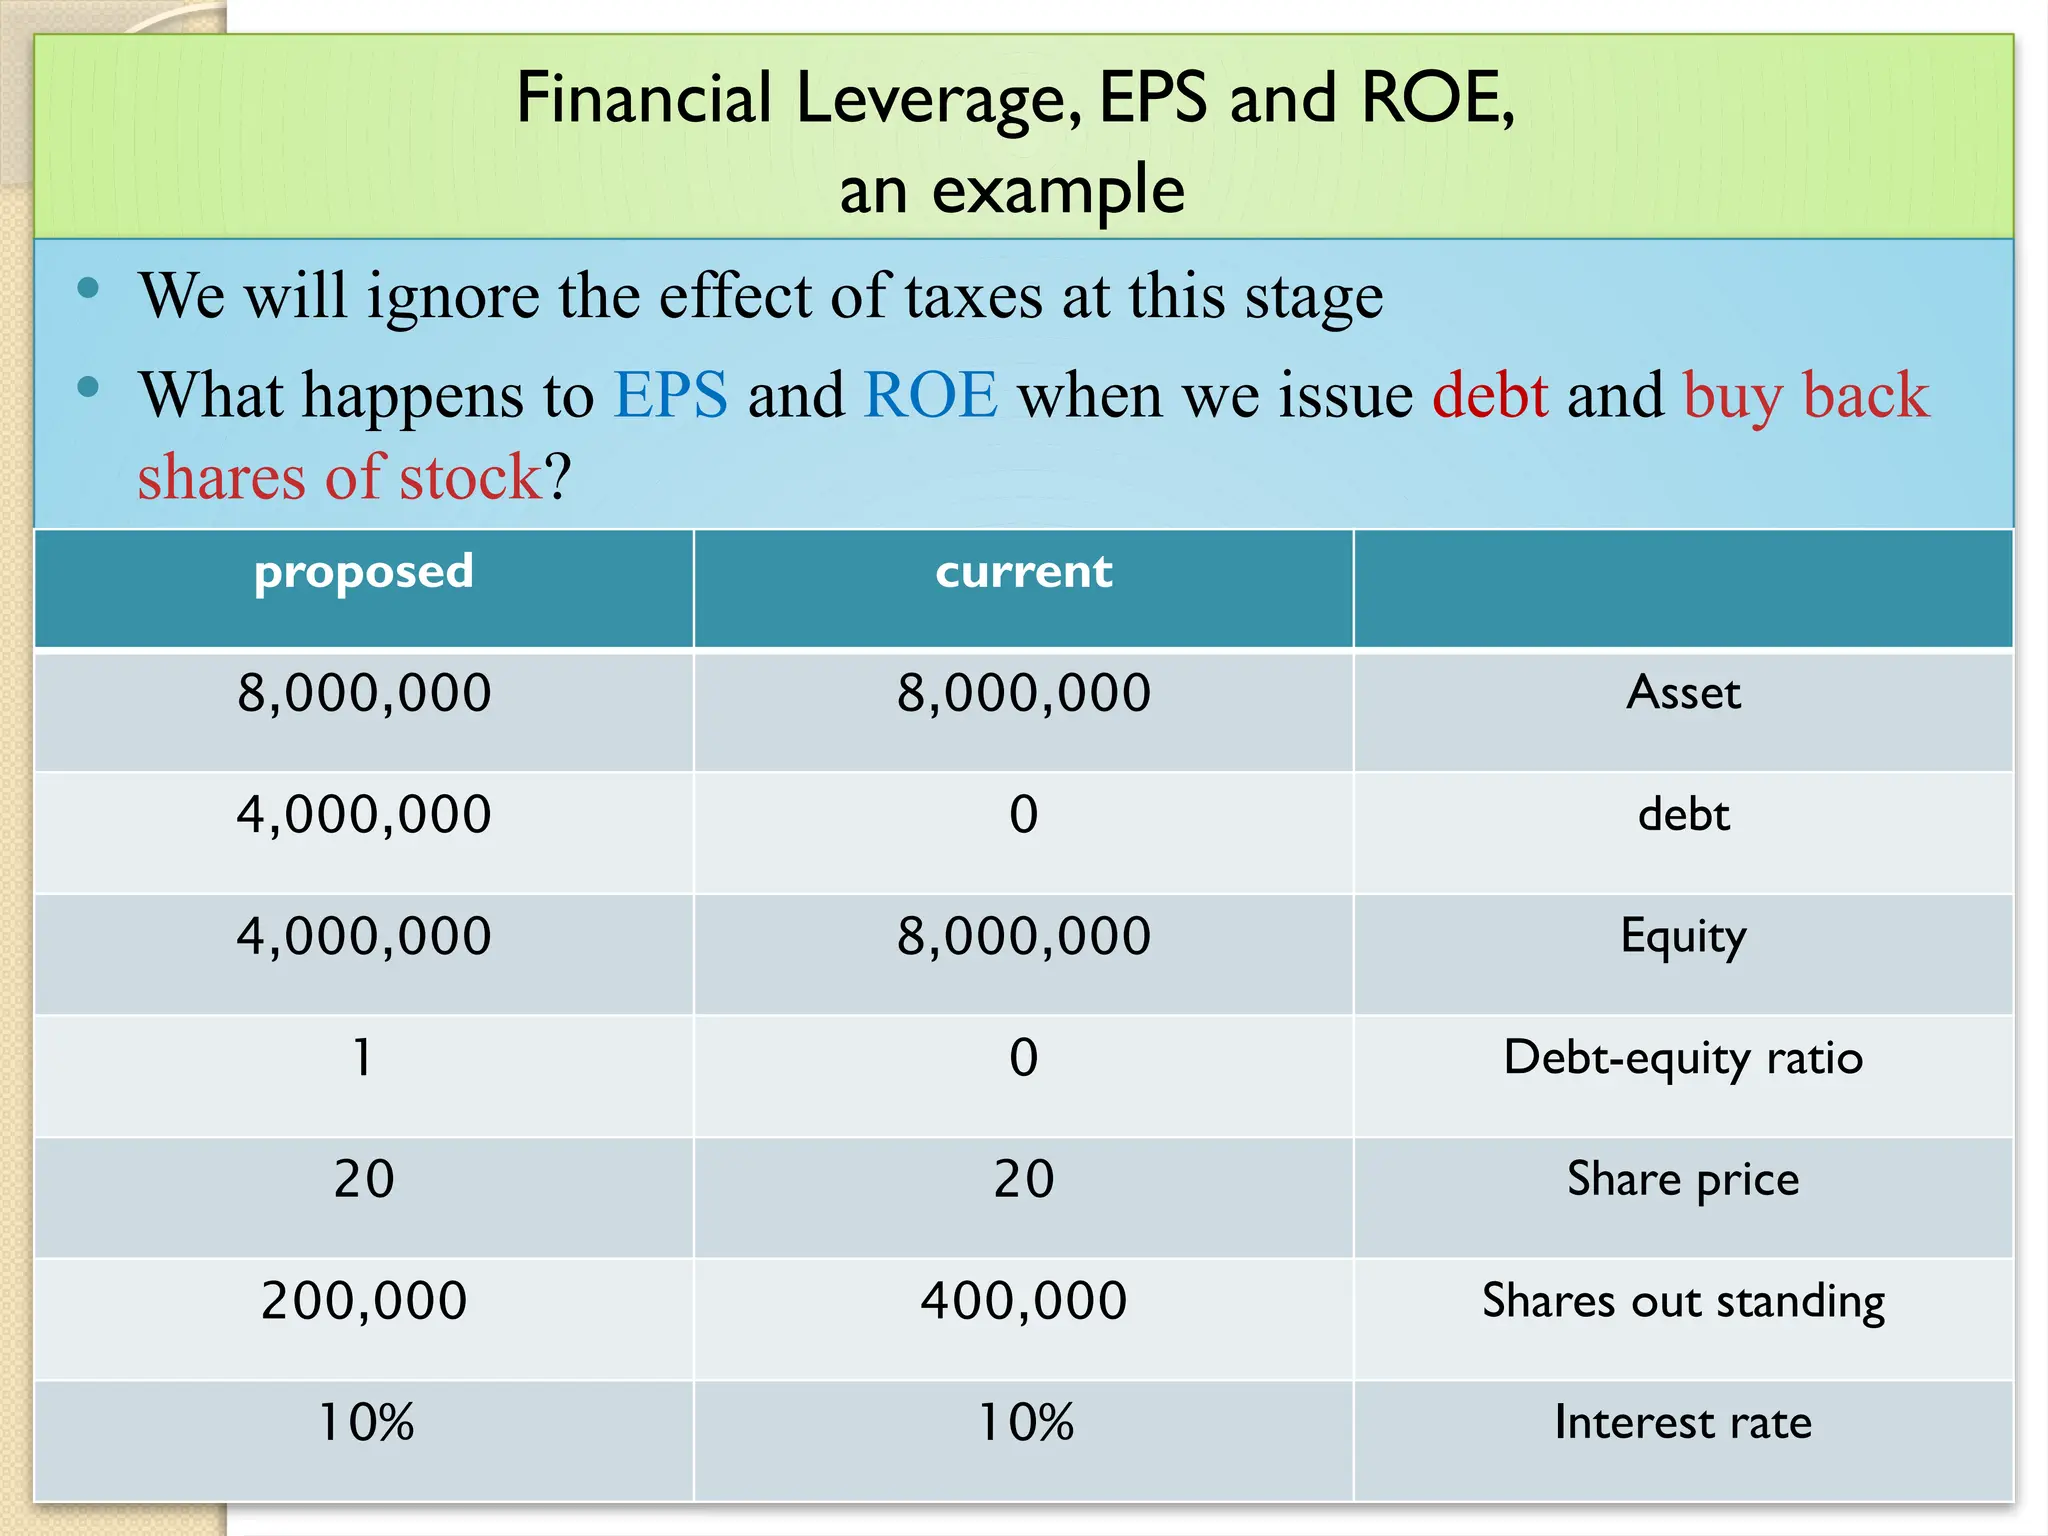
- **Capital Structure Theories**: Understanding the optimal mix of debt and equity.
- **Financial Leverage**: The impact of debt on a firm's earnings and risks.
- **Operating vs. Financial Leverage**: Differences and strategic implications.
- **Modigliani and Miller Theorem**: Proposition I and II and their practical relevance.
#### **2. Investment Decision Making**
- **Capital Budgeting Techniques**:
- Net Present Value (NPV)
- Internal Rate of Return (IRR)
- Payback Period
- Profitability Index
- **Risk Analysis in Capital Budgeting**:
- Sensitivity Analysis
- Scenario Analysis
- Monte Carlo Simulation
- **Real Options in Investment Decisions**
#### **3. Cost of Capital and Firm Valuation**
- **Weighted Average Cost of Capital (WACC)**: Calculation and impact on investment.
- **Cost of Equity and Cost of Debt**: Estimation methods (CAPM, Dividend Discount Model, etc.).
- **Firm Valuation Methods**:
- Discounted Cash Flow (DCF) Model
- Relative Valuation (Price-to-Earnings, Price-to-Book, EV/EBITDA)
- Asset-Based Valuation
#### **4. Dividend Policy and Payout Decisions**
- **Types of Dividend Policies**:
- Constant Payout Ratio
- Stable Dividend Policy
- Residual Dividend Policy
- **Theories of Dividend Policy**:
- Dividend Irrelevance Theory (Miller and Modigliani)
- Bird-in-the-Hand Theory
- Tax Preference Theory
#### **5. Risk Management and Hedging Strategies**
- **Types of Financial Risk**:
- Market Risk
- Credit Risk
- Liquidity Risk
- Operational Risk
- **Hedging Techniques**:
- Derivatives (Forwards, Futures, Options, Swaps)
- Insurance Strategies
- Asset-Liability Management (ALM)
#### **6. Mergers, Acquisitions, and Corporate Restructuring**
- **Types of Mergers**:
- Horizontal, Vertical, and Conglomerate Mergers
- **Valuation in Mergers & Acquisitions (M&A)**
- **Leveraged Buyouts (LBOs) and Management Buyouts (MBOs)**
- **Corporate Restructuring Strategies**:
- Spin-offs
- Divestitures
- Equity Carve-outs
#### **7. International Financial Management**
- **Foreign Exchange Markets and Exchange Rate Determination**
- **International Capital Budgeting**
- **Hedging Foreign Exchange Risk**
- **Multinational Capital Structure and Cost o