- Leverage provides the framework for financing decisions and can be defined as using an asset or source of funds that requires paying a fixed cost or return.
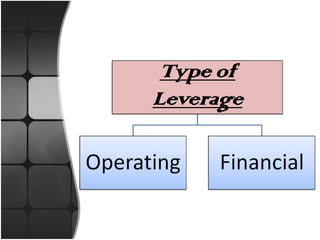
- Operating leverage is associated with fixed operating costs and how much they magnify changes in sales on operating profits. Financial leverage measures how debt impacts changes in earnings per share.
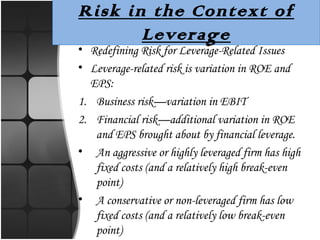
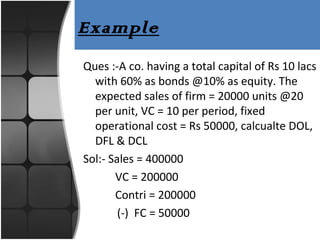
- Degree of operating leverage (DOL) and degree of financial leverage (DFL) are used to measure the sensitivity of profits and earnings to changes in sales and operating profits respectively. Higher leverage means greater risk but also greater potential returns.