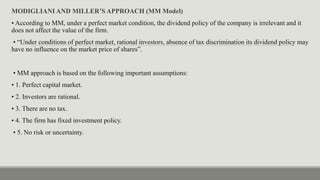
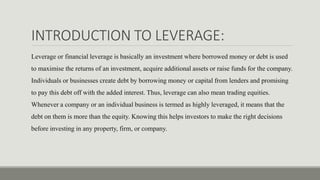
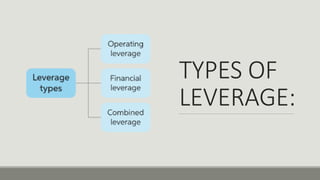
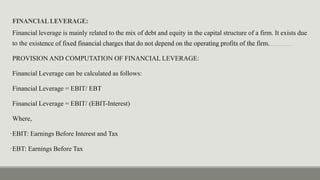
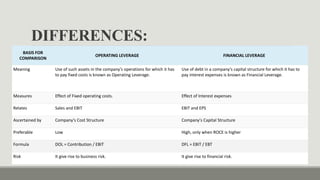
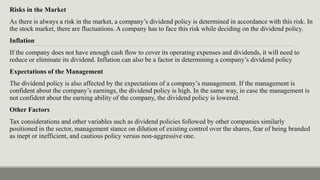
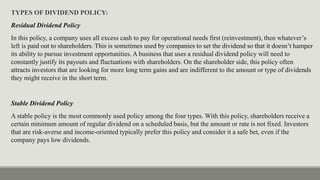
Leverage refers to using borrowed funds to maximize returns on investments. There are two main types of leverage - operating leverage and financial leverage. Operating leverage is related to fixed operating costs, while financial leverage is related to the capital structure and fixed interest costs. The degree of operating leverage and financial leverage can be calculated using formulas that consider factors like earnings before interest and taxes (EBIT). A company's dividend policy outlines how much profit will be distributed to shareholders versus retained for reinvestment. Key factors that influence dividend policy include liquidity, stability of profits, growth opportunities and legal/tax considerations.
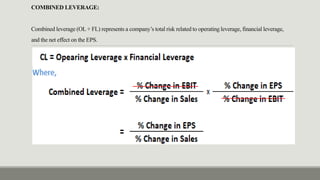
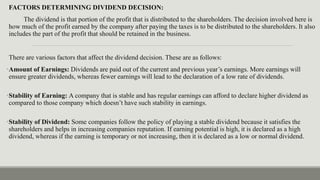
![OPERATING LEVERAGE:
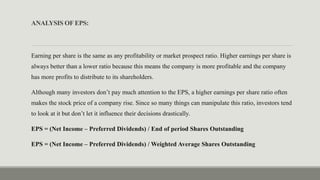
When a company uses debt financing, its financial leverage increases. More capital is available to
boost returns, at the cost of interest payments, which affect net earnings.
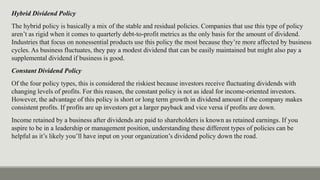
PROVISION AND COMPUTATION OF OPERATING LEVERAGE:
A company can calculate its degree of operating leverage by taking its earnings before interest and tax (EBIT)
and then dividing that number by the company’s percentage change in sales output. The operating leverage
formula is as follows:
Degree of operating leverage = [number of units x (price per unit - variable cost per unit)] / number of units x
(price per unit - variable cost per unit) - fixed operating costs
To calculate operating leverage, note the number of units (or products) that your company is selling, the price
per unit, the variable cost per unit, and the fixed operating costs. You can find many of these numbers on your
company’s income statement, cash-flow projections, or other financial statements](https://image.slidesharecdn.com/leveragesdividendpolicy-230107075413-0915f904/85/LEVERAGES-DIVIDEND-POLICY-pptx-6-320.jpg)
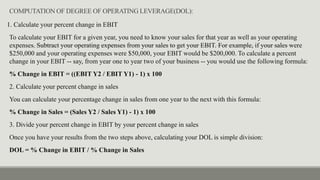
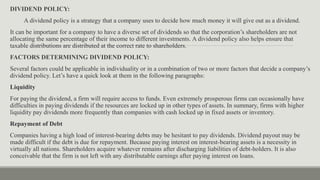
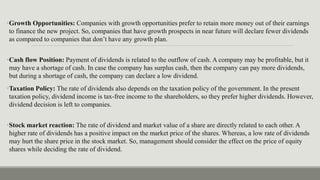
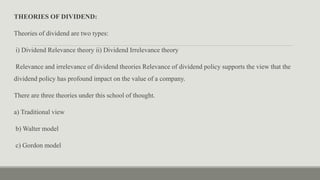
![But in case, the company retains the earnings; then the investors can expect a dividend in future.
But the future dividends are uncertain with respect to the amount as well as the time, i.e., how much
and when the dividends will be received. Thus, an investor would discount the future dividends, i.e.,
puts less importance on it as compared to the current dividends.
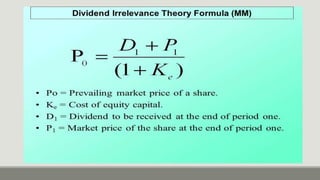
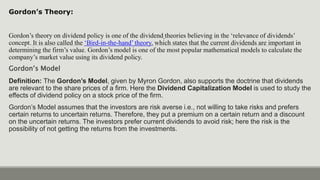
According to the Gordon’s Model, the market value of the share is equal to the present value of
future dividends. It is represented as:
P = [E (1-b)] / Ke-br
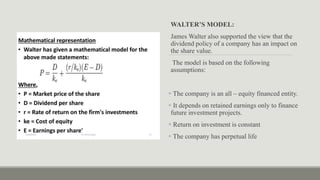
Where, P = price of a share
E = Earnings per share
b = retention ratio
1-b = proportion of earnings distributed as dividends
Ke = capitalization rate
Br = growth rate](https://image.slidesharecdn.com/leveragesdividendpolicy-230107075413-0915f904/85/LEVERAGES-DIVIDEND-POLICY-pptx-30-320.jpg)