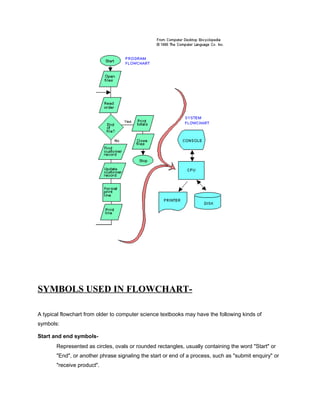
ASSIGNMENT ON 
DIAGRAM AND 
FLOWCHART 
SUBMITED BY-KRISHNA 
CHANDRA SAGAR 
1S SEMESTER 
ROLL NO-MBA 1910
DIAGRAM-A 
diagram is a two-dimensional geometric symbolic representation of information according to 
some visualization technique. Sometimes, the technique uses a three-dimensional visualization 
which is then projected onto the two-dimensional surface. The word graph is sometimes used as 
a synonym for diagram. 
Here term diagram in common sense can have two meanings. 
· visual information device : Like the term "illustration" the diagram is used as a collective 
term standing for the whole class of technical genres, including graphs, technical 
drawings and tables. 
· specific kind of visual display : This is only the genre, that show qualitative data with 
shapes that are connected by lines, arrows, or other visual links. 
In science the term is used in both ways. For example Anderson (1997) stated more generally: 
"diagrams are pictorial, yet abstract, representations of information, and maps, line graphs, bar 
charts, engineering blueprints, and architects' sketches are all examples of diagrams, whereas 
photographs and video are not". On the other hand Lowe (1993) defined diagrams as specifically 
"abstract graphic portrayals of the subject matter they represent". 
The essences of a diagram can be seen as: 
· a form of visual formatting devices 
· a display that do not show quantitative data, but rather relationships and abstract 
information 
· with building blocks such as geometrical shapes connected by lines, arrows, or other 
visual link. 
Main diagram types- 
There are at least the following types of diagrams: 
· Graph -based diagrams: these take a collection of items and relationships between them, 
and express them by giving each item a 2D position, while the relationships are expressed 
as connections between the items or overlaps between the items; examples of such 
techniques:
tree 
diagram 
network diagram 
flowchart 
Venn diagram 
existential graph 
· Chart -like diagram techniques, which display a relationship between two variables 
that take either discrete or a continuous ranges of values; examples: 
histogram bar chart pie chart 
function graphscatter plot 
· Other types of diagrams-train 
diagramexploded viewpopulation density mapPioneer plaque
FLOWCHART-A 
graphical representation of the sequence of operations in an information 
system or program. Information system flowcharts show how data flows from 
source documents through the computer to final distribution to users. Program 
flowcharts show the sequence of instructions in a single program or subroutine. 
Different symbols are used to draw each type of flowchart.
SYMBOLS USED IN FLOWCHART-A 
typical flowchart from older to computer science textbooks may have the following kinds of 
symbols: 
Start and end symbols- 
Represented as circles, ovals or rounded rectangles, usually containing the word "Start" or 
"End", or another phrase signaling the start or end of a process, such as "submit enquiry" or 
"receive product".
Arrows- 
Showing what's called "flow of control" in computer science. An arrow coming from one 
symbol and ending at another symbol represents that control passes to the symbol the arrow 
points to. 
Processing steps- 
Represented as rectangles. Examples: "Add 1 to X"; "replace identified part"; "save changes" 
or similar. 
Input/Output- 
Represented as a parallelogram. Examples: Get X from the user; display X. 
Conditional or decision 
Represented as a diamond (rhombus). These typically contain a Yes/No question or 
True/False test. This symbol is unique in that it has two arrows coming out of it, usually from 
the bottom point and right point, one corresponding to Yes or True, and one corresponding 
to No or False. The arrows should always be labeled.A decision is necessary in a flowchart. 
More than two arrows can be used, but this is normally a clear indicator that a complex 
decision is being taken, in which case it may need to be broken-down further, or replaced 
with the "pre-defined process" symbol. 
A number of other symbols that have less universal currency, such as: 
ď‚§ A Document represented as a rectangle with a wavy base; 
ď‚§ A Manual input represented by parallelogram, with the top irregularly 
sloping up from left to right. An example would be to signify data-entry 
from a form; 
ď‚§ A Manual operation represented by a trapezoid with the longest 
parallel side at the top, to represent an operation or adjustment to 
process that can only be made manually. 
Flowcharts may contain other symbols, such as connectors, usually represented as circles, 
to represent converging paths in the flowchart. Circles will have more than one arrow 
coming into them but only one going out. Some flowcharts may just have an arrow point to 
another arrow instead. These are useful to represent an iterative process (what in Computer 
Science is called a loop). A loop may, for example, consist of a connector where control first 
enters, processing steps, a conditional with one arrow exiting the loop, and one going back 
to the connector.It is important to remember to keep these connection logical in order.All 
processes should flow from top to bottom and left to right.
Types of flowchart 
Example of a system flowchart. 
Sterneckert (2003) suggested that flowcharts can be modelled from the perspective of different user 
groups (such as managers, system analysts and clerks) and that there are four general types: 
· Document flowcharts, showing controls over a document-flow through a system 
· Data flowcharts, showing controls over a data flows in a system 
· System flowcharts showing controls at a physical or resource level 
· Program flowchart, showing the controls in a program within a system 
Notice that every type of flowchart focusses on some kind of control, rather than on the particular 
flow itself. 
EXAMPLE OF FLOWCHARTS-
SOURCE-www. 
google.com 
www.wikipedia.com
SOURCE-www. 
google.com 
www.wikipedia.com

Assignment on diagram and flowchart 1

  • 1.
    ASSIGNMENT ON DIAGRAMAND FLOWCHART SUBMITED BY-KRISHNA CHANDRA SAGAR 1S SEMESTER ROLL NO-MBA 1910
  • 2.
    DIAGRAM-A diagram isa two-dimensional geometric symbolic representation of information according to some visualization technique. Sometimes, the technique uses a three-dimensional visualization which is then projected onto the two-dimensional surface. The word graph is sometimes used as a synonym for diagram. Here term diagram in common sense can have two meanings. · visual information device : Like the term "illustration" the diagram is used as a collective term standing for the whole class of technical genres, including graphs, technical drawings and tables. · specific kind of visual display : This is only the genre, that show qualitative data with shapes that are connected by lines, arrows, or other visual links. In science the term is used in both ways. For example Anderson (1997) stated more generally: "diagrams are pictorial, yet abstract, representations of information, and maps, line graphs, bar charts, engineering blueprints, and architects' sketches are all examples of diagrams, whereas photographs and video are not". On the other hand Lowe (1993) defined diagrams as specifically "abstract graphic portrayals of the subject matter they represent". The essences of a diagram can be seen as: · a form of visual formatting devices · a display that do not show quantitative data, but rather relationships and abstract information · with building blocks such as geometrical shapes connected by lines, arrows, or other visual link. Main diagram types- There are at least the following types of diagrams: · Graph -based diagrams: these take a collection of items and relationships between them, and express them by giving each item a 2D position, while the relationships are expressed as connections between the items or overlaps between the items; examples of such techniques:
  • 3.
    tree diagram networkdiagram flowchart Venn diagram existential graph · Chart -like diagram techniques, which display a relationship between two variables that take either discrete or a continuous ranges of values; examples: histogram bar chart pie chart function graphscatter plot · Other types of diagrams-train diagramexploded viewpopulation density mapPioneer plaque
  • 4.
    FLOWCHART-A graphical representationof the sequence of operations in an information system or program. Information system flowcharts show how data flows from source documents through the computer to final distribution to users. Program flowcharts show the sequence of instructions in a single program or subroutine. Different symbols are used to draw each type of flowchart.
  • 5.
    SYMBOLS USED INFLOWCHART-A typical flowchart from older to computer science textbooks may have the following kinds of symbols: Start and end symbols- Represented as circles, ovals or rounded rectangles, usually containing the word "Start" or "End", or another phrase signaling the start or end of a process, such as "submit enquiry" or "receive product".
  • 6.
    Arrows- Showing what'scalled "flow of control" in computer science. An arrow coming from one symbol and ending at another symbol represents that control passes to the symbol the arrow points to. Processing steps- Represented as rectangles. Examples: "Add 1 to X"; "replace identified part"; "save changes" or similar. Input/Output- Represented as a parallelogram. Examples: Get X from the user; display X. Conditional or decision Represented as a diamond (rhombus). These typically contain a Yes/No question or True/False test. This symbol is unique in that it has two arrows coming out of it, usually from the bottom point and right point, one corresponding to Yes or True, and one corresponding to No or False. The arrows should always be labeled.A decision is necessary in a flowchart. More than two arrows can be used, but this is normally a clear indicator that a complex decision is being taken, in which case it may need to be broken-down further, or replaced with the "pre-defined process" symbol. A number of other symbols that have less universal currency, such as: ď‚§ A Document represented as a rectangle with a wavy base; ď‚§ A Manual input represented by parallelogram, with the top irregularly sloping up from left to right. An example would be to signify data-entry from a form; ď‚§ A Manual operation represented by a trapezoid with the longest parallel side at the top, to represent an operation or adjustment to process that can only be made manually. Flowcharts may contain other symbols, such as connectors, usually represented as circles, to represent converging paths in the flowchart. Circles will have more than one arrow coming into them but only one going out. Some flowcharts may just have an arrow point to another arrow instead. These are useful to represent an iterative process (what in Computer Science is called a loop). A loop may, for example, consist of a connector where control first enters, processing steps, a conditional with one arrow exiting the loop, and one going back to the connector.It is important to remember to keep these connection logical in order.All processes should flow from top to bottom and left to right.
  • 7.
    Types of flowchart Example of a system flowchart. Sterneckert (2003) suggested that flowcharts can be modelled from the perspective of different user groups (such as managers, system analysts and clerks) and that there are four general types: · Document flowcharts, showing controls over a document-flow through a system · Data flowcharts, showing controls over a data flows in a system · System flowcharts showing controls at a physical or resource level · Program flowchart, showing the controls in a program within a system Notice that every type of flowchart focusses on some kind of control, rather than on the particular flow itself. EXAMPLE OF FLOWCHARTS-
  • 9.
  • 10.