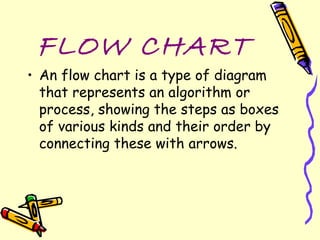
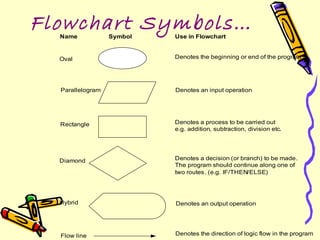
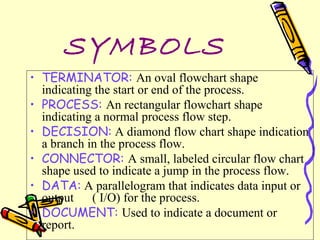
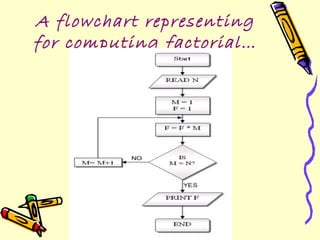
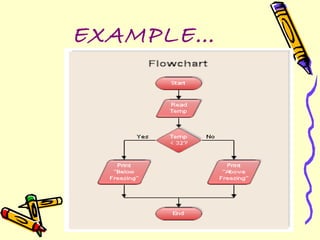
PRESENTATIO
   N ON
FLOWCHARTS
     Made by:
  Simranjit Singh
   CSE-2nd Shift
      115360
FLOW CHART
• An flow chart is a type of diagram
  that represents an algorithm or
  process, showing the steps as boxes
  of various kinds and their order by
  connecting these with arrows.
USES….
• Flow chart are used in designing and
  documenting complex processes.
• Like other types of diagrams, they
  help to visualize what is going on and
  thereby help the viewer to
  understand the process.
TYPES…
• Document flowcharts, showing control
  over a document-flow over a system.
• Data flowcharts, showing control over
  a data-flow in a system.
• System flowcharts showing control at a
  physical or resource level.
• Program flowchart, showing the
  controls in a program within a system.
Flowchart Symbols…
  Name            Symbol   Use in Flowchart


  Oval                     Denotes the beginning or end of the program


  Parallelogram            Denotes an input operation


  Rectangle                Denotes a process to be carried out
                           e.g. addition, subtraction, division etc.


  Diamond                  Denotes a decision (or branch) to be made.
                           The program should continue along one of
                           two routes. (e.g. IF/THEN/ELSE)


  Hybrid                   Denotes an output operation


  Flow line                Denotes the direction of logic flow in the program
SYMBOLS
• TERMINATOR: An oval flowchart shape
  indicating the start or end of the process.
• PROCESS: An rectangular flowchart shape
  indicating a normal process flow step.
• DECISION: A diamond flow chart shape indication
  a branch in the process flow.
• CONNECTOR: A small, labeled circular flow chart
  shape used to indicate a jump in the process flow.
• DATA: A parallelogram that indicates data input or
  output ( I/O) for the process.
• DOCUMENT: Used to indicate a document or
  report.
DATA FLOW
      EXTENSIONS…
• A document represented as a rectangle with
  a wavy base.
• A manual input represented by a
  quadrilateral.
• A data file represented by a cylinder.
• A manual operation represented by a
  trapezoid.
ADVANTAGES…
•   COMMUNICATION.
•   EFFECTIVE ANALYSIS.
•   PROPER DOCUMENTATION.
•   EFFICIENT CODING.
•   PROPER DEBUGGING.
LIMITATIONS…
• COMPLEX LOGIC.
• ALTERATIONS AND
  MODIFICATIONS.
• THE ESSENTIALS OF WHAT IS DONE
  CAN EASILY BE LOST IN THE
  TECHNICAL DETAILS OF HOW IT IS
  DONE.
LAMP FLOWCHART…
A flowchart representing
for computing factorial…
Flow chart showing driving to
           a goal…
Flow chart for finding
  out the largest of 3
       numbers…
Flowchart to find the
sum of first 50 natural
      numbers…
Example…
                 START


                 Input
              M1,M2,M3,M4
                                Step 1: Input M1,M2,M3,M4
                                Step 2: GRADE ← (M1+M2+M3+M4)/4
                                Step 3: if (GRADE <50) then
    GRADE←(M1+M2+M3+M4)/4                       Print “FAIL”
                                        else
                                                Print “PASS”
    N                       Y
                                        endif
                 IS
              GRADE<50


                            PRINT
 PRINT                      “FAIL”
“PASS”


                STOP
EXAMPLE…
EXAMPLE…
Thanks A lot
For Watching
     06/03/2012

Flowcharts

  • 1.
    PRESENTATIO N ON FLOWCHARTS Made by: Simranjit Singh CSE-2nd Shift 115360
  • 2.
    FLOW CHART • Anflow chart is a type of diagram that represents an algorithm or process, showing the steps as boxes of various kinds and their order by connecting these with arrows.
  • 3.
    USES…. • Flow chartare used in designing and documenting complex processes. • Like other types of diagrams, they help to visualize what is going on and thereby help the viewer to understand the process.
  • 4.
    TYPES… • Document flowcharts,showing control over a document-flow over a system. • Data flowcharts, showing control over a data-flow in a system. • System flowcharts showing control at a physical or resource level. • Program flowchart, showing the controls in a program within a system.
  • 5.
    Flowchart Symbols… Name Symbol Use in Flowchart Oval Denotes the beginning or end of the program Parallelogram Denotes an input operation Rectangle Denotes a process to be carried out e.g. addition, subtraction, division etc. Diamond Denotes a decision (or branch) to be made. The program should continue along one of two routes. (e.g. IF/THEN/ELSE) Hybrid Denotes an output operation Flow line Denotes the direction of logic flow in the program
  • 6.
    SYMBOLS • TERMINATOR: Anoval flowchart shape indicating the start or end of the process. • PROCESS: An rectangular flowchart shape indicating a normal process flow step. • DECISION: A diamond flow chart shape indication a branch in the process flow. • CONNECTOR: A small, labeled circular flow chart shape used to indicate a jump in the process flow. • DATA: A parallelogram that indicates data input or output ( I/O) for the process. • DOCUMENT: Used to indicate a document or report.
  • 7.
    DATA FLOW EXTENSIONS… • A document represented as a rectangle with a wavy base. • A manual input represented by a quadrilateral. • A data file represented by a cylinder. • A manual operation represented by a trapezoid.
  • 8.
    ADVANTAGES… • COMMUNICATION. • EFFECTIVE ANALYSIS. • PROPER DOCUMENTATION. • EFFICIENT CODING. • PROPER DEBUGGING.
  • 9.
    LIMITATIONS… • COMPLEX LOGIC. •ALTERATIONS AND MODIFICATIONS. • THE ESSENTIALS OF WHAT IS DONE CAN EASILY BE LOST IN THE TECHNICAL DETAILS OF HOW IT IS DONE.
  • 10.
  • 11.
    A flowchart representing forcomputing factorial…
  • 12.
    Flow chart showingdriving to a goal…
  • 13.
    Flow chart forfinding out the largest of 3 numbers…
  • 14.
    Flowchart to findthe sum of first 50 natural numbers…
  • 15.
    Example… START Input M1,M2,M3,M4 Step 1: Input M1,M2,M3,M4 Step 2: GRADE ← (M1+M2+M3+M4)/4 Step 3: if (GRADE <50) then GRADE←(M1+M2+M3+M4)/4 Print “FAIL” else Print “PASS” N Y endif IS GRADE<50 PRINT PRINT “FAIL” “PASS” STOP
  • 16.
  • 17.
  • 18.
    Thanks A lot ForWatching 06/03/2012