Downloaded 137 times

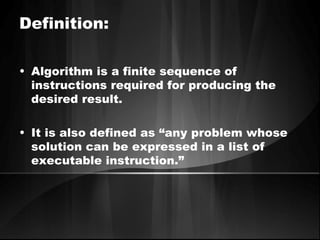
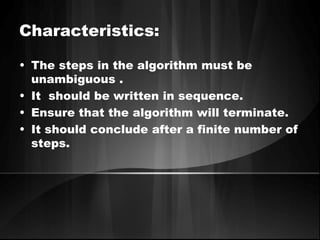
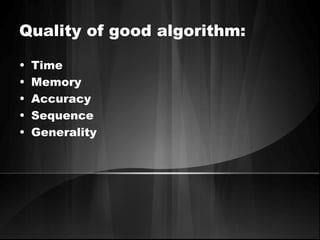
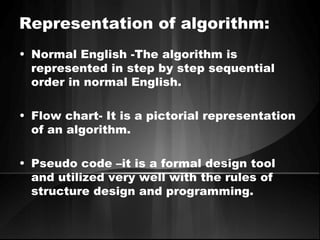
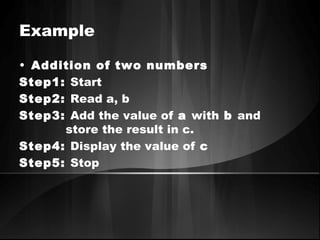

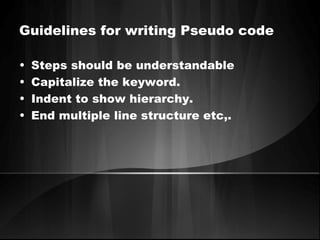
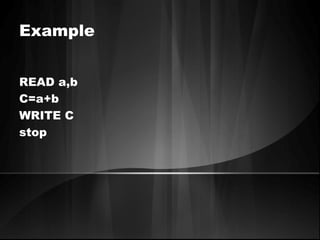
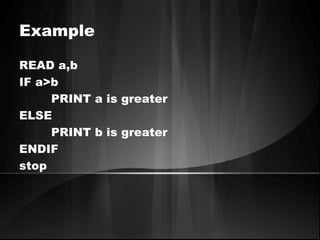
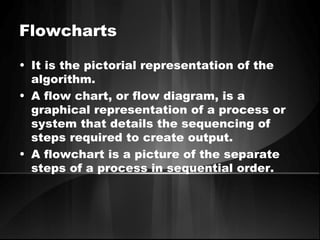
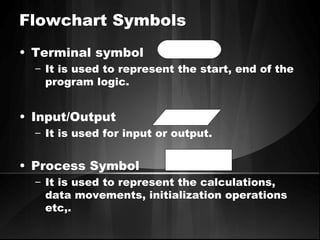
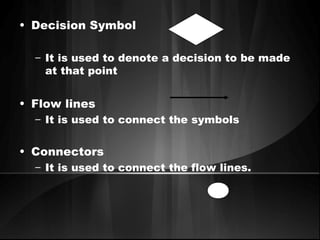
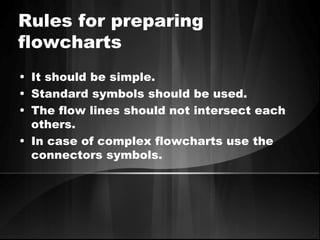
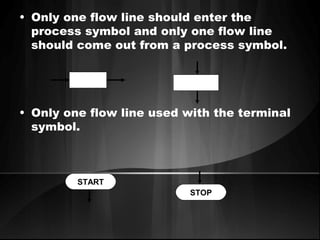
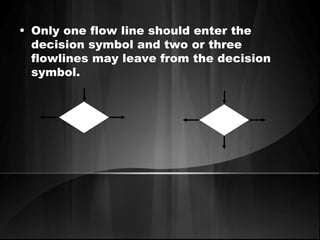
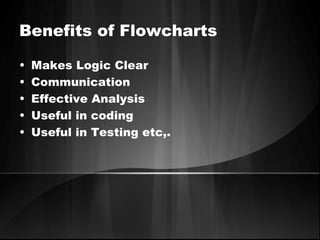
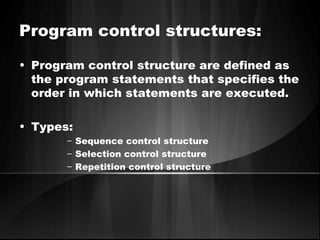
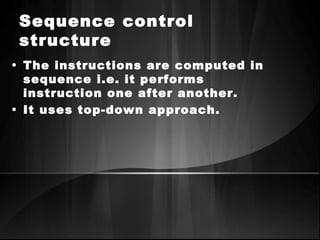
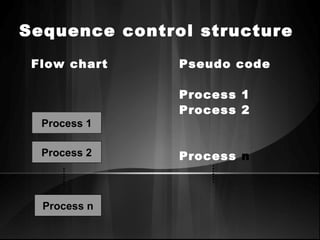
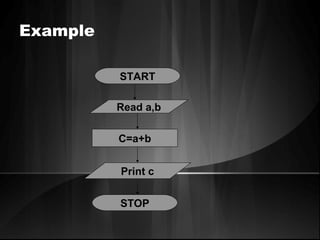
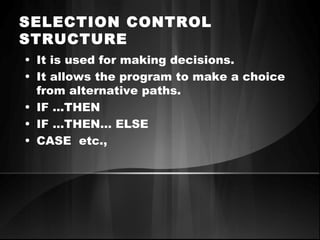
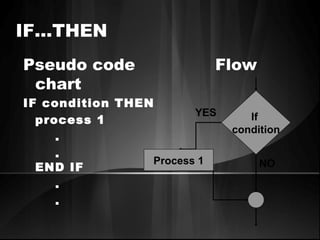
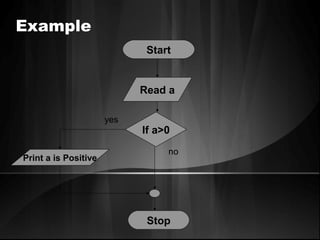
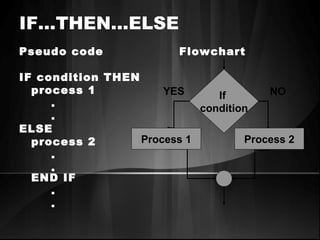
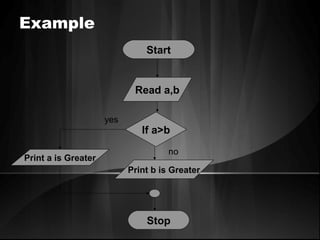
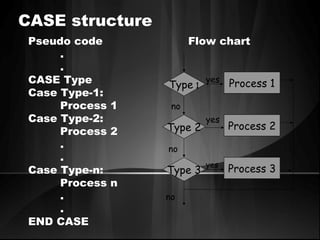
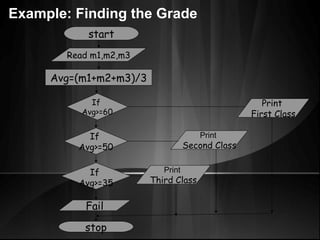
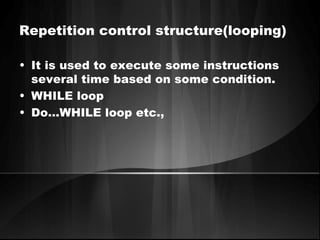
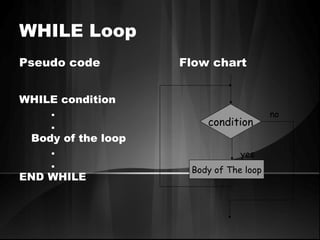
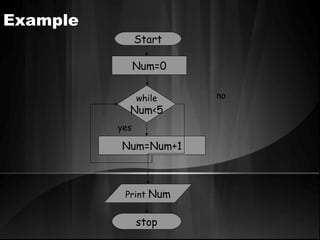
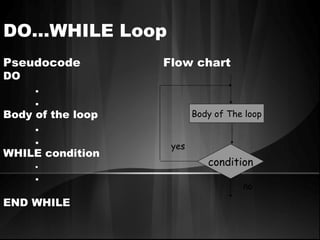
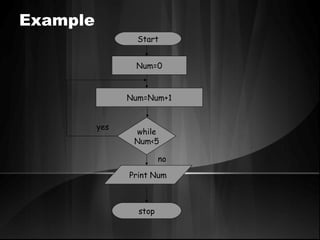
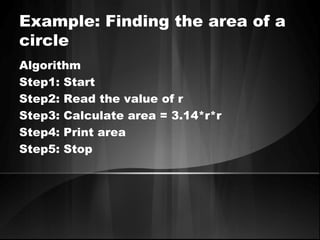


The document defines algorithms and different representations of algorithms such as normal English, flow charts, pseudo code, and programs. It provides examples of different control structures like sequence, selection, and repetition. Key points include: algorithms must be unambiguous, terminate in a finite number of steps, and time, memory, accuracy and generality are qualities of a good algorithm. Pseudo code uses keywords and indentation to represent program logic clearly. Flow charts use standard symbols and avoid intersecting lines to depict a process visually. Control structures determine the order of execution through sequencing, conditional checks, or repeated execution.


![Introduction To Algorithm [2]](https://cdn.slidesharecdn.com/ss_thumbnails/introduction-to-algorithm-2-1233232697055520-1-thumbnail.jpg?width=640&height=640&fit=bounds)


![[Rakuten TechConf2014] [D-6] Rakuten BaaS in ROOM & Rakuten Kobo](https://cdn.slidesharecdn.com/ss_thumbnails/d6rtc2014goldenandkawahara-141105042002-conversion-gate01-thumbnail.jpg?width=640&height=640&fit=bounds)