I make a copy for each student so they can track their progress with each learning goal. I can keep track too.
This document was created with Microsoft Word 2010.
This lesson uses TI-Nspire software to demonstrate quadratic transformations. Students will explore how varying the coefficients a, b, and c affects the graph of the quadratic function. By manipulating sliders to change coefficient values, students can observe the transformations and develop an understanding of each coefficient's impact on the graph. The technology allows students to quickly test conjectures and analyze multiple functions simultaneously. This interactive, exploration-based approach aims to help students discern the relationships between algebraic and graphical representations of quadratics.
This PowerPoint presentation summarizes basic matrix operations and notation for a math course. It defines a matrix as a rectangular array of numbers with defined operations like addition and multiplication. Matrix size is specified by the number of rows and columns. Notation represents matrices with uppercase letters and entries with subscripts. Basic operations covered include addition, subtraction, scalar multiplication, transposition, and multiplication. Row operations and submatrix definitions are also introduced.
The document defines key terms and concepts relating to matrices. It explains that a matrix is a two-dimensional array with rows and columns used to organize data. Matrices allow for simple display of data with non-essential information removed. They have various applications including graphic design and solving equations. The document defines order, elements, and notation for referring to entries in a matrix. It provides examples for stating the order, values, and positions of elements in matrices. Finally, it describes special types of matrices such as column, row, square, and triangular matrices as well as properties like the transpose and leading diagonal.
8th grade ngsss math standards checklist formatTaleese
Fl teachers. You can take this chart to a Kinkos/FedEx and blow it up to poster size for about $5-$10 a sheet. Laminate it at your school, and post on wall using Velcro.
You can also provide each student with this a way to track their learning.
Scope and sequence , Budget of work ,and Weekly Lesson Plan in Educ.11Reymart Bargamento
The document outlines the quarterly topics and chapters covered in an Integrated Mathematics II course across four quarters of the school year. The first quarter covers equations and inequalities of the first degree, including fundamental assumptions, equations in one variable, reasoning out solutions, and coordinate systems. It also covers systems of linear equations. The second quarter covers systems of linear equations and inequalities in two variables, linear programming, geometry concepts like points and lines, and properties of triangles. The third quarter focuses on angles, triangle and similarity properties, and parallel lines. The fourth quarter covers basic statistics, properties of quadrilaterals, and summation concepts. It includes a weekly lesson plan template addressing objectives, topics, activities, and assignments for each chapter
Students will learn to convert graphs into matrices and use the concept of matrix equality to solve simple equations. Specifically, they will understand that a matrix represents the number of roads between towns, with elements indicating roads between locations. They will also learn that two matrices are equal only when their order and all elements are the same, and this can be used to calculate unknown values in a matrix equation.
This document defines and describes various types of matrices. It defines a matrix as a rectangular array of numbers or functions with m rows and n columns referred to as an m x n matrix. It then lists and defines the following types of matrices: row matrix, column matrix, null matrix, rectangular matrix, square matrix, diagonal matrix, scalar matrix, unit matrix, symmetric matrix, and skew-symmetric matrix. It provides examples of each type of matrix and their general syntax.
PPT by Bu Meli Fitriani, S.Pd. & Shinta Novianti, S.Pd., M.M.
Materi: HIMPUNAN
Sub Materi: Operasi Himpunan Irisan & Gabungan
MATEMATIKA
Kelas 7
TP 2021/2022
#jhs
#pjj
#sn
This document provides an overview and definitions of key concepts from Chapter 1 of a college mathematics textbook, including: linear equations and inequalities in standard form and how they are solved; the Cartesian coordinate system and how graphs of linear equations form lines; determining the slope and equations of lines in slope-intercept and point-slope form; the relationship between supply and demand curves; and using linear regression to fit a line to scatter plot data and make predictions.
A matrix is an array of elements organized into rows and columns. The dimensions of a matrix specify the number of rows and columns, expressed as rows by columns. This document provides examples of stating the dimensions of matrices, solving systems of equations represented by matrices, and using a matrix to organize data with multiple attributes for different items.
A matrix is a rectangular array of elements organized in rows and columns. The document provides examples of stating the dimensions of matrices, solving systems of equations represented by matrices, organizing data into matrices, adding and subtracting matrices of the same dimensions, multiplying matrices by scalars, and performing other matrix operations.
This document describes a lesson plan for teaching students about transformations of quadratics. The lesson uses TI-Inspire software to allow students to explore how changing the coefficients a, b, and c affects the graph of a quadratic function. Students will first investigate how a affects the shape of the graph using sliders. They will then explore how b changes the location of the vertex and how c changes the y-intercept. Finally, students will graph multiple functions with roots of 3 and 5 to analyze similarities and differences between the graphs. The technology enables efficient exploration and comparison of graphs to build conceptual understanding of quadratic transformations.
This document outlines the Pennsylvania mathematics standards for grade 5. It covers number concepts, computation, estimation, measurement, mathematical reasoning, problem solving, statistics, probability, algebra, geometry, trigonometry, and calculus. Students are expected to apply number patterns, fractions, decimals, place value, and number theory. They also learn to estimate, measure, display and analyze data, solve word problems, identify shapes, and describe rates of change.
The document discusses linear inequalities in two variables and their graphical representations. It introduces the Cartesian coordinate system developed by Rene Descartes and its importance. It explains how to graph linear inequalities by first drawing the line as an equation, then determining whether to shade above or below the line based on whether a test point satisfies the inequality. Students are assigned to bring graphing paper, coloring materials, and a ruler to class on Monday to graph linear inequalities.
Solving ONE’S interval linear assignment problemIJERA Editor
This document presents a new method called the Matrix Ones Interval Linear Assignment Method (MOILA) for solving assignment problems with interval costs. It begins with definitions of assignment problems and interval analysis concepts. Then it describes the existing Hungarian method and provides an example solved using both Hungarian and MOILA. MOILA involves creating ones in the assignment matrix and making assignments based on the ones. The document outlines algorithms for MOILA as well as extensions to unbalanced and interval assignment problems. It provides an example of applying MOILA to solve a balanced interval assignment problem and compares the solutions to Hungarian. The document introduces MOILA as a systematic alternative to Hungarian for solving a variety of assignment problem types.
Correspondence analysis (CA) or reciprocal averaging is a multivariate statistical technique proposed by Hirschfeld and later developed by Jean-Paul Benzécri. It is conceptually similar to principal component analysis, but applies to categorical rather than continuous data. In a similar manner to principal component analysis, it provides a means of displaying or summarising a set of data in two-dimensional graphical form.
matrices
The beginnings of matrices goes back to the second century BC although traces can be seen back to the fourth century BC. However it was not until near the end of the 17th Century that the ideas reappeared and development really got underway.
It is not surprising that the beginnings of matrices and determinants should arise through the study of systems of linear equations. The Babylonians studied problems which lead to simultaneous linear equations and some of these are preserved in clay tablets which survive.
Matrix and its applications by mohammad imranMohammad Imran
This document provides an overview of matrix mathematics concepts. It discusses how matrices are useful in engineering calculations for storing values, solving systems of equations, and coordinate transformations. The outline then reviews properties of matrices and covers various matrix operations like addition, multiplication, and transposition. It also defines different types of matrices and discusses determining the rank, inverse, eigenvalues and eigenvectors of matrices. Key matrix algebra topics like solving systems of equations and putting matrices in normal form are summarized.
A matrix is a rectangular array of numbers arranged in rows and columns. The dimensions of a matrix are written as the number of rows x the number of columns. Each individual entry in the matrix is named by its position, using the matrix name and row and column numbers. Matrices can represent systems of equations or points in a plane. Operations on matrices include addition, multiplication by scalars, and dilation of points represented by matrices.
This document provides an overview of matrices and matrix operations. It begins by stating the objectives of understanding matrix characteristics, applying basic matrix operations, knowing inverse matrices up to 3x3, and solving simultaneous linear equations up to 3 variables. It then defines what a matrix is, discusses matrix dimensions and types of matrices. The document outlines various matrix operations including addition, subtraction, multiplication and scalar multiplication. It provides examples of how to perform these operations. It also covers the transpose of a matrix and inverse matrices.
This document outlines assessments for a unit on quadratic functions that takes a real-world approach. It will include individual and group assignments, such as creating a quadratic function based on survey data and determining the optimal price for maximizing revenue. Formative assessments include online quizzes and math programs. Summative assessments involve traditional tests as well as presenting findings from a group performance task. The unit aims to help students understand and apply key features of quadratic functions.
A SYSTEM FOR VISUALIZATION OF BIG ATTRIBUTED HIERARCHICAL GRAPHSIJCNCJournal
Information visualization is a process of transformation of large and complex abstract forms of information
into the visual forms, strengthening cognitive abilities of users and allowing them to take the most optimal
decisions. A graph is an abstract structure that is widely used to model complex information for its
visualization. In the paper, we consider a system aimed at supporting of visualization of big amounts of
complex information on the base of attributed hierarchical graphs.
The document discusses matrices and their applications. Matrices can represent relationships between data elements and are used in models of communication networks and transportation systems. The document outlines objectives to define matrices and their components, discuss arithmetic operations on matrices, transposes, determinants, inversions, and multiplying matrices. It provides examples of adding and multiplying matrices as well as finding the transpose and determinant of a matrix.
International Journal of Mathematics and Statistics Invention (IJMSI) is an international journal intended for professionals and researchers in all fields of computer science and electronics. IJMSI publishes research articles and reviews within the whole field Mathematics and Statistics, new teaching methods, assessment, validation and the impact of new technologies and it will continue to provide information on the latest trends and developments in this ever-expanding subject. The publications of papers are selected through double peer reviewed to ensure originality, relevance, and readability. The articles published in our journal can be accessed online.
Adding and subtracting matrices unit 3, lesson 2holmsted
To add or subtract matrices, they must have the same dimensions. When adding, corresponding entries are added, while when subtracting, negatives are subtracted correctly. Algebraic expressions within matrices can also be added or subtracted provided the matrices have matching dimensions, otherwise the result is undefined.
The document discusses matrices and their types and applications. It defines a matrix as a rectangular arrangement of numbers, expressions or symbols arranged in rows and columns. It describes 10 different types of matrices including row, column, square, null, identity, diagonal, scalar, transpose, symmetric and equal matrices. It also discusses three algebraic operations on matrices: addition, subtraction and multiplication. Finally, it provides examples of how matrices are used in economics to calculate costs of production, in geology for seismic surveys, and in robotics and automation to program robot movements.
This year's 8th grade math curriculum will cover the number system, expressions and equations, functions, geometry, and statistics and probability. Students will need a 2-inch binder with dividers for warm ups, chapter notes, study guides/tests, and math plus work, as well as a scientific calculator, pencils, and a 2-pocket folder for skills work.
The document discusses the benefits of exercise for mental health. Regular physical activity can help reduce anxiety and depression and improve mood and cognitive function. Exercise causes chemical changes in the brain that may help protect against mental illness and improve symptoms for those who already suffer from conditions like anxiety and depression.
The document discusses changes to Louisiana's standardized tests to better align with the Common Core State Standards. Key points include:
- Math tests will assess only content common to current standards and the CCSS, narrowing the focus areas.
- Some tests will no longer include the Iowa Test of Basic Skills. Grades 4 and 8 tests will be grade-specific rather than grade-span.
- Test difficulty and cut scores will remain the same during the transition period to the CCSS. New CCSS content will not be added until 2014-2015.
This document discusses Common Core Math standards and the progression of number and operations in base ten from kindergarten to fifth grade. It outlines the key objectives for each grade level, including decomposing numbers, place value understanding, and the four operations with multi-digit whole numbers and decimals. The document also describes how the Common Core represents a shift towards developing conceptual understanding, procedural fluency, and engaging students with the mathematical practices.
This document provides an 8th grade math curriculum map for the Isaac School District. The first quarter focuses on comparing and ordering real numbers as well as solving algebraic equations and inequalities. Key concepts covered include classifying rational and irrational numbers, scientific notation, factors and primes, estimating locations on a number line, and writing and graphing linear equations and inequalities to represent real-world situations.
Christmas 2013 8th_grade_semester_exam_study_guide Math Pre-AlgebraTaleese
This study guide covers several topics for a math semester 1 exam, including integers, evaluating expressions, discounts/sales tax, perfect squares/square roots, the Pythagorean theorem, linear functions, systems of equations, and slope. For integers, it provides examples of representing situations with positive and negative numbers and performing operations on integers. For linear functions, it discusses translating between tables, equations, and graphs. It also includes examples of finding missing sides of triangles using the Pythagorean theorem and determining if functions are linear or nonlinear based on situations.
Grade 8 9 1 c marzano rubric florida math connects course 3Taleese
If you make improvements, please email me or leave a comment about it, so we can improve this for all Florida teachers and save some time and effort for everyone.
Grade 8 9 2 c marzano rubric florida math connects course 3Taleese
1) This document provides a teacher version of a math course on converting units of area and volume between customary and metric systems.
2) The learning goal is for students to be able to convert units of area and volume between customary and metric systems by the end of the lesson.
3) The scoring rubric evaluates students on their ability to convert measurements within and between systems of measurement with or without help, including applying these conversions to solve real-life problems.
Grade 8 10 1 b circumference and area of circles rubric marzano course 3 flor...Taleese
This document provides a teacher version of a math course on finding the circumference and area of circles. It outlines the prerequisite content, learning goal, and more complex content. It also provides a detailed scoring rubric assessing a student's understanding of finding the circumference and area of circles from being able to identify circle parts to solving multi-step problems involving circles.
1. Resume el documento que contiene 52 problemas de razonamiento matemático con operadores y expresiones algebraicas. Los problemas incluyen hallar valores, calcular expresiones y determinar secuencias.
2. El documento evalúa diferentes habilidades matemáticas como operaciones básicas, fracciones, exponentes, raíces y funciones.
3. Los problemas van desde operaciones simples hasta expresiones más complejas con múltiples pasos, y requieren aplicar propiedades de los números y operadores para resolverlos.
1) The NJDOE developed a model curriculum aligned to the Common Core State Standards to provide clearer and more rigorous standards, leverage expertise from many states, and allow for continuous improvement.
2) The model curriculum includes learning objectives, instructional strategies, formative assessments, and summative assessments to improve student achievement.
3) School leaders can implement the standards-aligned curriculum and assessment system with fidelity to improve student outcomes by ensuring effective instruction and using data from assessments.
1. El documento presenta problemas de álgebra que involucran simplificar expresiones, factorizar ecuaciones, resolver ecuaciones cuadráticas y desigualdades, y encontrar valores de variables para satisfacer ciertas condiciones. Los problemas cubren temas como exponentes, raíces, ecuaciones de primer y segundo grado, y desigualdades.
This advertisement promotes buying a product now. It does not provide any details about the product itself or its features, benefits, or price. The main message is to purchase the item immediately.
Grade 8 9 2 a convert length, weight mass, capacity time marzano rubric cours...Taleese
This document provides a teacher version of a grade 8 math lesson on converting units of measurement between customary and metric systems for temperature, length, weight/mass, capacity, and time. The learning goal is for students to be able to convert units of measurement between the two systems. The document also includes scoring criteria that assess students' ability to perform direct and indirect conversions with and without conversion tables and help.
This document is a word clue chart that provides words to describe positive and negative integers in financial contexts. It lists words such as earned, spent, saved, cost, deposit, and withdrawal to represent positive integers, and lost, fell, decrease, down, and loss to represent negative integers.
This document outlines a 5-day lesson plan for teaching 8th grade math students about linear functions. The class has 25 students from various backgrounds who will create math booklets, YouTube videos, podcasts, and games to demonstrate their understanding of solving, interpreting, and graphing linear functions with 95% accuracy. Each day focuses on a different interactive activity using various technologies to engage students in applying their knowledge of linear functions.
The document provides information about a math course for grade 8 students on solving literal equations. It outlines the learning goal of being able to solve literal equations for a specified variable. It also includes descriptions of different score levels that demonstrate varying levels of understanding and ability in solving literal equations, from being able to solve complex multi-step problems independently to not knowing where to begin.
The document reviews exponents and exponential notation. It defines the base as the starting number being used to an exponent, and the exponent as the number of times the base is used as a factor. It then provides rules for multiplying, dividing, and raising exponential expressions to a power:
- When multiplying expressions with the same base, add the exponents
- When dividing expressions with the same base, subtract the exponents
- When raising an expression to a power, multiply the exponents
It also notes that any number to the zero power equals one, and negative exponents represent the reciprocal of the base number rather than making the expression negative.
Singapore GCE O Level Mathematics SyllabusDavid Yeng
The Singapore Mathematics is the world's best, adopted by thousands of schools around the world. It has been verified to be 2 years ahead of UK and US standards. However, it is also aligned to the UK system. Thus, you can be assured that when you use the Singapore Mathematics syllabus, your students will be more than prepared for the IGCSE!
A level further mathematics zimsec syllabus cambridge zimbabweAlpro
This document provides information about the Zimbabwe School Examinations Council (ZIMSEC) Advanced Level Further Mathematics syllabus for 2013-2017. It outlines the aims, assessment objectives, and scheme of assessment. The examination will consist of two equally-weighted 3-hour papers covering pure mathematics and mechanics/statistics. Paper 1 covers topics in pure mathematics, while Paper 2 covers mechanics and statistics topics. The curriculum objectives covered in each paper are also summarized.
The document describes an artifact analyzing quadratic function transformations using Ti-Nspire software, noting how varying the coefficients a, b, and c affects the graph by changing the slope, translating the parabola, or moving it up and down. Students observed the behavior of the graphs under different transformations and noticed that the roots remained at 3 and 5 regardless of the transformations.
Chapter6Chapter Guides.pdfIBM SPSS for Introductory Sta.docxtiffanyd4
Chapter6/Chapter Guides.pdf
IBM SPSS for Introductory Statistics: Use and Interpretation, 5th Ed. (Morgan, Leech, Gloeckner & Barrett) Instructor's Manual by Gene W.
Gloeckner and Don Quick
Chapter 6 – Selecting and Interpreting Inferential Statistics
Study Guide
OBJECTIVES:
The student will be able to:
1. Identify the general design classification for difference research questions.
2. Explain the distinctions of within subjects design versus between groups design
classifications.
3. Utilize a decision tree (Figure 6.1) to guide the selection of appropriate inferential
statistics (Tables 6.1-6.4).
a. Identify the research problem.
b. Identify the variables and their level of measurement.
c. Select appropriate inferential statistic.
4. Describe the relationship between difference and associational inferential statistics as a
function of the general linear model.
5. Interpret the results of a statistical test.
a. Determine whether to reject the null hypothesis.
b. Determine the direction of the effect.
c. Evaluate the size of the effect.
6. Discuss the relationship between statistical significance and practical significance.
TERMINOLOGY:
• variables
• levels of measurement
• descriptive statistics
• inferential statistics
o difference inferential statistics
o associational inferential statistics
• difference question designs
• between group designs
• within subjects design (repeated measures design)
• single factor designs
• between groups factorial designs
• mixed factorial designs
• basic (bivariate) statistics
o phi or Cramer’s V
o eta
o Pearson product moment correlation
o Kendall’s tau or Spearman rho
• complex statistics
o factorial ANOVA
o multiple regression
o discriminant analysis
o logistic regression
IBM SPSS for Introductory Statistics: Use and Interpretation, 5th Ed. (Morgan, Leech, Gloeckner & Barrett) Instructor's Manual by Gene W.
Gloeckner and Don Quick
o MANOVA
o ANCOVA
• loglinear
• general linear model
• statistical significance
o critical value
o calculated value
o statistically significant
o Sig.
• practical significance
• effect size
o r family of effect size measures
o d family of effect size measures
• confidence intervals
ASSIGNMENTS: See additional activities and extra SPSS problems for assignment examples.
Chapter6/Chapter Outlines.pdf
IBM SPSS for Introductory Statistics: Use and Interpretation, 5th Ed. (Morgan, Leech, Gloeckner & Barrett) Instructor's Manual by
Gene W. Gloeckner and Don Quick
Chapter 6 – Selecting and Interpreting Statistics
Chapter Outline
I. General Design Classifications for Difference Questions
A. Labeling difference question designs.
1. State overall type of design (e.g. between groups, within
subjects).
2. State the number of independent variables.
3. State the number of levels within each independent variable.
B. Between groups designs: each participant in the research.
This document provides the Texas Essential Knowledge and Skills (TEKS) for mathematics in middle school (grades 6-8). It outlines the key concepts and skills students should master in each grade level, including number operations, algebraic thinking, geometry, measurement, probability, statistics, and problem solving. The TEKS ensure students build foundational math understanding and make connections within and outside of mathematics.
This document provides guidance on students' learning progress in mathematics for Form 3 in Malaysia. It outlines 10 aims and objectives for the mathematics curriculum, including developing students' ability to think mathematically and apply math knowledge to solve problems. It then describes 6 performance bands related to mastering basic knowledge, skills, problem-solving abilities, and applying math creatively. Finally, it gives descriptors for each topic covered in Form 3 math, such as shapes and space, relationships, and the skills expected at each band level.
Assignment 1case study 6.1.jpgAssignment 1case study 6.1-1.docxdeanmtaylor1545
Assignment 1/case study 6.1.jpg
Assignment 1/case study 6.1-1.jpg
Assignment 1/case study 6.1-2.jpg
Assignment 1/case study 6.1-3.jpg
Assignment 1/case study 6.1-4.jpg
Chapter6/Chapter Guides.pdf
IBM SPSS for Introductory Statistics: Use and Interpretation, 5th Ed. (Morgan, Leech, Gloeckner & Barrett) Instructor's Manual by Gene W.
Gloeckner and Don Quick
Chapter 6 – Selecting and Interpreting Inferential Statistics
Study Guide
OBJECTIVES:
The student will be able to:
1. Identify the general design classification for difference research questions.
2. Explain the distinctions of within subjects design versus between groups design
classifications.
3. Utilize a decision tree (Figure 6.1) to guide the selection of appropriate inferential
statistics (Tables 6.1-6.4).
a. Identify the research problem.
b. Identify the variables and their level of measurement.
c. Select appropriate inferential statistic.
4. Describe the relationship between difference and associational inferential statistics as a
function of the general linear model.
5. Interpret the results of a statistical test.
a. Determine whether to reject the null hypothesis.
b. Determine the direction of the effect.
c. Evaluate the size of the effect.
6. Discuss the relationship between statistical significance and practical significance.
TERMINOLOGY:
• variables
• levels of measurement
• descriptive statistics
• inferential statistics
o difference inferential statistics
o associational inferential statistics
• difference question designs
• between group designs
• within subjects design (repeated measures design)
• single factor designs
• between groups factorial designs
• mixed factorial designs
• basic (bivariate) statistics
o phi or Cramer’s V
o eta
o Pearson product moment correlation
o Kendall’s tau or Spearman rho
• complex statistics
o factorial ANOVA
o multiple regression
o discriminant analysis
o logistic regression
IBM SPSS for Introductory Statistics: Use and Interpretation, 5th Ed. (Morgan, Leech, Gloeckner & Barrett) Instructor's Manual by Gene W.
Gloeckner and Don Quick
o MANOVA
o ANCOVA
• loglinear
• general linear model
• statistical significance
o critical value
o calculated value
o statistically significant
o Sig.
• practical significance
• effect size
o r family of effect size measures
o d family of effect size measures
• confidence intervals
ASSIGNMENTS: See additional activities and extra SPSS problems for assignment examples.
Chapter6/Chapter Outlines.pdf
IBM SPSS for Introductory Statistics: Use and Interpretation, 5th Ed. (Morgan, Leech, Gloeckner & Barrett) Instructor's Manual by
Gene W. Gloeckner and Don Quick
Chapter 6 – Selecting and Interpreting Statistics
Chapter Outline
I. General Design Classifications for Difference Questions
A. Labeling difference question designs.
1. State overall type of design (e.g. between groups, within
subjects). .
Igcse international mathematics extended standardsRoss
This document outlines the aims, assessment objectives, and curriculum content for the IGCSE International Mathematics exam. The aims focus on developing mathematical skills and applying them to other subjects and real-world problems. The assessment objectives evaluate students' ability to apply mathematical concepts, solve problems, recognize patterns, draw conclusions, and communicate mathematically. The curriculum content covers topics in number, algebra, functions, and geometry including operations, equations, graphs, sequences, trigonometry, and geometric shapes and their properties.
COURSE SYLLABUS IN MATHEMATICS 7 2024.docxreboy_arroyo
The document provides a course syllabus for 7th grade mathematics at the College of St. John - Roxas. It outlines the course objectives, core learning standards, units to be covered each quarter, and performance standards and learning competencies for each unit. The course aims to develop students' understanding and application of key mathematical concepts like numbers, measurement, patterns and algebra, geometry, and statistics. It will teach students to solve problems, think critically, communicate, and make real-world connections using appropriate technologies. The syllabus was prepared by the mathematics teacher, Mr. Jomari Kent D. Arroyo.
This two semester algebra 1 course covers linear, quadratic, and other foundational algebraic concepts. Students will learn to perform operations with real numbers, simplify expressions, graph and solve equations and inequalities, work with functions and polynomials, and apply algebraic skills to probability and data problems. Assessment is based on completing homework, projects for each unit, and passing unit tests with a proficiency of 70% or higher. The course addresses state standards for algebra 1.
Mc0079 computer based optimization methods--phpapp02Rabby Bhatt
This document discusses mathematical models and provides examples of different types of mathematical models. It begins by defining a mathematical model as a description of a system using mathematical concepts and language. It then classifies mathematical models in several ways, such as linear vs nonlinear, deterministic vs probabilistic, static vs dynamic, discrete vs continuous, and deductive vs inductive vs floating. The document provides examples and explanations of each type of model. It also discusses using finite queuing tables to analyze queuing systems with a finite population size. In summary, the document outlines different ways to classify mathematical models and provides examples of applying various types of models.
Graphs are used to visually represent data and relationships between variables. There are various types of graphs that can be used for different purposes. Histograms represent the distribution of continuous variables. Bar graphs display the distribution of categorical variables or allow for comparisons between categories. Line graphs show trends and patterns over time. Pie charts summarize categorical data as percentages of a whole. Cubic graphs refer to graphs where all vertices have a degree of three. Response surface plots visualize the relationship between multiple independent variables and a response variable.
CO for stat and probability-2023-Copy.docxMaricel859069
The document outlines a lesson plan for teaching statistics and probability concepts related to correlation and regression analysis. The objectives are to understand key concepts of correlation and regression analyses and perform these analyses on real-life problems. The lesson content focuses on calculating the slope and y-intercept of the regression line. Learning activities include group work to practice identifying slope and y-intercept from regression equations and using formulas to calculate them from data sets. Formative assessments evaluate students' understanding of regression analysis concepts and their ability to apply the skills learned.
This document provides information about graphs, including their definition, purpose, types, and guidelines for creating effective graphs. A graph is a visual representation of the relationship between two variables plotted on x and y axes. Good graphs accurately portray data in a clear, simple manner to help readers understand relationships and trends. Common graph types include bar graphs, pie charts, pictographs, and line graphs, each suited for certain types of data. Guidelines for graphing include understanding the audience and message, and experimenting with different graph styles to pick the most appropriate one.
This document provides an overview of the Grade 8 Mathematics Assessment for the Texas Essential Knowledge and Skills (TEKS) student curriculum. It is divided into 5 reporting categories covering various mathematics concepts. Each category lists the associated TEKS standards describing what students are expected to learn and be assessed on. These include topics like numbers and operations, patterns and algebra, geometry, measurement, probability, and statistics. Underlying processes and mathematical tools are also covered that apply to solving problems across various disciplines.
The Application of the Combination of Number and Shape in the Process of Math...Dr. Amarjeet Singh
This document discusses the application of combining numbers and shapes in mathematics learning. It explains that combining the abstract with the visual can help simplify complex problems. The combination of numbers and shapes is useful in equations/inequalities, analytic geometry, and linear programming. It allows algebraic problems to be represented geometrically and vice versa. Specific examples are provided for each area to illustrate how the combination of numbers and shapes can help solve problems and develop flexible thinking skills.
This document contains a yearly lesson plan for mathematics for Form 1 students in the year 2024/2025 at SMK Datuk Bendahara. It outlines 15 weeks of topics to be covered from Chapters 1 to 5, including rational numbers, factors and multiples, squares and square roots, ratios and proportions, and algebraic expressions. Each week covers 1-2 learning standards and suggests activities. The plan aims to help students understand key mathematical concepts through exploration and problem solving.
Students use mathematical models to represent and explore geometric concepts. They construct models using toothpicks and marshmallows to represent two- and three-dimensional shapes. Students then use their models to investigate properties of shapes such as sides, angles, faces, edges, vertices, congruence, similarity, and transformations. They also explore using models to represent mathematical relationships and formulas for calculating perimeter and area.
Algebra 2 Standards Math Draft August 2016.pdfssuserbdee04
The document provides an overview and standards for an Algebra 2 course. It includes 4 sections:
1) An overview of the critical areas of instruction including extending real numbers to complex numbers, solving various equations, analyzing different function types, and conditional probability.
2) Standards for number and quantity, algebra, functions, and statistics/probability.
3) Detailed explanations of the 4 critical areas covering complex numbers, various equation types, diverse function families/models, and conditional probability.
4) Specific mathematics standards within each domain covering topics like complex numbers, polynomials, equations, functions, and data analysis.
This document discusses stem-and-leaf diagrams, line charts, and scatter diagrams. It provides examples and steps for constructing each type of graph. Stem-and-leaf diagrams display and order numerical data using digits in the tens and ones places. Line charts show the relationship between two quantitative variables over time. Scatter diagrams plot the relationship between two quantitative variables to determine if they are correlated. Examples and steps are given for accurately constructing each graph.
Similar to Learning goals ngsss math course 3 (20)
The document discusses the benefits of exercise for mental health. Regular physical activity can help reduce anxiety and depression and improve mood and cognitive functioning. Exercise causes chemical changes in the brain that may help boost feelings of calmness, happiness and focus.
Grade 8 10 1 b circumference and area of circles rubric marzano course 3 flor...Taleese
This document provides a teacher version of a math course on finding the circumference and area of circles. It outlines the prerequisite content, learning goal, and more complex content. It also provides a detailed scoring rubric assessing a student's understanding of finding the circumference and area of circles from being able to identify circle parts to solving multi-step problems involving circles.
Grade 8 9 2 b convert rates marzano rubric course 3 florida math connectsTaleese
This document provides information about a grade 8 math course on converting rates. The learning goal is for students to be able to convert rates using dimensional analysis. More complex content includes using derived units to solve real-world problems and using measurements to find area and volume. The document also describes performance levels for converting between measurement systems.
Grade 8 course 3 9 1 b Convert Temperatures marzano rubric florida math connectsTaleese
This document provides a scoring rubric for assessing student understanding of converting temperatures between the Fahrenheit and Celsius scales. It outlines six levels of achievement from 0.0 to 4.0, describing the skills and understanding demonstrated at each level. The highest level (4.0) involves inferring relationships between the scales beyond what was taught. A 3.0 level performance means students can correctly solve conversion problems using the appropriate formula without help. Lower scores involve needing more assistance or having gaps in skills and comprehension. The goal of the lesson is for students to be able to convert temperatures between the two scales.
7th grade reading and math fcat 2.0 family nightTaleese
This document provides information about the 7th grade FCAT Reading and Math tests, including test format, content, sample questions, and preparation tips. The Reading test consists of two 70-minute sessions with 50-55 multiple choice questions each. The Math test also has two 70-minute sessions and includes multiple choice and gridded response questions testing categories like geometry, ratios, and statistics. Sample questions target skills like comparing/contrasting, cause/effect, and summarizing. Tips are provided for successful test taking and preparation.
The document discusses the benefits of exercise for mental health. Regular physical activity can help reduce anxiety and depression and improve mood and cognitive function. Exercise causes chemical changes in the brain that may help protect against mental illness and improve symptoms.
The document discusses the benefits of exercise for mental health. Regular physical activity can help reduce anxiety and depression and improve mood and cognitive functioning. Exercise causes chemical changes in the brain that may help protect against mental illness and improve symptoms for those who already suffer from conditions like anxiety and depression.
The St. Lucie County School Board is presenting a "Giving Concert" on November 10, 2011 at 6 PM at the Lincoln Park Academy Auditorium. The concert will feature choruses from six schools and all proceeds will benefit local food banks. Admission is either a non-perishable food item or a cash donation.
The document discusses the benefits of exercise for mental health. Regular physical activity can help reduce anxiety and depression and improve mood and cognitive functioning. Exercise causes chemical changes in the brain that may help protect against mental illness and improve symptoms.
The document discusses the benefits of exercise for mental health. Regular physical activity can help reduce anxiety and depression and improve mood and cognitive functioning. Exercise boosts blood flow and levels of neurotransmitters and endorphins which elevate and stabilize mood.
CapTechTalks Webinar Slides June 2024 Donovan Wright.pptxCapitolTechU
Slides from a Capitol Technology University webinar held June 20, 2024. The webinar featured Dr. Donovan Wright, presenting on the Department of Defense Digital Transformation.
THE SACRIFICE HOW PRO-PALESTINE PROTESTS STUDENTS ARE SACRIFICING TO CHANGE T...indexPub
The recent surge in pro-Palestine student activism has prompted significant responses from universities, ranging from negotiations and divestment commitments to increased transparency about investments in companies supporting the war on Gaza. This activism has led to the cessation of student encampments but also highlighted the substantial sacrifices made by students, including academic disruptions and personal risks. The primary drivers of these protests are poor university administration, lack of transparency, and inadequate communication between officials and students. This study examines the profound emotional, psychological, and professional impacts on students engaged in pro-Palestine protests, focusing on Generation Z's (Gen-Z) activism dynamics. This paper explores the significant sacrifices made by these students and even the professors supporting the pro-Palestine movement, with a focus on recent global movements. Through an in-depth analysis of printed and electronic media, the study examines the impacts of these sacrifices on the academic and personal lives of those involved. The paper highlights examples from various universities, demonstrating student activism's long-term and short-term effects, including disciplinary actions, social backlash, and career implications. The researchers also explore the broader implications of student sacrifices. The findings reveal that these sacrifices are driven by a profound commitment to justice and human rights, and are influenced by the increasing availability of information, peer interactions, and personal convictions. The study also discusses the broader implications of this activism, comparing it to historical precedents and assessing its potential to influence policy and public opinion. The emotional and psychological toll on student activists is significant, but their sense of purpose and community support mitigates some of these challenges. However, the researchers call for acknowledging the broader Impact of these sacrifices on the future global movement of FreePalestine.
Gender and Mental Health - Counselling and Family Therapy Applications and In...PsychoTech Services
A proprietary approach developed by bringing together the best of learning theories from Psychology, design principles from the world of visualization, and pedagogical methods from over a decade of training experience, that enables you to: Learn better, faster!
Andreas Schleicher presents PISA 2022 Volume III - Creative Thinking - 18 Jun...EduSkills OECD
Andreas Schleicher, Director of Education and Skills at the OECD presents at the launch of PISA 2022 Volume III - Creative Minds, Creative Schools on 18 June 2024.
Andreas Schleicher presents PISA 2022 Volume III - Creative Thinking - 18 Jun...
Learning goals ngsss math course 3
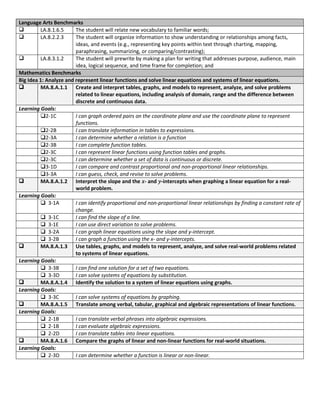
1. Language Arts BenchmarksLA.8.1.6.5The student will relate new vocabulary to familiar words;LA.8.2.2.3The student will organize information to show understanding or relationships among facts, ideas, and events (e.g., representing key points within text through charting, mapping, paraphrasing, summarizing, or comparing/contrasting);LA.8.3.1.2The student will prewrite by making a plan for writing that addresses purpose, audience, main idea, logical sequence, and time frame for completion; andMathematics BenchmarksBig Idea 1: Analyze and represent linear functions and solve linear equations and systems of linear equations.MA.8.A.1.1 Create and interpret tables, graphs, and models to represent, analyze, and solve problems related to linear equations, including analysis of domain, range and the difference between discrete and continuous data.Learning Goals: 2-1CI can graph ordered pairs on the coordinate plane and use the coordinate plane to represent functions. 2-2BI can translate information in tables to expressions. 2-3AI can determine whether a relation is a function 2-3BI can complete function tables. 2-3CI can represent linear functions using function tables and graphs. 2-3CI can determine whether a set of data is continuous or discrete. 3-1DI can compare and contrast proportional and non-proportional linear relationships. 3-3AI can guess, check, and revise to solve problems.MA.8.A.1.2Interpret the slope and the 𝑥- and 𝑦-intercepts when graphing a linear equation for a real-world problem.Learning Goals: 3-1AI can identify proportional and non-proportional linear relationships by finding a constant rate of change. 3-1CI can find the slope of a line. 3-1EI can use direct variation to solve problems. 3-2AI can graph linear equations using the slope and y-intercept. 3-2BI can graph a function using the x- and y-intercepts.MA.8.A.1.3Use tables, graphs, and models to represent, analyze, and solve real-world problems related to systems of linear equations. Learning Goals: 3-3BI can find one solution for a set of two equations. 3-3DI can solve systems of equations by substitution.MA.8.A.1.4Identify the solution to a system of linear equations using graphs.Learning Goals: 3-3CI can solve systems of equations by graphing.MA.8.A.1.5Translate among verbal, tabular, graphical and algebraic representations of linear functions.Learning Goals: 2-1BI can translate verbal phrases into algebraic expressions. 2-1BI can evaluate algebraic expressions. 2-2DI can translate tables into linear equations.MA.8.A.1.6Compare the graphs of linear and non-linear functions for real-world situations.Learning Goals: 2-3DI can determine whether a function is linear or non-linear.<br />Big Idea 2: Analyze two- and three-dimensional figures by using distance and angle.MA.8.G.2.1Use similar triangles to solve problems that include height and distances.Learning Goals: 7-1BI can identify similar polygons and find missing measures of similar polygons. 7-1DI can solve problems involving similar triangles. 7-2EI can graph and analyze slope triangles. 7-2FI can use special right triangles to solve problems.MA.8.G.2.2Classify and determine the measure of angles, including angles created when parallel lines are cut by transversals.Learning Goals: 6-1AI can measure and draw angles. 6-1BI can classify angles and identify vertical and adjacent angles. 6-1CI can identify complementary and supplementary angles and find missing angle measures. 6-2BI can identify relationships of angles formed by two parallel lines cut by a transversal.MA.8.G.2.3Demonstrate that the sum of the angles in a triangle is 180-degrees and apply this fact to find unknown measure of angles, and the sum of angles in polygons.Learning Goals: 6-3BI can find missing angle measures in triangles. 6-3DI can identify and classify quadrilaterals. 6-3EI can find the sum of the angle measures of a polygon and the measure of an interior angle of a regular polygon.MA.8.G.2.4Validate and apply Pythagorean Theorem to find distances in real world situations or between points in the coordinate plane.Learning Goals: 7-2BI can use the Pythagorean Theorem. 7-2CI can solve problems using the Pythagorean Theorem. 7-2DI can find the distance between two points on the coordinate plane.Big Idea 3: Analyze and summarize data sets.MA.8.S.3.1Select, organize and construct appropriate data displays, including box and whisker plots, scatter plots, and lines of best fit to convey information and make conjectures about possible relationships.Learning Goals: 8-2AI can find the measures of variation of a set of data. 8-2BI can display and interpret data in a box-and-whisker plot. 8-2CI can compare data in box-and-whisker plots. 8-3CI can construct and make conjectures about scatter plots. 8-3DI can draw lines of best fit and use them to make predictions about data. 8-3GI can select an appropriate display for a set of data.MA.8.S.3.2Determine and describe how changes in data values impact measures of central tendency.Learning Goals: 8-1AI can find the mean, median, and mode of a set of data. 8-1CI can determine and describe how changes in data values impact measures of central tendency.Supporting Idea: AlgebraMA.8.A.4.1Solve literal equations for a specified variable.Learning Goals: 9-1AI can solve literal equations for indicated variable.MA.8.A.4.2Solve and graph one- and two-step inequalities in one variable.Learning Goals: 4-1BI can write algebraic equations from verbal sentences and problem situations. 4-1CI can solve equations using the addition or subtraction properties of equality. 4-1DI can solve equations using the multiplication or division properties of equality. 4-2BI can solve two-step equations. 4-2CI can write two-step equations that represent real-world situations. 4-3AI can write one-step inequalities. 4-3BI can solve and graph one-step inequalities in one variable by using the addition or subtraction properties of inequalities. 4-3CI can solve and graph one-step inequalities in one variable by using the multiplication or division properties of inequalities. 4-4AI can solve and graph two-step inequalities in one variable by using the addition, subtraction, multiplication, or division properties of inequalities.Supporting Idea: Geometry and MeasurementMA.8.G.5.1Compare, contrast, and convert units of measure between different measurement systems (US customary or metric (SI)) and dimensions including temperature, area, volume, and derived units to solve problems.Learning Goals: 9-1BI can convert temperatures between Fahrenheit and Celsius scales. 9-2AI can convert customary and metric units of length, weight or mass, capacity, and time. 9-2BI can convert rates using dimensional analysis. 9-2CI can convert units of area and volume between customary and metric systems.Supporting Idea: Number and Operations MA.8.A.6.1Use exponents and scientific notation to write large and small numbers and vice versa and to solve problems.Learning Goals: 5-1AI can use powers and exponents to write large and small numbers. 5-2BI can use scientific notation to write large and small numbers. 5-2CI can compute numbers written in scientific notation.MA.8.A.6.2Make reasonable approximations of square roots and mathematical expressions that include square roots, and use them to estimate solutions to problems and to compare mathematical expressions involving real numbers and radical expressions.Learning Goals: 5-3BI can estimate square roots of non-perfect squares. 5-3CI can use square roots to estimate solutions. 5-3DI can compare mathematical expressions involving real numbers.MA.8.A.6.3Simplify real number expressions using the laws of exponents.Learning Goals: 5-1BI can simplify real number expressions by multiplying and dividing monomials. 5-1CI can use the law of exponents to find powers of monomials. 5-2AI can write and evaluate expressions using negative exponents.MA.8.A.6.4Perform operations on real numbers (including integer exponents, radicals, percents, scientific notation, absolute value, rational numbers, and irrational numbers) using multi-step and real world problems.Learning Goals: 1-1AI can express rational numbers as decimals and decimals as fractions. 1-1BI can add and subtract rational numbers. 1-1C I can multiply rational numbers. 1-1DI can divide rational numbers. 1-2BI can compare and order rational numbers. 1-2CI can solve problems using the percent proportion and equation. 1-3AI can apply percents to find discount, markup and sales tax. 1-3BI can solve problems involving simple interest. 1-3CI can solve problems involving compound interest. 1-3DI can find and use the percent of increase and decrease. 5-3AI can find square roots of perfect squares.<br />