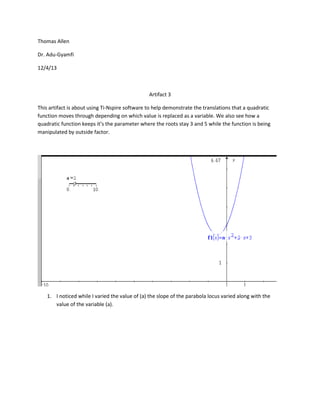
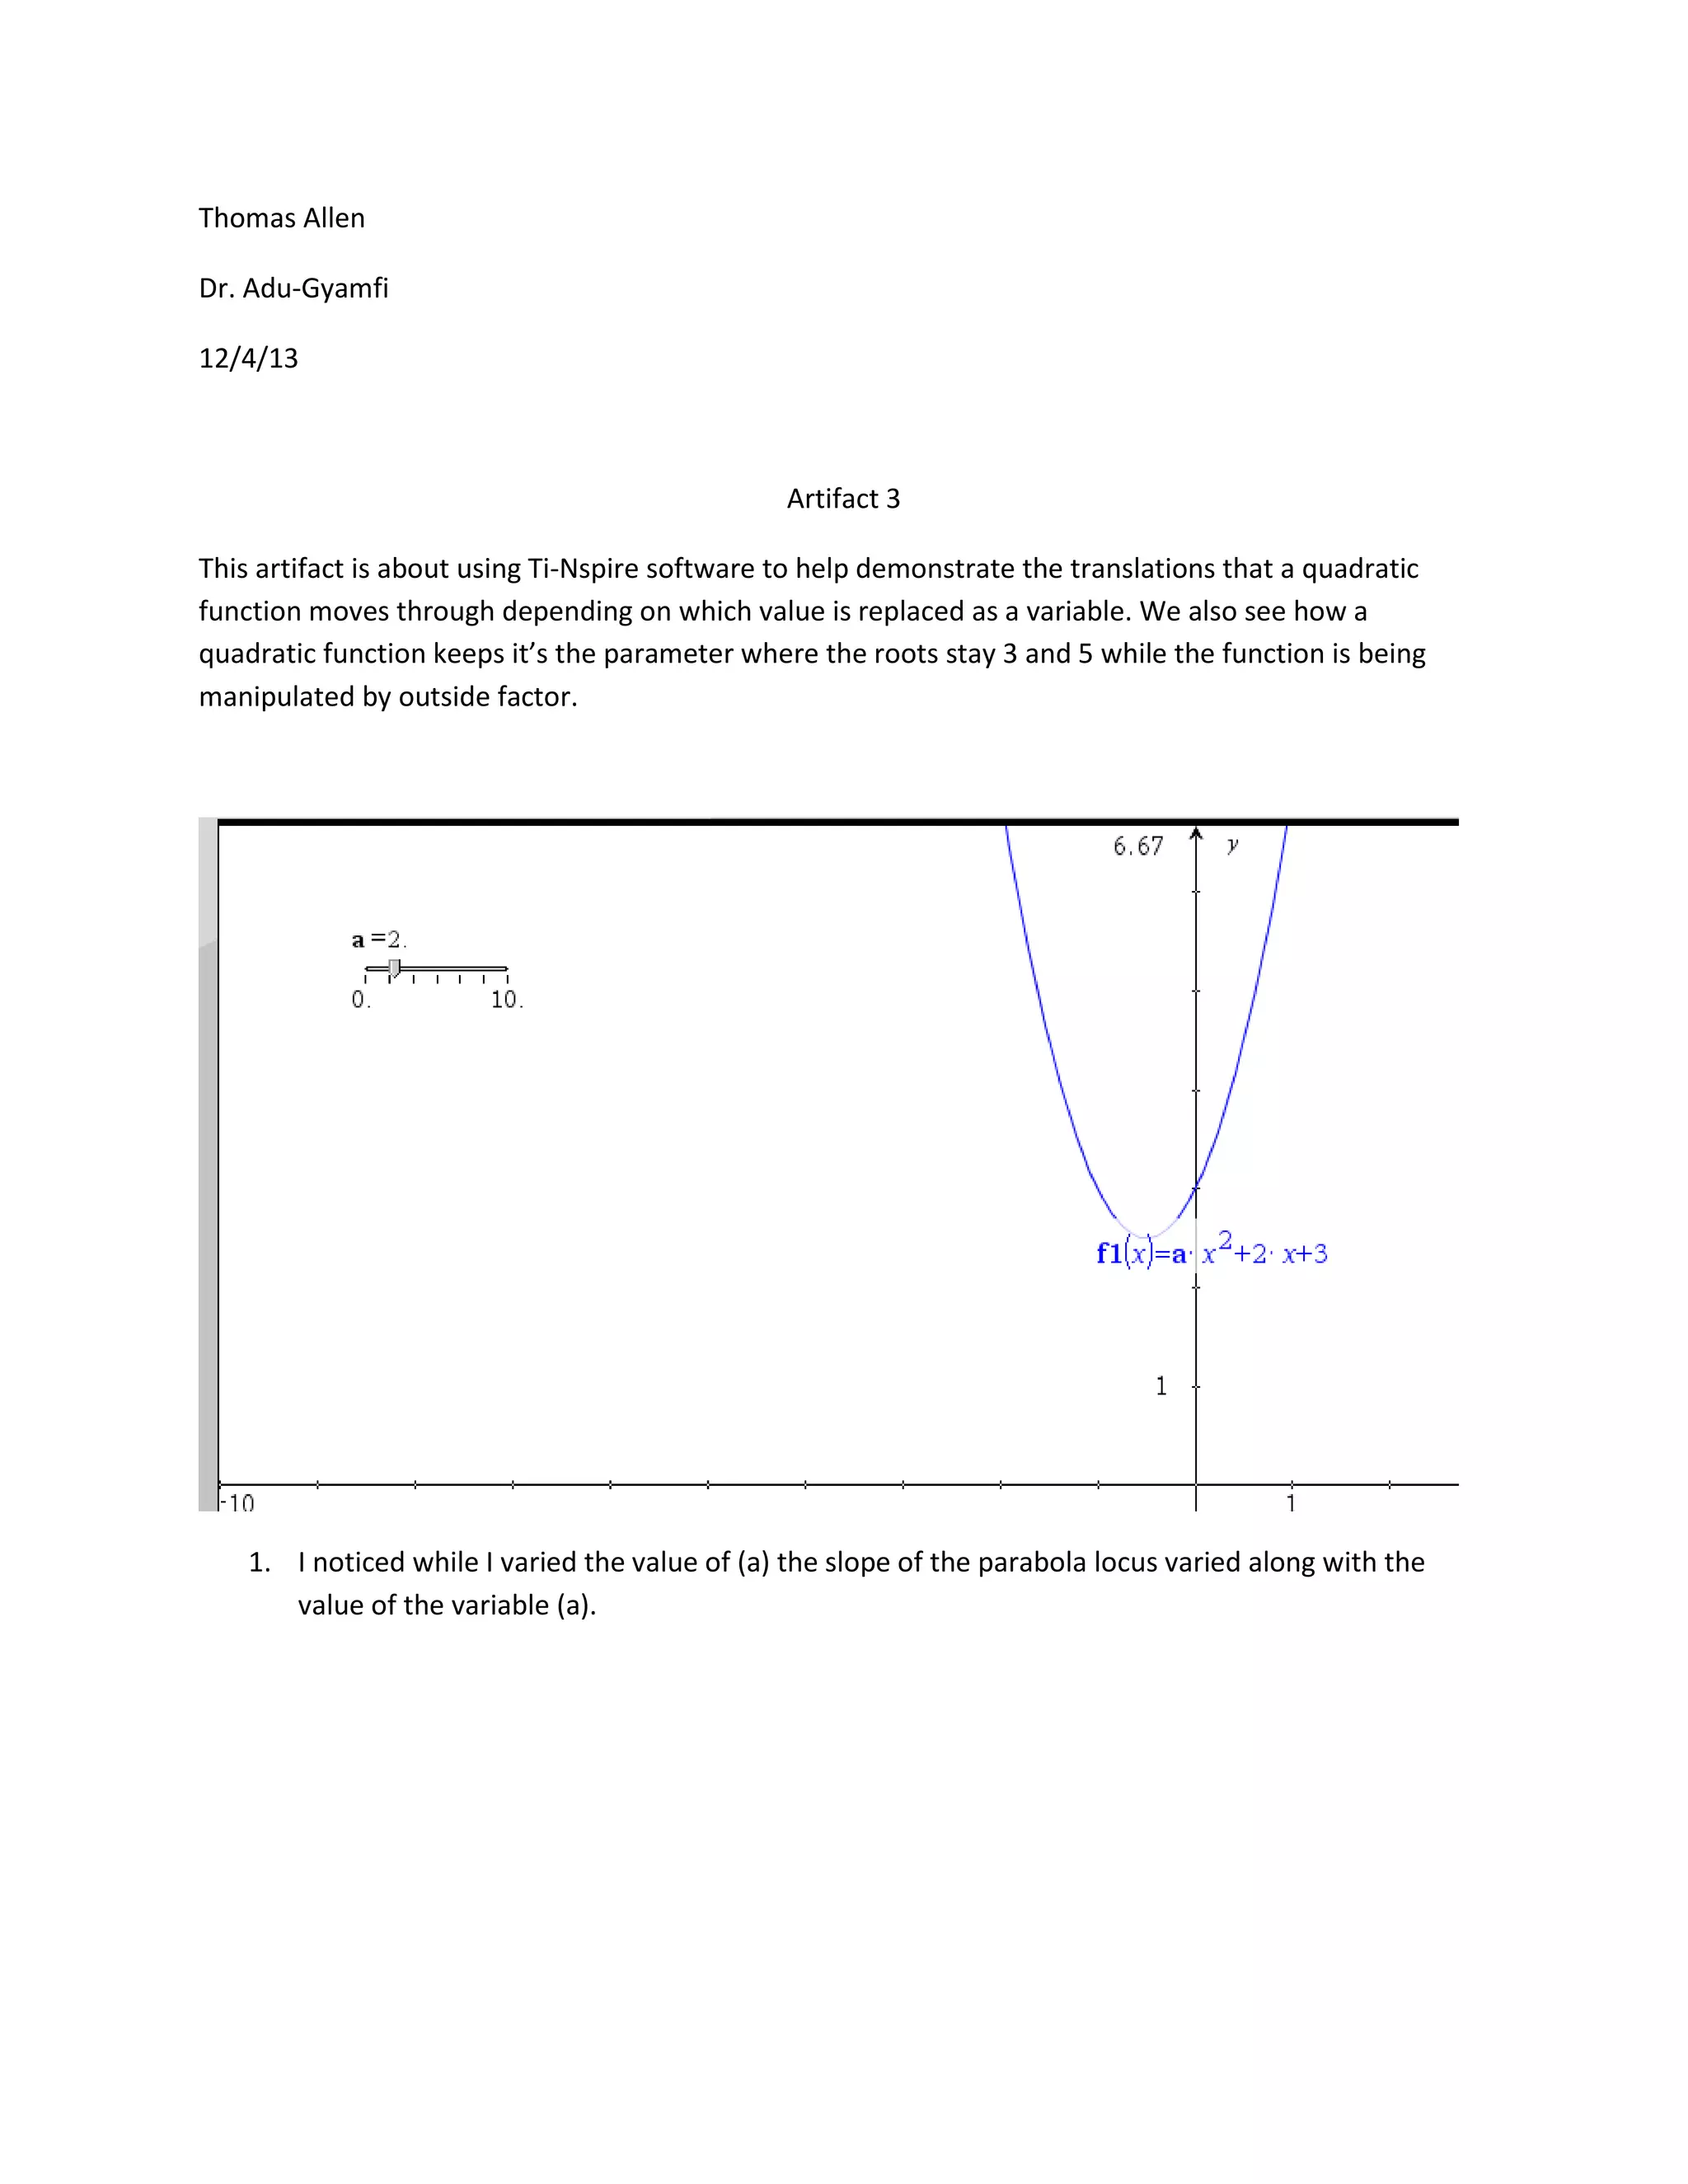
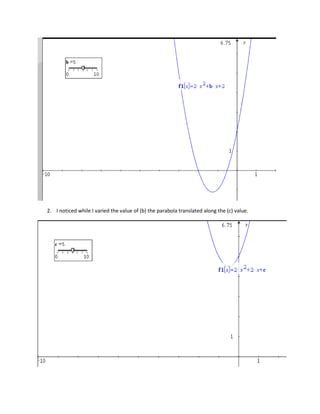
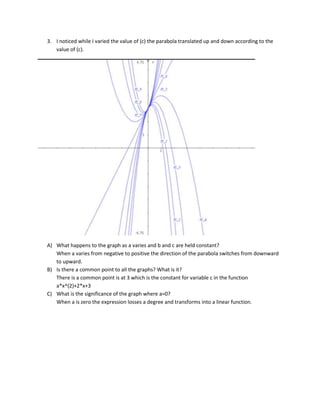
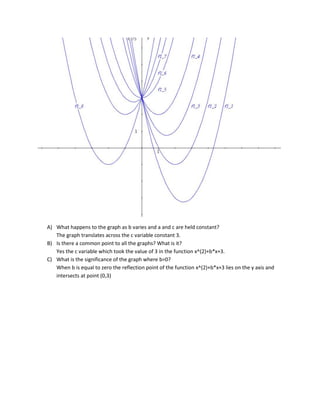
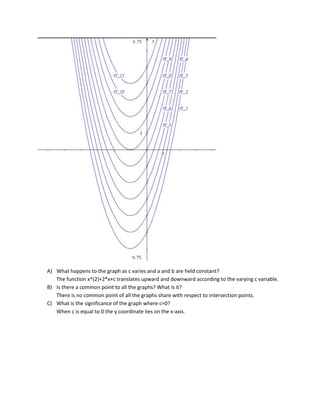
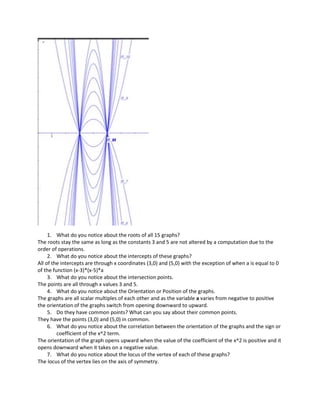
This lesson uses TI-Nspire software to demonstrate quadratic transformations. Students will explore how varying the coefficients a, b, and c affects the graph of the quadratic function. By manipulating sliders to change coefficient values, students can observe the transformations and develop an understanding of each coefficient's impact on the graph. The technology allows students to quickly test conjectures and analyze multiple functions simultaneously. This interactive, exploration-based approach aims to help students discern the relationships between algebraic and graphical representations of quadratics.
Mathematical Modeling for Practical ProblemsLiwei Ren任力偉
Mathematical modeling is an important step for developing many advanced technologies in various domains such as network security, data mining and etc… This lecture introduces a process that the speaker summarizes from his past practice of mathematical modeling and algorithmic solutions in IT industry, as an applied mathematician, algorithm specialist or software engineer , and even as an entrepreneur. A practical problem from DLP system will be used as an example for creating math models and providing algorithmic solutions.
Vectors Preparation Tips for IIT JEE | askIITiansaskiitian
Give your IIT JEE preparation a boost by delving into the world of vectors with the help of preparation tips for IIT JEE offered by askIITians. Read to know more….
Discrete Mathematics is a collection of branches of mathematics that involves discrete elements using algebra and arithmetic. This is a tool being used to improve reasoning and problem-solving capabilities. It involves distinct values; i.e. between any two points, there are several number of points.
Classes without Dependencies - UseR 2018Sam Clifford
Presented by Sam Clifford at the 2018 UseR conference, Brisbane, Australia. The talk describes the design of SEB113 - Quantitative Methods in Science, a first year statistics/mathematics unit in the Bachelor of Science at Queensland University of Technology. The unit uses RStudio and the tidyverse packages to give students the skills to do meaningful data manipulation and analysis without relying on prior knowledge of advanced mathematics.
SubGraD- An Approach for Subgraph Detection cscpconf
A new approach of graph matching is introduced in this paper, which efficiently solves the
problem of graph isomorphism and subgraph isomorphism. In this paper we are introducing a
new approach called SubGraD, for query graph detection in source graph. Firstly consider the model graph (query graph) and make the possible sets called model sets starting from the chosen initial node or starter. Similarly, for the source graph (reference graph), all the possible sets called reference sets could be made. Our aim is to make the reference set on the basis of the model set. If it is possible to make the reference set, then it is said that query graph has been detected in the source graph.
This presentation is aimed at fitting a Simple Linear Regression model in a Python program. IDE used is Spyder. Screenshots from a working example are used for demonstration.
What is Relational model
Characteristics
Relational constraints
Representation of schemas
characteristics and Constraints of Relational model with proper examples.
Updates and dealing with constraint violations in Relational model
Graph Tea: Simulating Tool for Graph Theory & AlgorithmsIJMTST Journal
Simulation in teaching has recently entered the field of education. It is used at different levels of instruction.
The teacher is trained practically and also imparted theoretical learning. In Computer Science, Graph theory
is the fundamental mathematics required for better understanding Data Structures. To Teach Graph theory &
Algorithms, We introduced Simulation as an innovative teaching methodology. Students can understand in a
better manner by using simulation. Graph Tea is one of such simulation tool for Graph Theory & Algorithms.
In this paper, we simulated Tree Traversal Techniques like Breadth First Search (BFS), Depth First Search
(DFS) and minimal cost spanning tree algorithms like Prims.
Calculus is the major part of Mathematis. This theoretical presentation covered all relevant definations and systematic review points about calculus. It also brings and promote you towards in advance mathematics.
Math 012Midterm ExamPage 3Please remember to show all w.docxandreecapon
Math 012
Midterm Exam Page 3
Please remember to show all work on every problem.
1) Solve the equation using the methods discussed in Chapter 2 of our text. If the equation has a unique solution, please show the complete check of your answer.
2) Solve the equation using the methods discussed in Chapter 2 of our text. If the equation has a unique solution, please show the complete check of your answer.
3) Solve the equation using the methods discussed in Chapter 2 of our text. If the equation has a unique solution, please show the complete check of your answer.
4) Solve the inequality using the methods discussed in Chapter 2 of our text. Write your answer in interval notation and graph the solution set on a number line.
5) Solve the inequality using the methods discussed in Chapter 2 of our text. Write your answer in interval notation and graph the solution set on a number line.
6) Solve the inequality using the methods discussed in Chapter 2 of our text. Write your answer in interval notation and graph the solution set on a number line.
7) Solve the inequality using the methods discussed in Chapter 2 of our text. Write your answer in interval notation and graph the solution set on a number line.
8) After Amanda received a 4.5% raise, her new annual salary was $75,240. What was her annual salary before the raise?
9) Patrick wins $900,000 (after taxes) in the lottery and decides to invest half of it in a 5-year CD that pays 6.72% interest compounded quarterly. He invests the other half in a money market fund that unfortunately turns out to average only 2.4% interest compounded annually over the 5-year period. How much money will he have altogether in the two accounts at the end of the 5-year period?
10) The average annual tuition and fees at public 4-year institutions in the US in 2005 was $13,847 and in 2010 was $16,384. Let y be the average tuition and fees in the year x, where x = 0 represents the year 2005.
a) Write a linear equation that models the growth in average tuition and fees at public 4-year institutions in the US in terms of the year x.
b) Use this equation to predict the average tuition and fees at public 4-year institutions in the US in the year 2020.
c) Explain what the slope of this line means in the context of the problem.
11) Given the linear equation :
a) Find both intercepts of the equation. Show all work and state intercepts as ordered pairs.
x-intercept =
y-intercept =
b) Use the intercepts to find the slope of the line. Show all work.
12) Given the following two linear equations, determine whether the lines are parallel, perpendicular, or neither. Show the work that leads to your conclusion.
13) Write an equation of a line through the point (5, -2) that is perpendicular to the y-ax ...
Finding the Extreme Values with some Application of Derivativesijtsrd
There are many different way of mathematics rules. Among them, we express finding the extreme values for the optimization problems that changes in the particle life with the derivatives. The derivative is the exact rate at which one quantity changes with respect to another. And them, we can compute the profit and loss of a process that a company or a system. Variety of optimization problems are solved by using derivatives. There were use derivatives to find the extreme values of functions, to determine and analyze the shape of graphs and to find numerically where a function equals zero. Kyi Sint | Kay Thi Win "Finding the Extreme Values with some Application of Derivatives" Published in International Journal of Trend in Scientific Research and Development (ijtsrd), ISSN: 2456-6470, Volume-3 | Issue-6 , October 2019, URL: https://www.ijtsrd.com/papers/ijtsrd29347.pdf Paper URL: https://www.ijtsrd.com/mathemetics/other/29347/finding-the-extreme-values-with-some-application-of-derivatives/kyi-sint
FAST School of ComputingProject Differential Equations (MTChereCheek752
FAST School of Computing
Project Differential Equations (MT-224)
Due Date: 14th, June 2021. Max Marks: 70
A Brief Literature Review:
We have studied the population growth model i.e., if P represents population. Since the
population varies over time, it is understood to be a function of time. Therefore we use the
notation P (t) for the population as a function of time. If P (t) is a differentiable function,
then the first derivative
dP
dt
represents the instantaneous rate of change of the population
as a function of time, which is proportional to present population in case of the exponential
growth and decay of populations and radioactive substances. Mathematically
dP
dt
∝ P.
We can verify that the function P (t) = P0e
rt satisfies the initial-value problem
dP
dt
= rP, P (0) = P0.
This differential equation has an interesting interpretation. The left-hand side represents
the rate at which the population increases (or decreases). The right-hand side is equal to a
positive constant multiplied by the current population. Therefore the differential equation
states that the rate at which the population increases is proportional to the population at
that point in time. Furthermore, it states that the constant of proportionality never changes.
One problem with this function is its prediction that as time goes on, the population grows
without bound. This is unrealistic in a real-world setting. Various factors limit the rate of
growth of a particular population, including birth rate, death rate, food supply, predators,
diseases and so on. The growth constant r usually takes into consideration the birth and
death rates but none of the other factors, and it can be interpreted as a net (birth minus
death) percent growth rate per unit time. A natural question to ask is whether the population
growth rate stays constant, or whether it changes over time. Biologists have found that in
many biological systems, the population grows until a certain steady-state population is
reached. This possibility is not taken into account with exponential growth. However, the
concept of carrying capacity allows for the possibility that in a given area, only a certain
number of a given organism or animal can thrive without running into resource issues.
• The carrying capacity of an organism in a given environment is defined to be the maxi-
mum population of that organism that the environment can sustain indefinitely.
• We use the variable K to denote the carrying capacity. The growth rate is represented by
the variable r. Using these variables, we can define the logistic differential equation.
dP
dt
= rP
(
1 −
P
K
)
.
1
• An improvement to the logistic model includes a threshold population. The threshold
population is defined to be the minimum population that is necessary for the species
to survive. We use the variable T to represent the threshold population. A differential
equation that incorporates both the threshold population T and carrying capacit ...
UiPath Test Automation using UiPath Test Suite series, part 3DianaGray10
Welcome to UiPath Test Automation using UiPath Test Suite series part 3. In this session, we will cover desktop automation along with UI automation.
Topics covered:
UI automation Introduction,
UI automation Sample
Desktop automation flow
Pradeep Chinnala, Senior Consultant Automation Developer @WonderBotz and UiPath MVP
Deepak Rai, Automation Practice Lead, Boundaryless Group and UiPath MVP
Accelerate your Kubernetes clusters with Varnish CachingThijs Feryn
A presentation about the usage and availability of Varnish on Kubernetes. This talk explores the capabilities of Varnish caching and shows how to use the Varnish Helm chart to deploy it to Kubernetes.
This presentation was delivered at K8SUG Singapore. See https://feryn.eu/presentations/accelerate-your-kubernetes-clusters-with-varnish-caching-k8sug-singapore-28-2024 for more details.
LF Energy Webinar: Electrical Grid Modelling and Simulation Through PowSyBl -...DanBrown980551
Do you want to learn how to model and simulate an electrical network from scratch in under an hour?
Then welcome to this PowSyBl workshop, hosted by Rte, the French Transmission System Operator (TSO)!
During the webinar, you will discover the PowSyBl ecosystem as well as handle and study an electrical network through an interactive Python notebook.
PowSyBl is an open source project hosted by LF Energy, which offers a comprehensive set of features for electrical grid modelling and simulation. Among other advanced features, PowSyBl provides:
- A fully editable and extendable library for grid component modelling;
- Visualization tools to display your network;
- Grid simulation tools, such as power flows, security analyses (with or without remedial actions) and sensitivity analyses;
The framework is mostly written in Java, with a Python binding so that Python developers can access PowSyBl functionalities as well.
What you will learn during the webinar:
- For beginners: discover PowSyBl's functionalities through a quick general presentation and the notebook, without needing any expert coding skills;
- For advanced developers: master the skills to efficiently apply PowSyBl functionalities to your real-world scenarios.
Software Delivery At the Speed of AI: Inflectra Invests In AI-Powered QualityInflectra
In this insightful webinar, Inflectra explores how artificial intelligence (AI) is transforming software development and testing. Discover how AI-powered tools are revolutionizing every stage of the software development lifecycle (SDLC), from design and prototyping to testing, deployment, and monitoring.
Learn about:
• The Future of Testing: How AI is shifting testing towards verification, analysis, and higher-level skills, while reducing repetitive tasks.
• Test Automation: How AI-powered test case generation, optimization, and self-healing tests are making testing more efficient and effective.
• Visual Testing: Explore the emerging capabilities of AI in visual testing and how it's set to revolutionize UI verification.
• Inflectra's AI Solutions: See demonstrations of Inflectra's cutting-edge AI tools like the ChatGPT plugin and Azure Open AI platform, designed to streamline your testing process.
Whether you're a developer, tester, or QA professional, this webinar will give you valuable insights into how AI is shaping the future of software delivery.
Encryption in Microsoft 365 - ExpertsLive Netherlands 2024Albert Hoitingh
In this session I delve into the encryption technology used in Microsoft 365 and Microsoft Purview. Including the concepts of Customer Key and Double Key Encryption.
JMeter webinar - integration with InfluxDB and GrafanaRTTS
Watch this recorded webinar about real-time monitoring of application performance. See how to integrate Apache JMeter, the open-source leader in performance testing, with InfluxDB, the open-source time-series database, and Grafana, the open-source analytics and visualization application.
In this webinar, we will review the benefits of leveraging InfluxDB and Grafana when executing load tests and demonstrate how these tools are used to visualize performance metrics.
Length: 30 minutes
Session Overview
-------------------------------------------
During this webinar, we will cover the following topics while demonstrating the integrations of JMeter, InfluxDB and Grafana:
- What out-of-the-box solutions are available for real-time monitoring JMeter tests?
- What are the benefits of integrating InfluxDB and Grafana into the load testing stack?
- Which features are provided by Grafana?
- Demonstration of InfluxDB and Grafana using a practice web application
To view the webinar recording, go to:
https://www.rttsweb.com/jmeter-integration-webinar
Transcript: Selling digital books in 2024: Insights from industry leaders - T...BookNet Canada
The publishing industry has been selling digital audiobooks and ebooks for over a decade and has found its groove. What’s changed? What has stayed the same? Where do we go from here? Join a group of leading sales peers from across the industry for a conversation about the lessons learned since the popularization of digital books, best practices, digital book supply chain management, and more.
Link to video recording: https://bnctechforum.ca/sessions/selling-digital-books-in-2024-insights-from-industry-leaders/
Presented by BookNet Canada on May 28, 2024, with support from the Department of Canadian Heritage.
Epistemic Interaction - tuning interfaces to provide information for AI supportAlan Dix
Paper presented at SYNERGY workshop at AVI 2024, Genoa, Italy. 3rd June 2024
https://alandix.com/academic/papers/synergy2024-epistemic/
As machine learning integrates deeper into human-computer interactions, the concept of epistemic interaction emerges, aiming to refine these interactions to enhance system adaptability. This approach encourages minor, intentional adjustments in user behaviour to enrich the data available for system learning. This paper introduces epistemic interaction within the context of human-system communication, illustrating how deliberate interaction design can improve system understanding and adaptation. Through concrete examples, we demonstrate the potential of epistemic interaction to significantly advance human-computer interaction by leveraging intuitive human communication strategies to inform system design and functionality, offering a novel pathway for enriching user-system engagements.
Elevating Tactical DDD Patterns Through Object CalisthenicsDorra BARTAGUIZ
After immersing yourself in the blue book and its red counterpart, attending DDD-focused conferences, and applying tactical patterns, you're left with a crucial question: How do I ensure my design is effective? Tactical patterns within Domain-Driven Design (DDD) serve as guiding principles for creating clear and manageable domain models. However, achieving success with these patterns requires additional guidance. Interestingly, we've observed that a set of constraints initially designed for training purposes remarkably aligns with effective pattern implementation, offering a more ‘mechanical’ approach. Let's explore together how Object Calisthenics can elevate the design of your tactical DDD patterns, offering concrete help for those venturing into DDD for the first time!
Generating a custom Ruby SDK for your web service or Rails API using Smithyg2nightmarescribd
Have you ever wanted a Ruby client API to communicate with your web service? Smithy is a protocol-agnostic language for defining services and SDKs. Smithy Ruby is an implementation of Smithy that generates a Ruby SDK using a Smithy model. In this talk, we will explore Smithy and Smithy Ruby to learn how to generate custom feature-rich SDKs that can communicate with any web service, such as a Rails JSON API.
DevOps and Testing slides at DASA ConnectKari Kakkonen
My and Rik Marselis slides at 30.5.2024 DASA Connect conference. We discuss about what is testing, then what is agile testing and finally what is Testing in DevOps. Finally we had lovely workshop with the participants trying to find out different ways to think about quality and testing in different parts of the DevOps infinity loop.
De-mystifying Zero to One: Design Informed Techniques for Greenfield Innovati...
Artifact3 allen
1. Thomas Allen
Dr. Adu-Gyamfi
12/4/13
Artifact 3
This artifact is about using Ti-Nspire software to help demonstrate the translations that a quadratic
function moves through depending on which value is replaced as a variable. We also see how a
quadratic function keeps it’s the parameter where the roots stay 3 and 5 while the function is being
manipulated by outside factor.
1. I noticed while I varied the value of (a) the slope of the parabola locus varied along with the
value of the variable (a).
2. 2. I noticed while I varied the value of (b) the parabola translated along the (c) value.
3. 3. I noticed while I varied the value of (c) the parabola translated up and down according to the
value of (c).
A) What happens to the graph as a varies and b and c are held constant?
When a varies from negative to positive the direction of the parabola switches from downward
to upward.
B) Is there a common point to all the graphs? What is it?
There is a common point is at 3 which is the constant for variable c in the function
a*x^(2)+2*x+3
C) What is the significance of the graph where a=0?
When a is zero the expression losses a degree and transforms into a linear function.
4. A) What happens to the graph as b varies and a and c are held constant?
The graph translates across the c variable constant 3.
B) Is there a common point to all the graphs? What is it?
Yes the c variable which took the value of 3 in the function x^(2)+b*x+3.
C) What is the significance of the graph where b=0?
When b is equal to zero the reflection point of the function x^(2)+b*x+3 lies on the y axis and
intersects at point (0,3)
5. A) What happens to the graph as c varies and a and b are held constant?
The function x^(2)+2*x+c translates upward and downward according to the varying c variable.
B) Is there a common point to all the graphs? What is it?
There is no common point of all the graphs share with respect to intersection points.
C) What is the significance of the graph where c=0?
When c is equal to 0 the y coordinate lies on the x-axis.
6. 1. What do you notice about the roots of all 15 graphs?
The roots stay the same as long as the constants 3 and 5 are not altered by a computation due to the
order of operations.
2. What do you notice about the intercepts of these graphs?
All of the intercepts are through x coordinates (3,0) and (5,0) with the exception of when a is equal to 0
of the function (x-3)*(x-5)*a
3. What do you notice about the intersection points.
The points are all through x values 3 and 5.
4. What do you notice about the Orientation or Position of the graphs.
The graphs are all scalar multiples of each other and as the variable a varies from negative to positive
the orientation of the graphs switch from opening downward to upward.
5. Do they have common points? What can you say about their common points.
They have the points (3,0) and (5,0) in common.
6. What do you notice about the correlation between the orientation of the graphs and the sign or
coefficient of the x^2 term.
The orientation of the graph opens upward when the value of the coefficient of the x^2 is positive and it
opens downward when it takes on a negative value.
7. What do you notice about the locus of the vertex of each of these graphs?
The locus of the vertex lies on the axis of symmetry.
7. IDP TPACK TEMPLATE (INSTRUCTIONAL DESIGN PROJECT TEMPLATE)
NAME: ___Thomas Allen_____ DATE:____12/4/12_____
Describe: content here.
Content.
(COMMON CORE STANDARDS)
CCSS.Math.Content.HSF-IF.C.7 Graph functions expressed symbolically
and show key features of the graph, by hand in simple cases and using
technology for more complicated cases.★
Describe:Standards of mathematical Practice
Reason abstractly and quantitatively.
Construct viable arguments and critique the reasoning of others.
Use appropriate tools strategically
1. Attend to precision.
Pedagogy.
Pedagogy includes
both what the teacher does and what
the student does. It includes where,
what, and how learning takes place. It
is about what works best for a
particular content with the needs of the
learner.
Look for and express regularity in repeated reasoning.
1. Describe instructional strategy (method) appropriate for the content, the learning
environment, and students. This is what the teacher will plan and implement.
This lesson will be exploration based. The teacher will go over the basic topics
such as the standard form of an equation and the basic techniques that manipulate
said equation with use of TI-Inspire
Additionally the teacher will present the class with an appropriate worksheet to
guide the students along.
Walk around the class during the student’s investigation and ask any probing
questions.
2. Describe what learner will be able to do, say, write, calculate, or solve as the
learning objective. This is what the student does.
The student will be able to explore transformations in the quadratic equation based
on the varying coefficients byutilizingsliders as well as using multiple functions and
their graphs on the same plane in order to gain an understanding of each coefficient
and its respective effect on the graph.
3. Describe how creative thinking--or, critical thinking, --or innovative problem
solving is reflected in the content.
In this lesson the sliders will help show what the effects that each coefficient has on
its function but will not give an explicit answer as to why. This implores the student
to discretely figure out what is going on with the function in relation to its varying
coefficients.
8. 1. Describe the technology
TI-Inspire isa computer software that combinesvarious elements of mathematics
that enables its user to gain a deep conceptual understanding of the properties and
concepts in question. As in this case the relationship between algebraic and
graphical representations of quadratic functions.
Technology.
2.
Describe how the technology enhances the lesson, transforms
content, and/or supports pedagogy.
This technology in this lesson enables the students to manipulatethevarious
coefficient values. They can easily manipulate the coefficient value and receive an
instant image that represents the change that was made to the function as opposed to
having to graph each graph individually. This also allows the students to quickly
make and test conjectures about the changes made to the function. The geometry
trace function in TI-Inspire is also useful in that it will allow the user to trace a
certain point of the graph and show its translation over the plane according to the
changes made to the function.
3. Describe how the technology affects student’s thinking processes.
Tracing the vertex of the quadratic equations the students will be able to create a
conjecture about how each of the coefficients makes divers transformationsto the
parabola. This application is useful in that it shows the previous changes to the
quadratic equation.
Reflect—how did the lesson
activity fit the content? How did the
technology enhance both the content
and the lesson activity?
Reflection
The lesson reflects what the content was based which was the common core
standards.Students weren’t necessarily picking out different pieces of the graph but
they are using those pieces to create an understanding of the transformations of the
quadratic equation. The technology made it feasible to put a plethora of graphs on
one graph and be able to look at them at once and see the change according to the
changes made to the respective variable.
Lesson Plan Template MATE 4001 (2013)
Title: Quadratic Transformations
Subject Area: Math 2
Grade Level: Secondary
Concept/Topic to teach: Transformationsof Quadratics
Learning Objectives:
Content objectives (students will be able to……….)
Know each coefficients effect on the graph and how they interact with each other.
9. Essential Question
What question should student be able to answer as a result of completing this lesson?
What are the effects of the variables (a), (b),and (c) on the quadratic equation
and its graph?
Standards addressed:
Common Core State Mathematics Standards:
CCSS.Math.Content.HSF-IF.C.7 Graph functions expressed symbolically and show key features of the
graph, by hand in simple cases and using technology for more complicated cases. ★
Common Core State Mathematical Practice Standards:
Reason abstractly and quantitatively.
Construct viable arguments and critique the reasoning of others.
Use appropriate tools strategically
Attend to precision.
Look for and express regularity in repeated reasoning.
Technology Standards:
HS.TT.1.1:Use appropriate technology tools and other resources to access information (multi-database
search engines, online primary resources, virtual interviews with content experts).
HS.TT.1.2:Use appropriate technology tools and other resources to organize information (e.g. online
note-taking tools, collaborative wikis).
Required Materials:
Computers, Paper /Pencil, Projector
Notes to the reader:
Students already have a basic knowledge of the quadratic function, and how to use TI-Inspire.
10. Time: Assume 90 minutes
Time
Teacher Actions
Student Engagement
I. Focus and
Review
(Establish
prior
knowledge)
Review basic part of parabola. Draw a
parabola and have students call out
parts of the graph.
As an open class discussion students
will come to the board and label and
define the graph with the aid of the
class if necessary.
II. Statement
(Inform
student of
objectives)
Teacher will introduce the basic steps
to graphing a quadratic equation and
instruct students to use TI-Inspire to
createtheir own quadratic function.
Students will use TI-Inspire to look at
the quadratic function.
III. Teacher
Input
(Present
tasks,
information,
and
guidance)
Teacher will supply a worksheet that
students who are put into small
groups would take them through basic
procedures to different steps of
creating a quadratic function. As well
as write down their conjectures of a
given graph, procedure or case.
Pick up the techniques that will be
needed to complete the requirements
in TI-Inspire. Follow along on their
own computers or calculators and
record observations and
conjecturesthat each variant made on
the effects of the graph and discuss
the validityof their conjectures.
IV. Guided
Practice
(Elicit
performance,
provide
assessment
and
feedback)
Circulate and ask questions where
necessary.
The students will then have to move
on to b,c with the sliders. Then the
students will overlay graphs with only
a changing and likewise for b and c
and record their observations about
each.
V.
Independent
Practice -Seatwork
and
Homework
Circulate and ask questions where
necessary. Provide assistance if
necessary for students to be able to
create 10 equations in a timely
manner.
Students will create 8 equations that
have the roots 2 and 6 and overlay
them on one graph and see the
changes that occur in those graphs
and their similarities.
11. (Retention
and transfer)
VI. Closure
When a/b/c change what happens to
(Plan for
the graph?
maintenance)
Are there any common points to the
graphs?
What is the significance when
a/b/c=0?
When all equations have roots of 3
and 5:
What do you notice about the
roots of all 15 graphs
What do you notice about the
Intercepts of these graphs
What do you notice about their
Intersection points
What do you notice about the
Orientation or Position of the
graphs
Do they have Common points?
What can you say about their
common points
What do you notice about the
correlation between the
orientation of the graphs and the
Sign or coefficient of the x^2
term?
What do you notice about the
Locus of the vertex of each of
these graphs?
Present findings in a whole class
discussion.
12. Reflection
TI-Inspire isvery useful in that you can utilize the application of the geometry trace. It was
interesting to find while traveling through this exploration that as the b value varied the various vertex’s
created with the trace application created the parabola with the negated a value. The technology also
really helps with being able to input lots of graphs simultaneously quickly, without this benefit the
conceptual learning that the class period would have would be reduced dramatically due to listless hand
computations. By being able to see all the graphs on one page and being able to utilizea slider the
students will gain a better and deeper conceptual understanding of the lesson and its objective