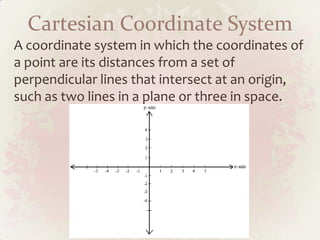
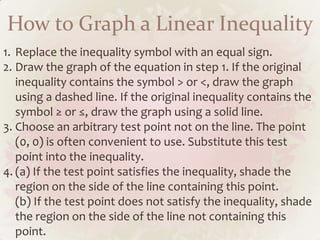
Linear Inequalities in
Two Variables
I. Linear Inequalities in Two Variables
    A. Cartesian Coordinate System
    B. Points on the Cartesian Coordinate Plane
II. Special Product
    A. Multiplication by a Monomial
    B. Sum and Difference of Two Binomials
    C. Products of Two Binomials with like Terms
    D. Square of a Binomial
III. Factoring
    A. Common Factor
    B. Difference of Two Squares
    C. Perfect Square Trinomial
    D. Factoring by Completing the Square
    E. Quadratic Trinomial
IV. Statistics
   A. Introduction
       1. Historical Background
       2. Importance of Summation Notation
   B. Summation Notation
   C. Frequency Table
       1. Definition of Terms
       2. Frequency Distribution Table
Linear Inequalities in Two Variables


  3x + 2y > 4      -x + 3y < 2

  -x + 4y ≥ 3      4x – y ≤ 4
The solutions of a linear inequality in
two variables x and y are the ordered
pairs of numbers (x, y) that satisfy
the inequality.
Given an inequality: 4x – 7 ≤ 4
      check if the following points are solutions to the
given inequality.
      a.(0, -1)
      b.(2, 3)
      c.(-1, 1)
Since there will be an infinite number
of points in the solution, this is best
represented by a graph.
Cartesian Coordinate System
A coordinate system in which the coordinates of
a point are its distances from a set of
perpendicular lines that intersect at an origin,
such as two lines in a plane or three in space.
Rene Descartes – the one who invented the
Cartesian Coordinate System
• It provided the first systematic link between
Euclidean geometry and algebra.

• Cartesian coordinates are the foundation of analytic
geometry, and provide enlightening geometric
interpretations for many other branches of
mathematics, such as linear algebra, complex
analysis, differential
geometry, multivariate calculus, group theory, and
more.
• The development of the Cartesian coordinate
system would play an intrinsic role in the
development of the calculus by Isaac
Newton and Gottfried Wilhelm Leibniz.

• Many other coordinate systems have been
developed since Descartes, such as the polar
coordinates for the plane, and
the spherical and cylindrical coordinates for three-
dimensional space.
How to Graph a Linear Inequality
1. Replace the inequality symbol with an equal sign.
2. Draw the graph of the equation in step 1. If the original
   inequality contains the symbol > or <, draw the graph
   using a dashed line. If the original inequality contains the
   symbol ≥ or ≤, draw the graph using a solid line.
3. Choose an arbitrary test point not on the line. The point
   (0, 0) is often convenient to use. Substitute this test
   point into the inequality.
4. (a) If the test point satisfies the inequality, shade the
   region on the side of the line containing this point.
   (b) If the test point does not satisfy the inequality, shade
   the region on the side of the line not containing this
   point.
Assignment:
Bring the following on Monday.

     • graphing papers
     • coloring materials
     • ruler

Linear inequalities in two variables

  • 1.
  • 2.
    I. Linear Inequalitiesin Two Variables A. Cartesian Coordinate System B. Points on the Cartesian Coordinate Plane II. Special Product A. Multiplication by a Monomial B. Sum and Difference of Two Binomials C. Products of Two Binomials with like Terms D. Square of a Binomial III. Factoring A. Common Factor B. Difference of Two Squares C. Perfect Square Trinomial D. Factoring by Completing the Square E. Quadratic Trinomial
  • 3.
    IV. Statistics A. Introduction 1. Historical Background 2. Importance of Summation Notation B. Summation Notation C. Frequency Table 1. Definition of Terms 2. Frequency Distribution Table
  • 4.
    Linear Inequalities inTwo Variables 3x + 2y > 4 -x + 3y < 2 -x + 4y ≥ 3 4x – y ≤ 4
  • 5.
    The solutions ofa linear inequality in two variables x and y are the ordered pairs of numbers (x, y) that satisfy the inequality. Given an inequality: 4x – 7 ≤ 4 check if the following points are solutions to the given inequality. a.(0, -1) b.(2, 3) c.(-1, 1)
  • 6.
    Since there willbe an infinite number of points in the solution, this is best represented by a graph.
  • 7.
    Cartesian Coordinate System Acoordinate system in which the coordinates of a point are its distances from a set of perpendicular lines that intersect at an origin, such as two lines in a plane or three in space.
  • 8.
    Rene Descartes –the one who invented the Cartesian Coordinate System • It provided the first systematic link between Euclidean geometry and algebra. • Cartesian coordinates are the foundation of analytic geometry, and provide enlightening geometric interpretations for many other branches of mathematics, such as linear algebra, complex analysis, differential geometry, multivariate calculus, group theory, and more.
  • 9.
    • The developmentof the Cartesian coordinate system would play an intrinsic role in the development of the calculus by Isaac Newton and Gottfried Wilhelm Leibniz. • Many other coordinate systems have been developed since Descartes, such as the polar coordinates for the plane, and the spherical and cylindrical coordinates for three- dimensional space.
  • 10.
    How to Grapha Linear Inequality 1. Replace the inequality symbol with an equal sign. 2. Draw the graph of the equation in step 1. If the original inequality contains the symbol > or <, draw the graph using a dashed line. If the original inequality contains the symbol ≥ or ≤, draw the graph using a solid line. 3. Choose an arbitrary test point not on the line. The point (0, 0) is often convenient to use. Substitute this test point into the inequality. 4. (a) If the test point satisfies the inequality, shade the region on the side of the line containing this point. (b) If the test point does not satisfy the inequality, shade the region on the side of the line not containing this point.
  • 11.
    Assignment: Bring the followingon Monday. • graphing papers • coloring materials • ruler