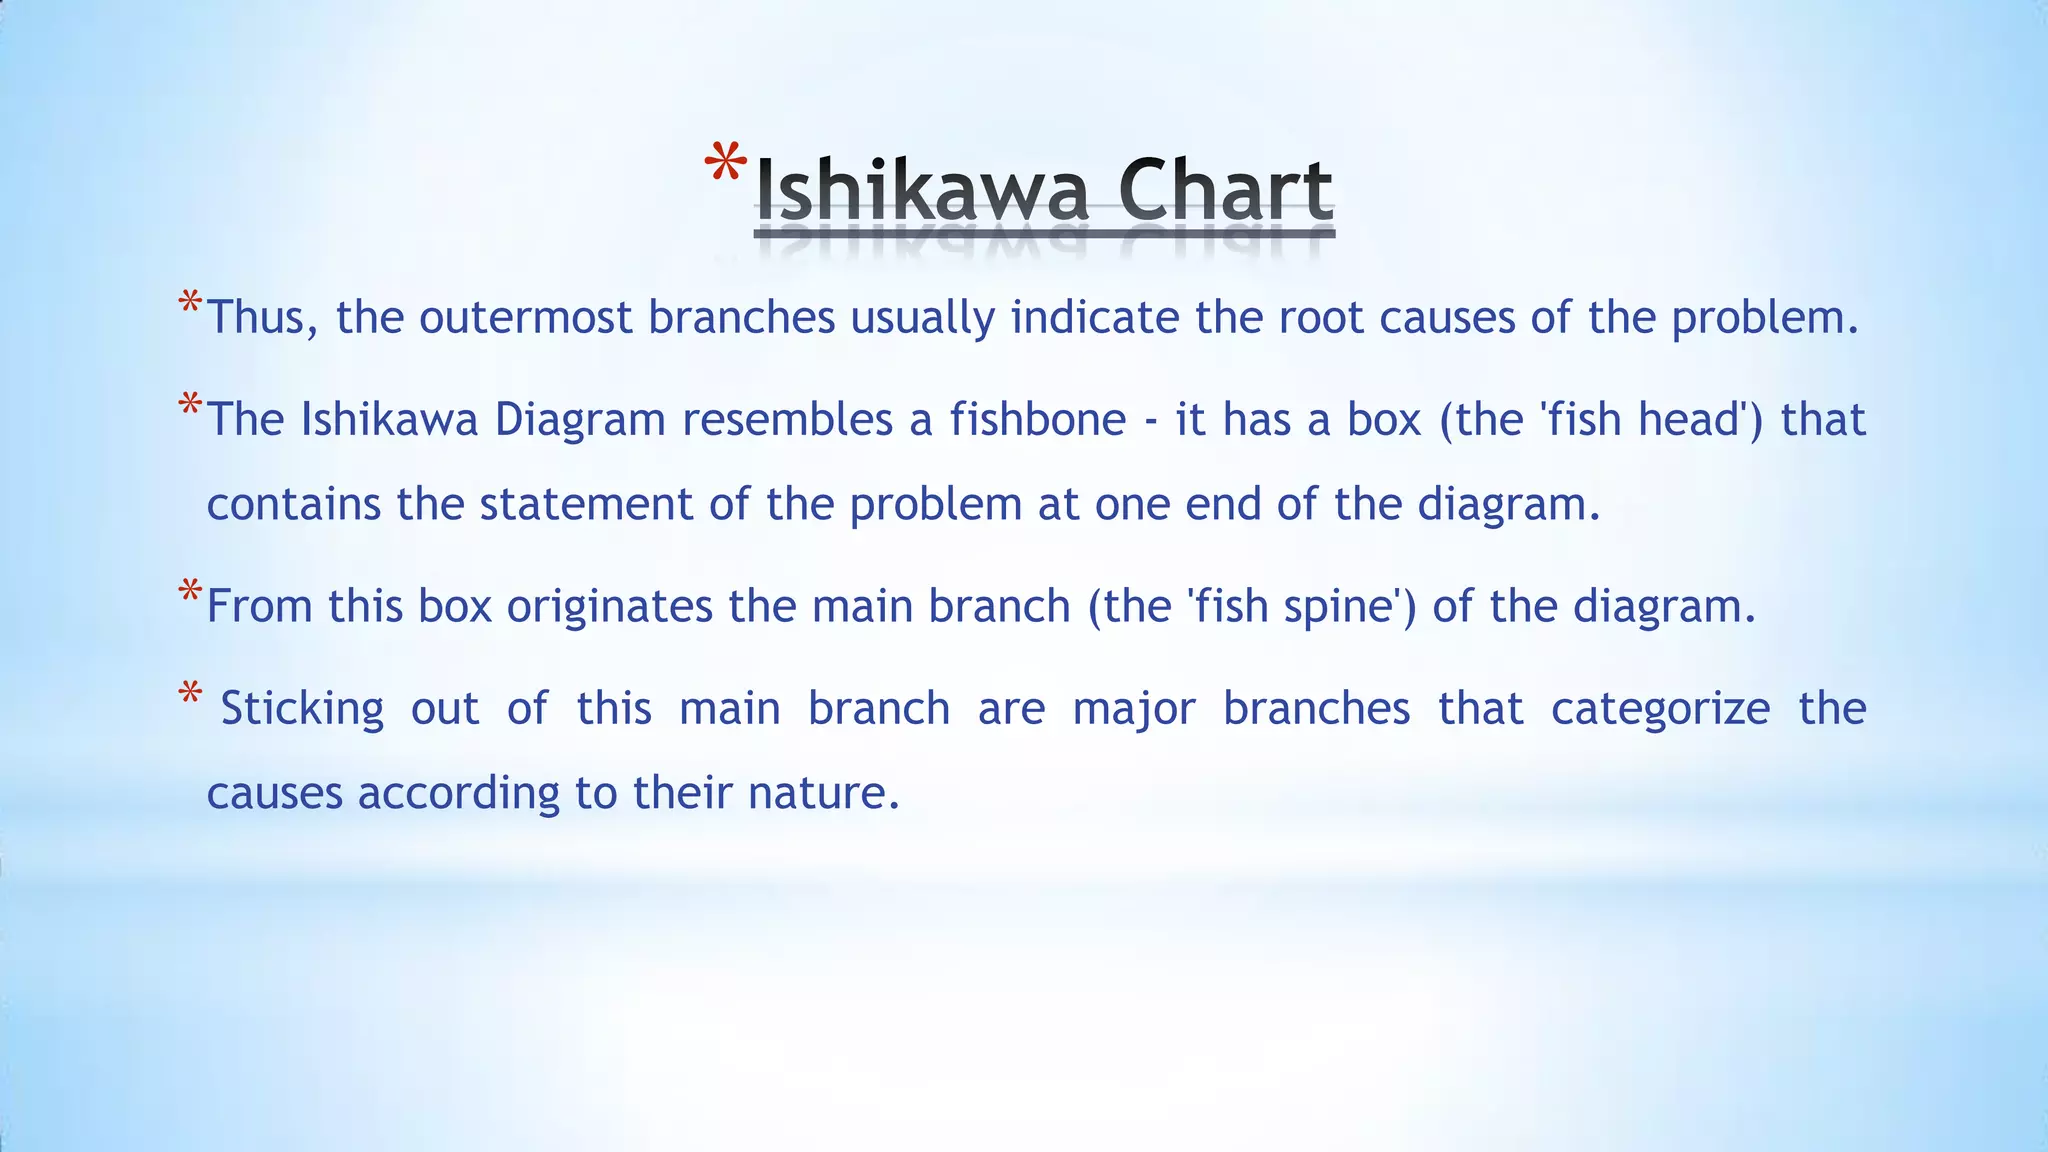
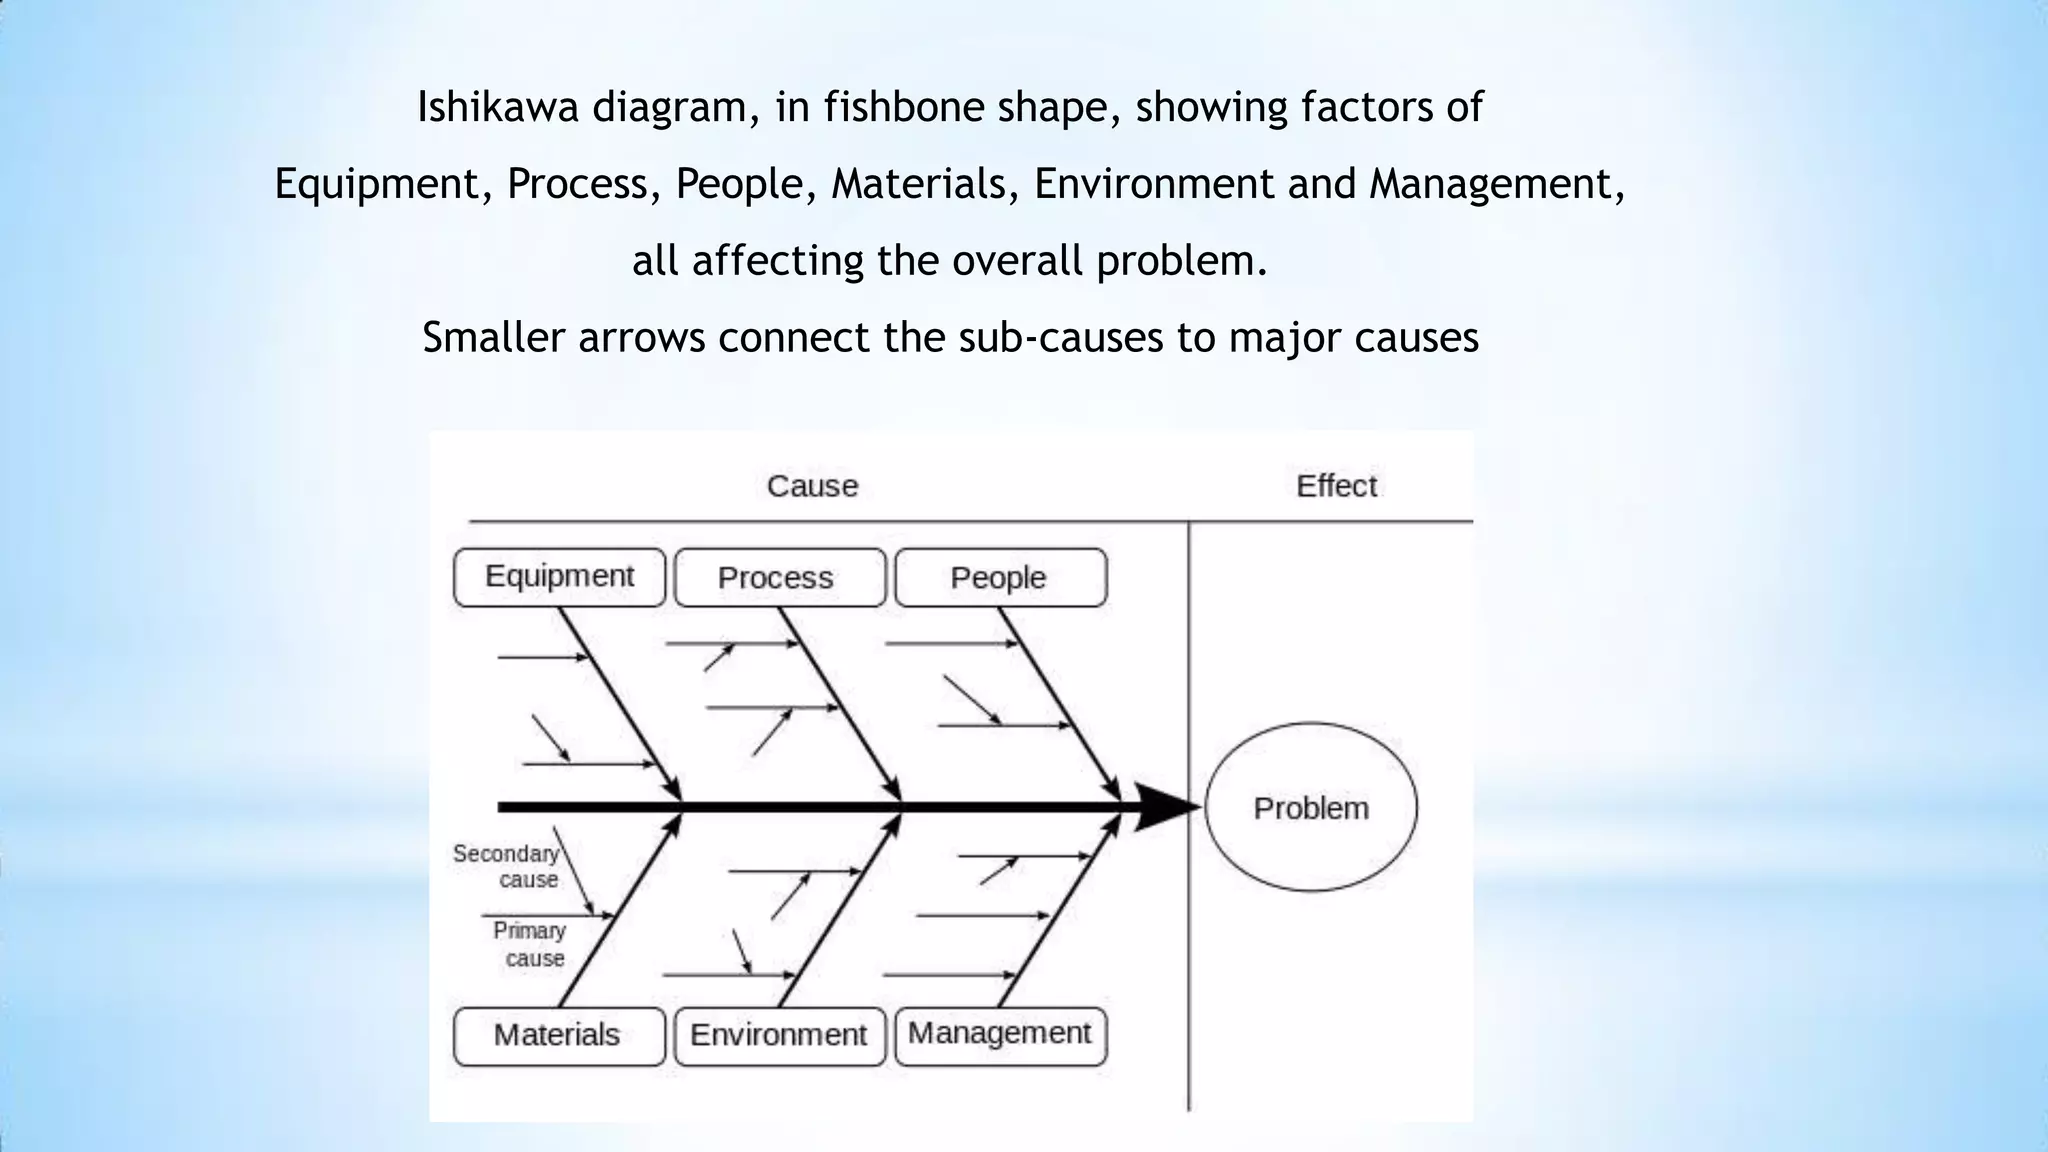
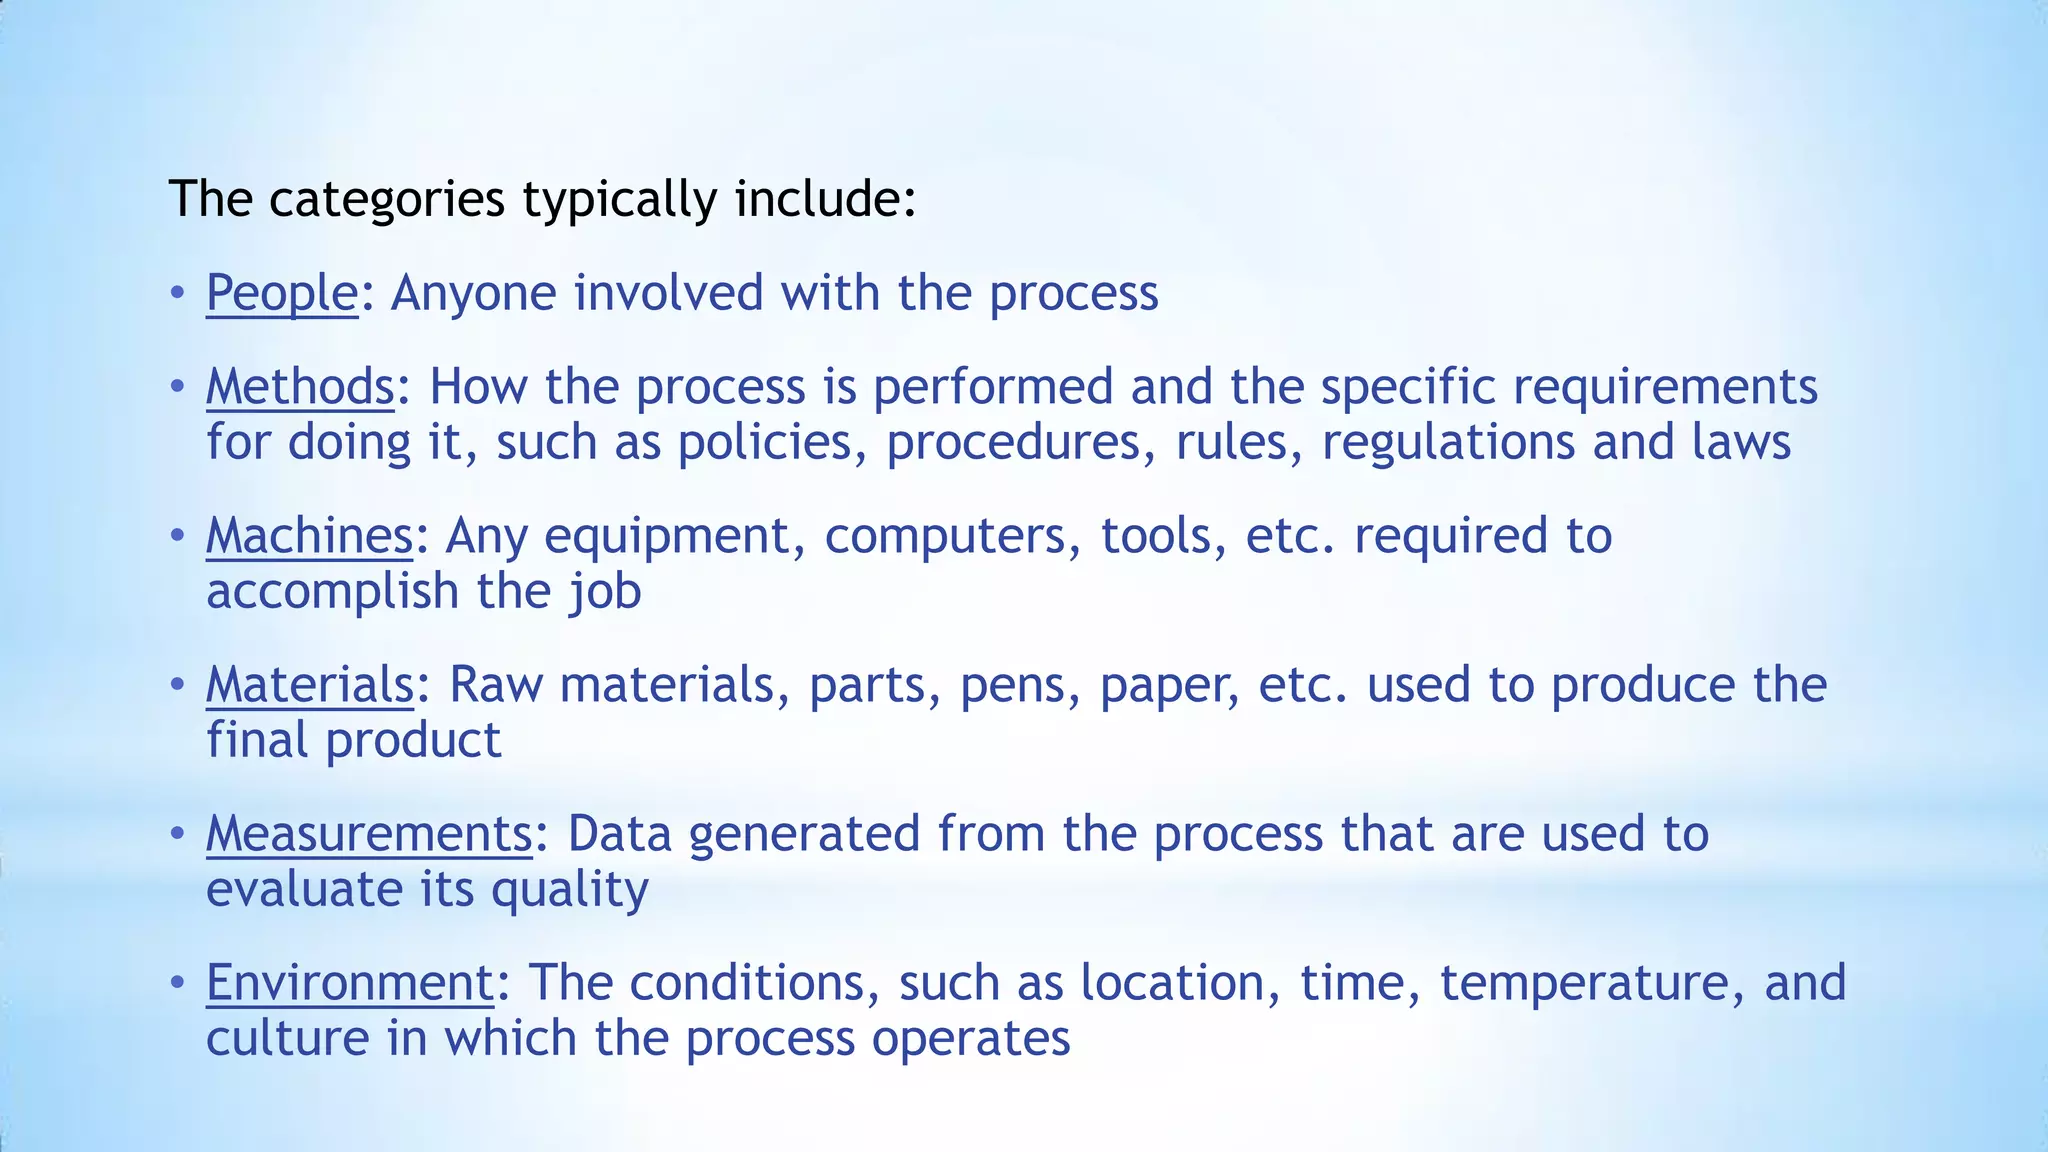
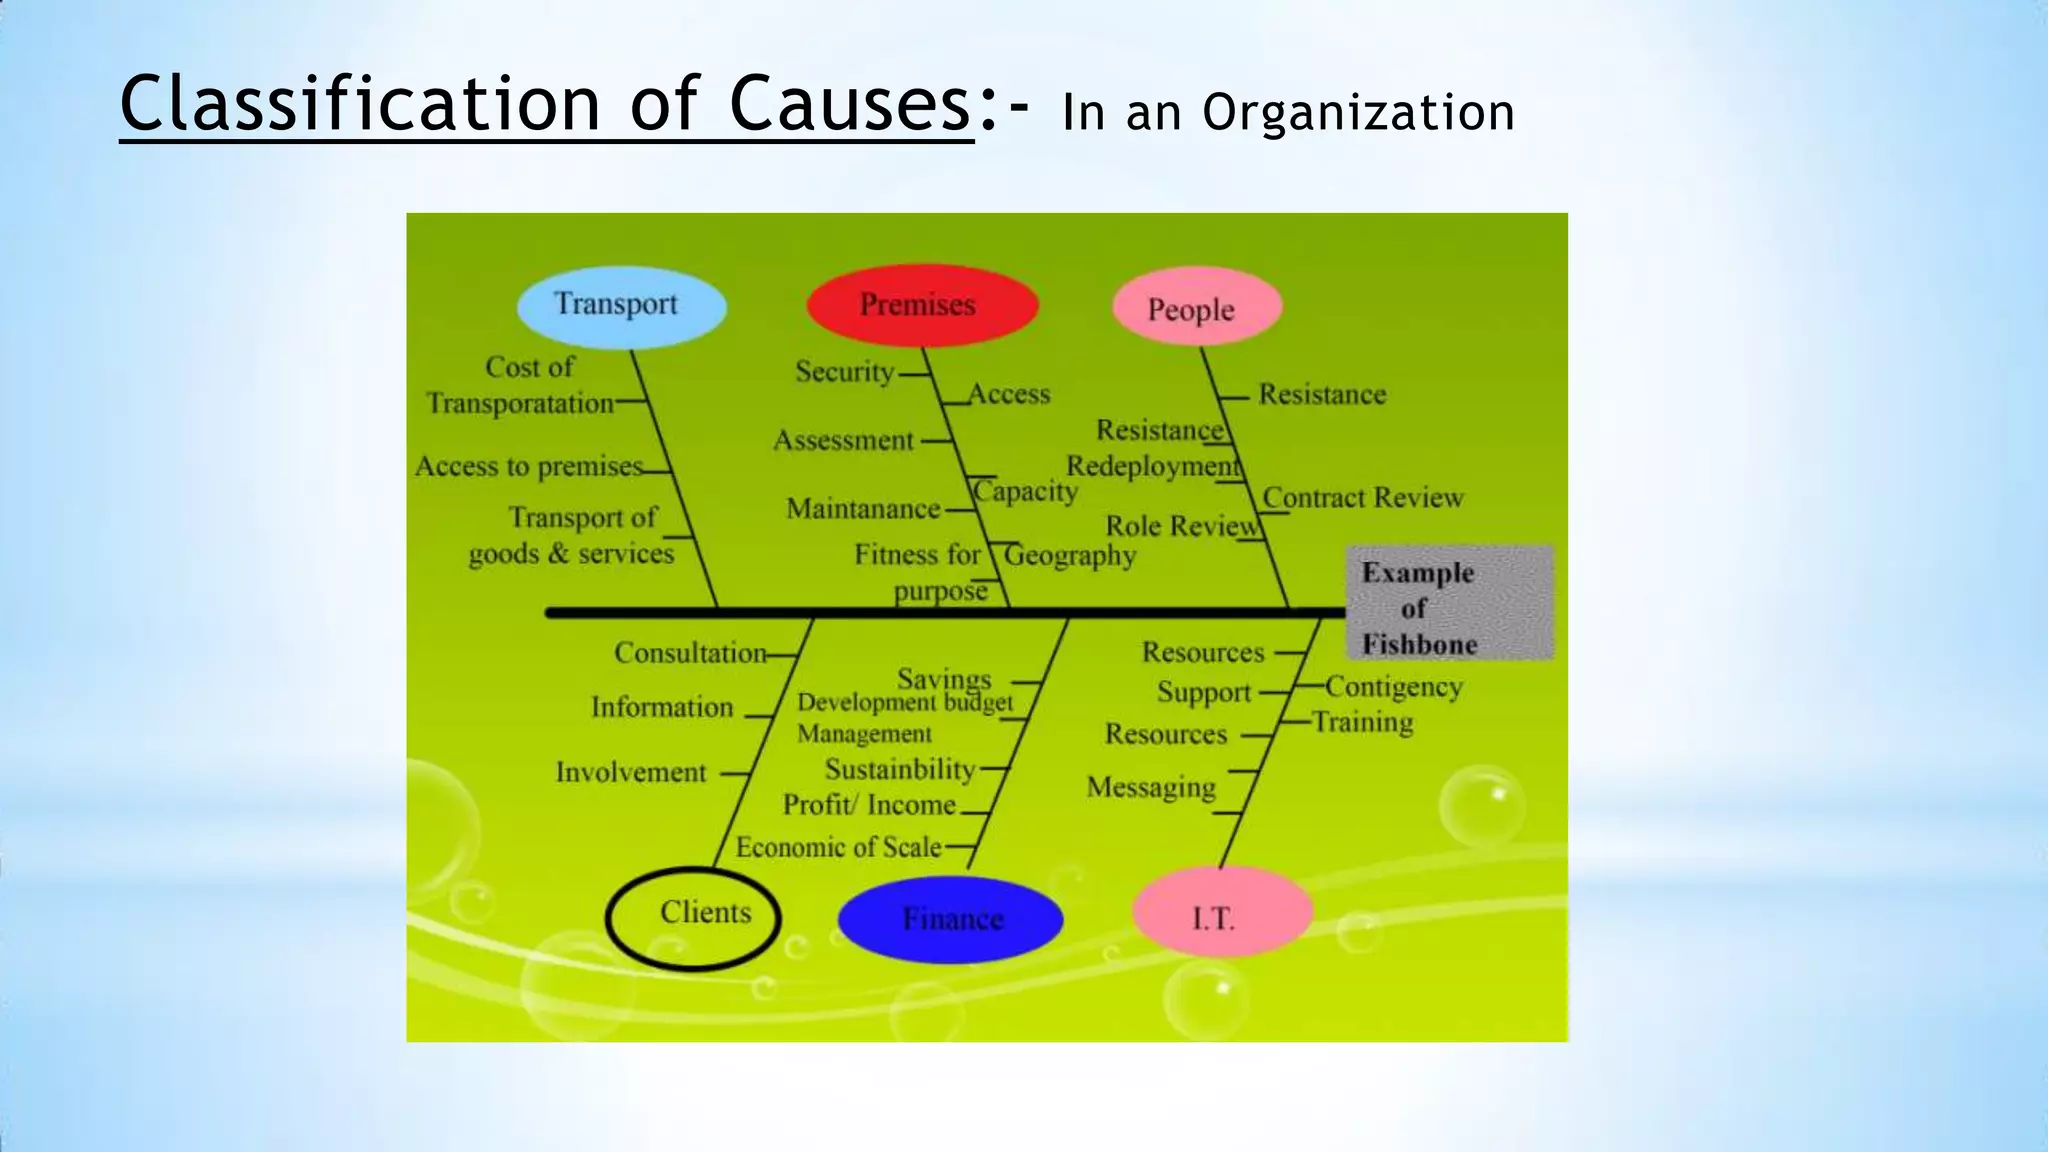
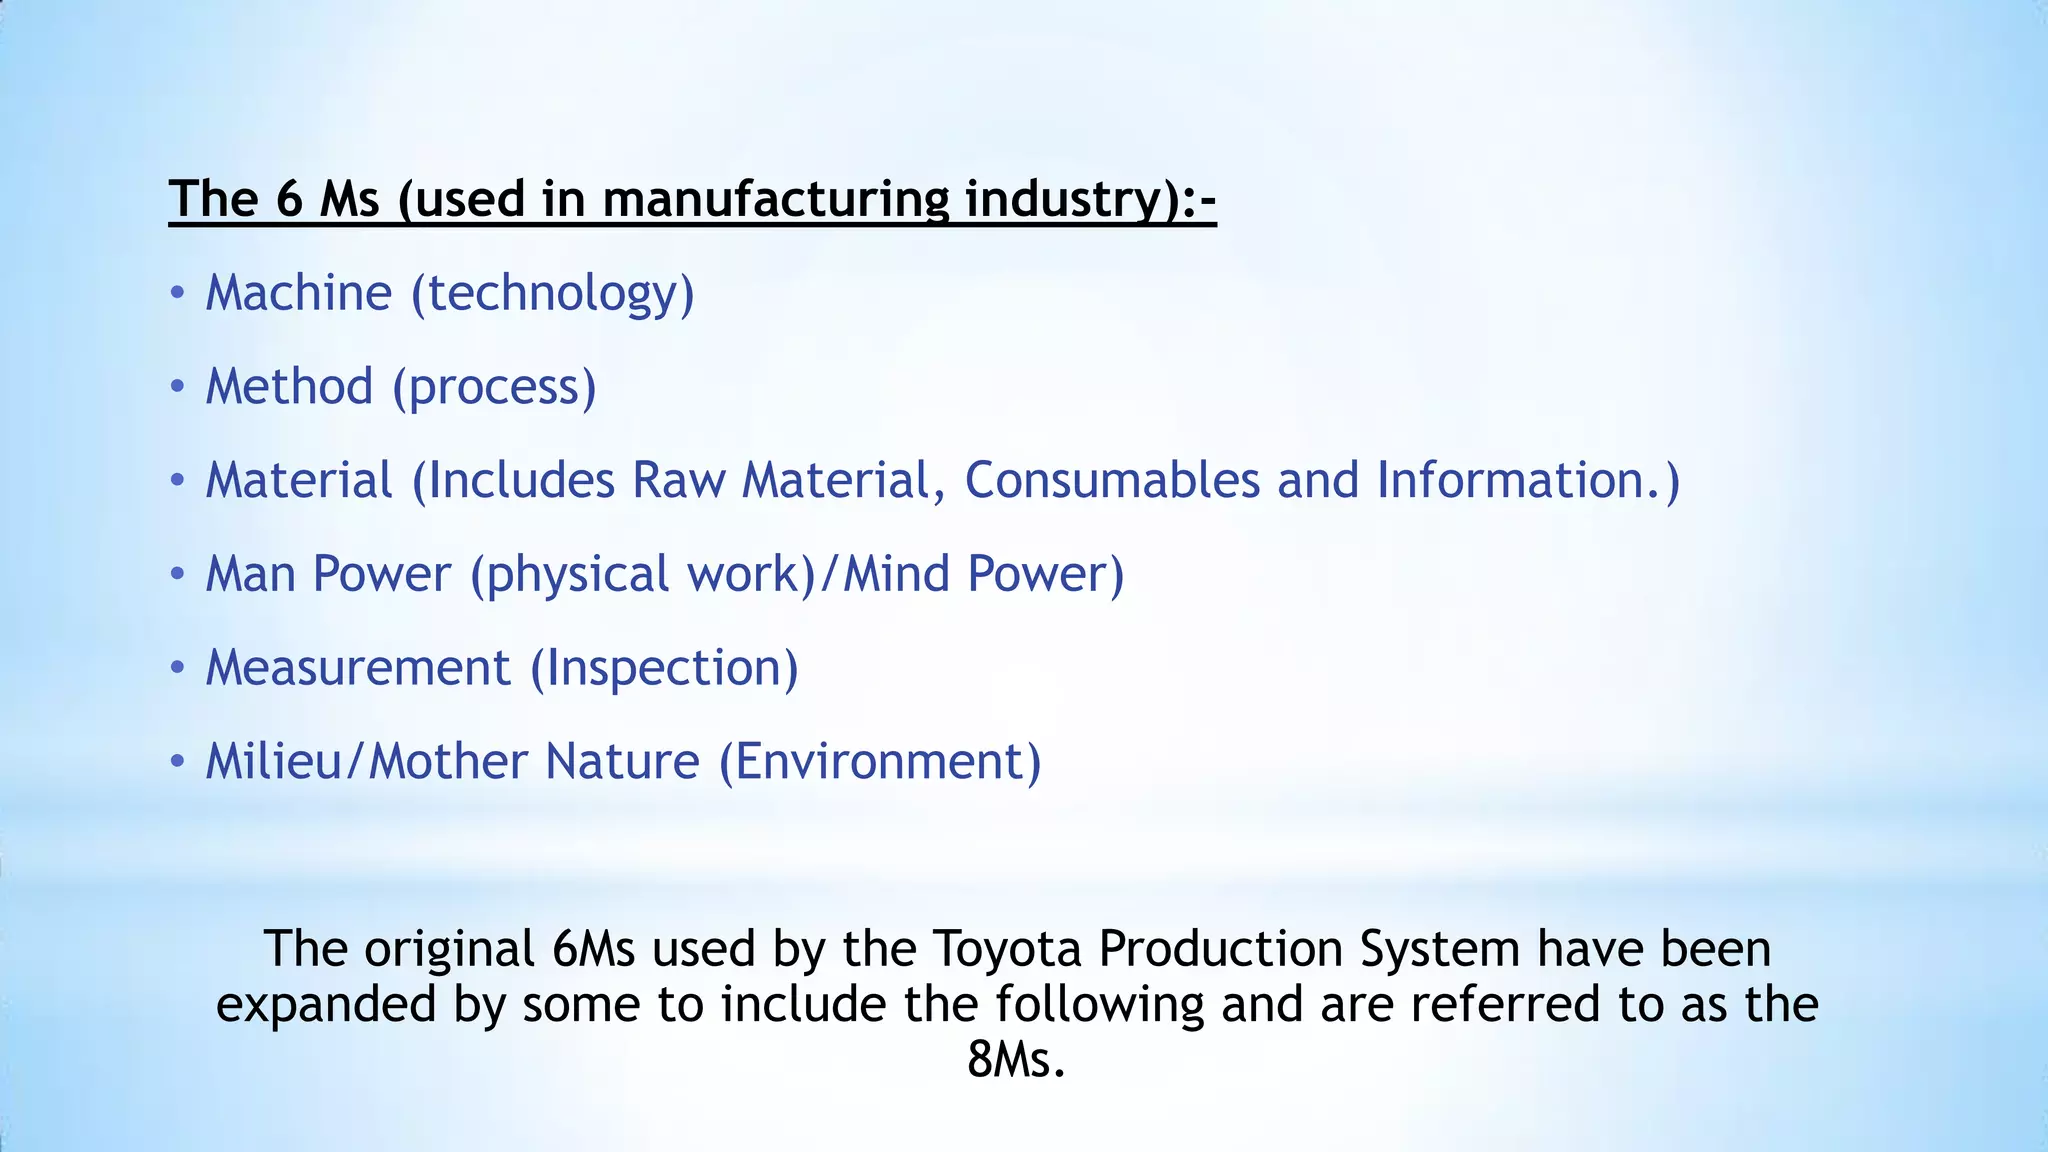
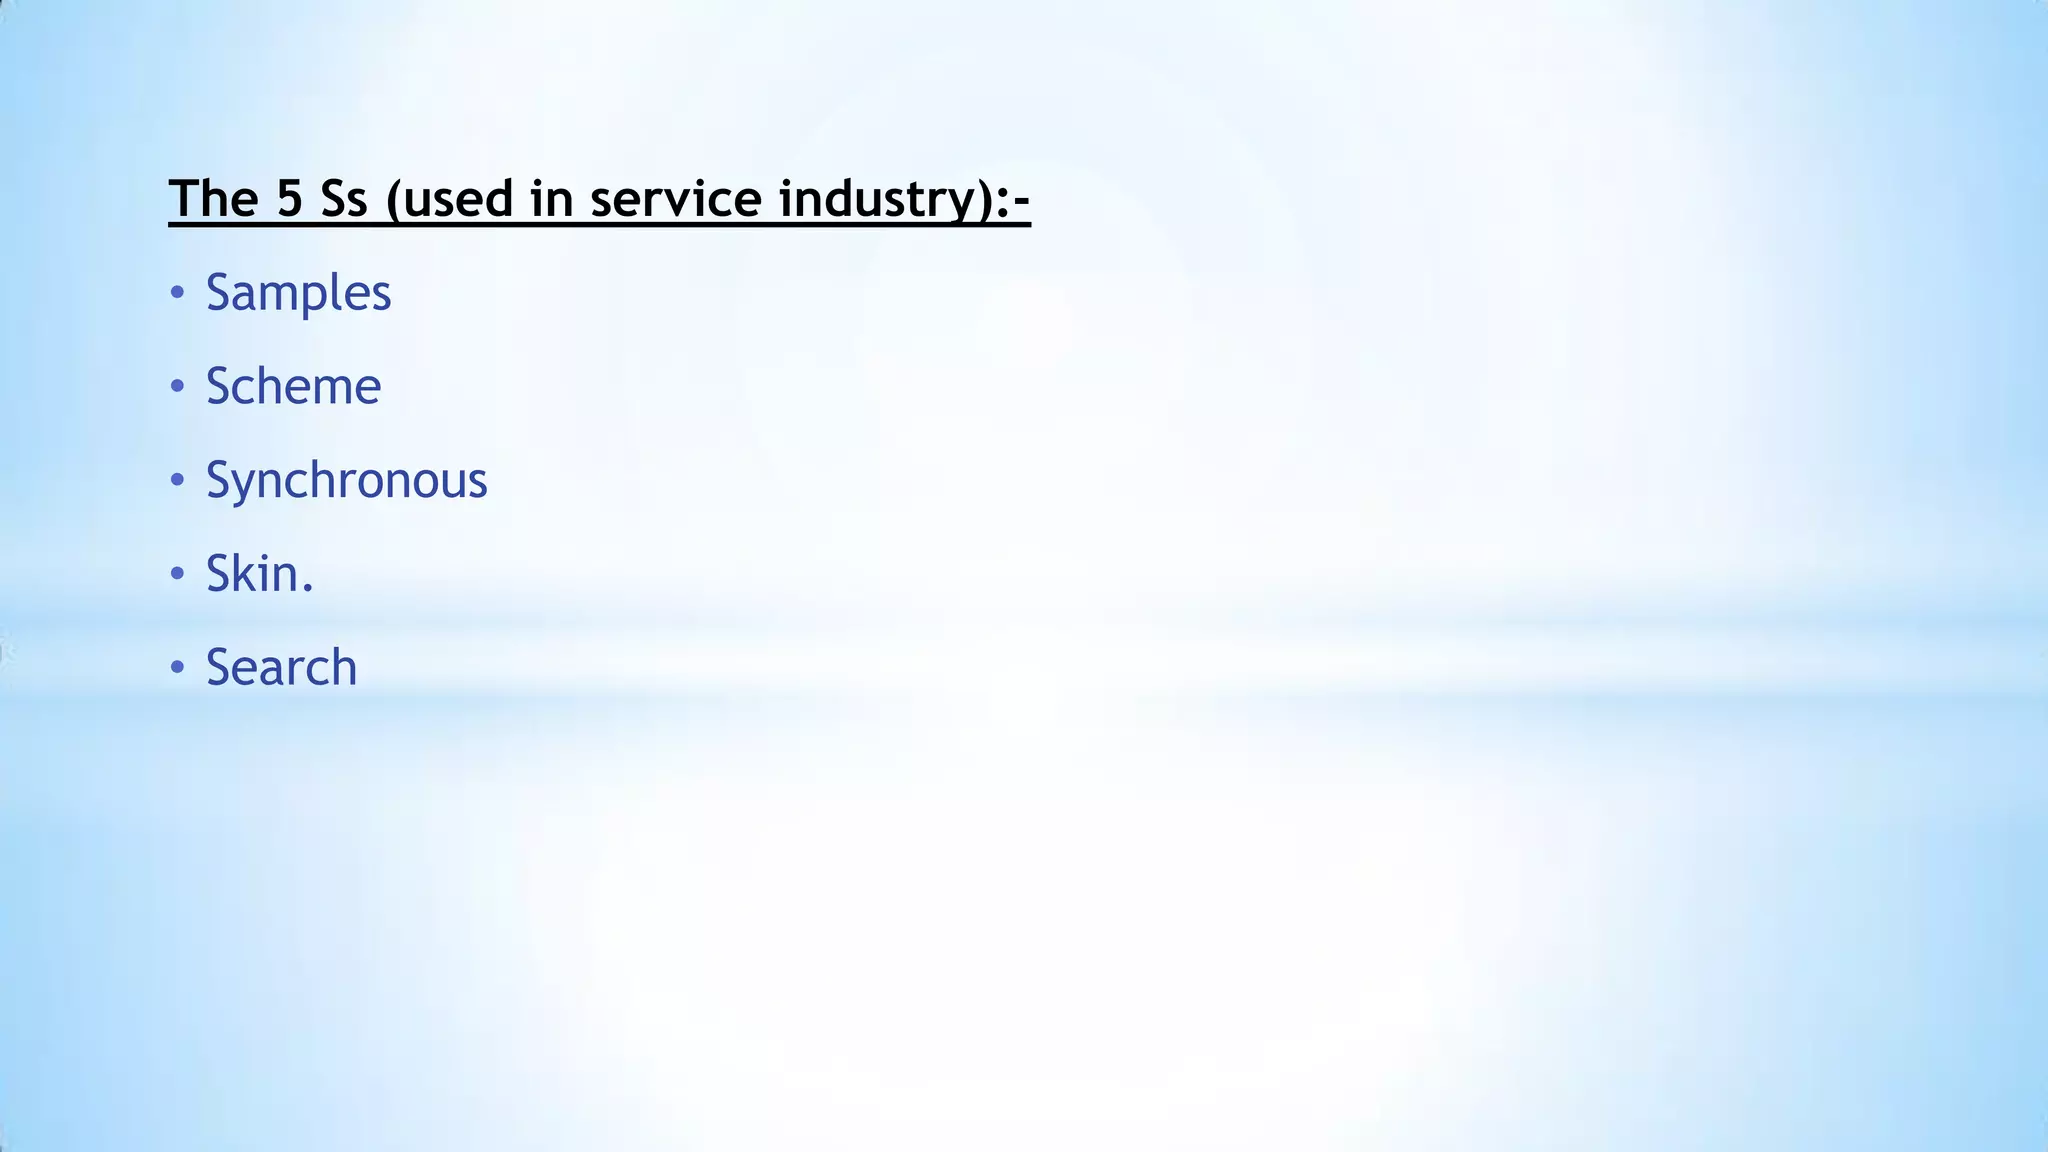
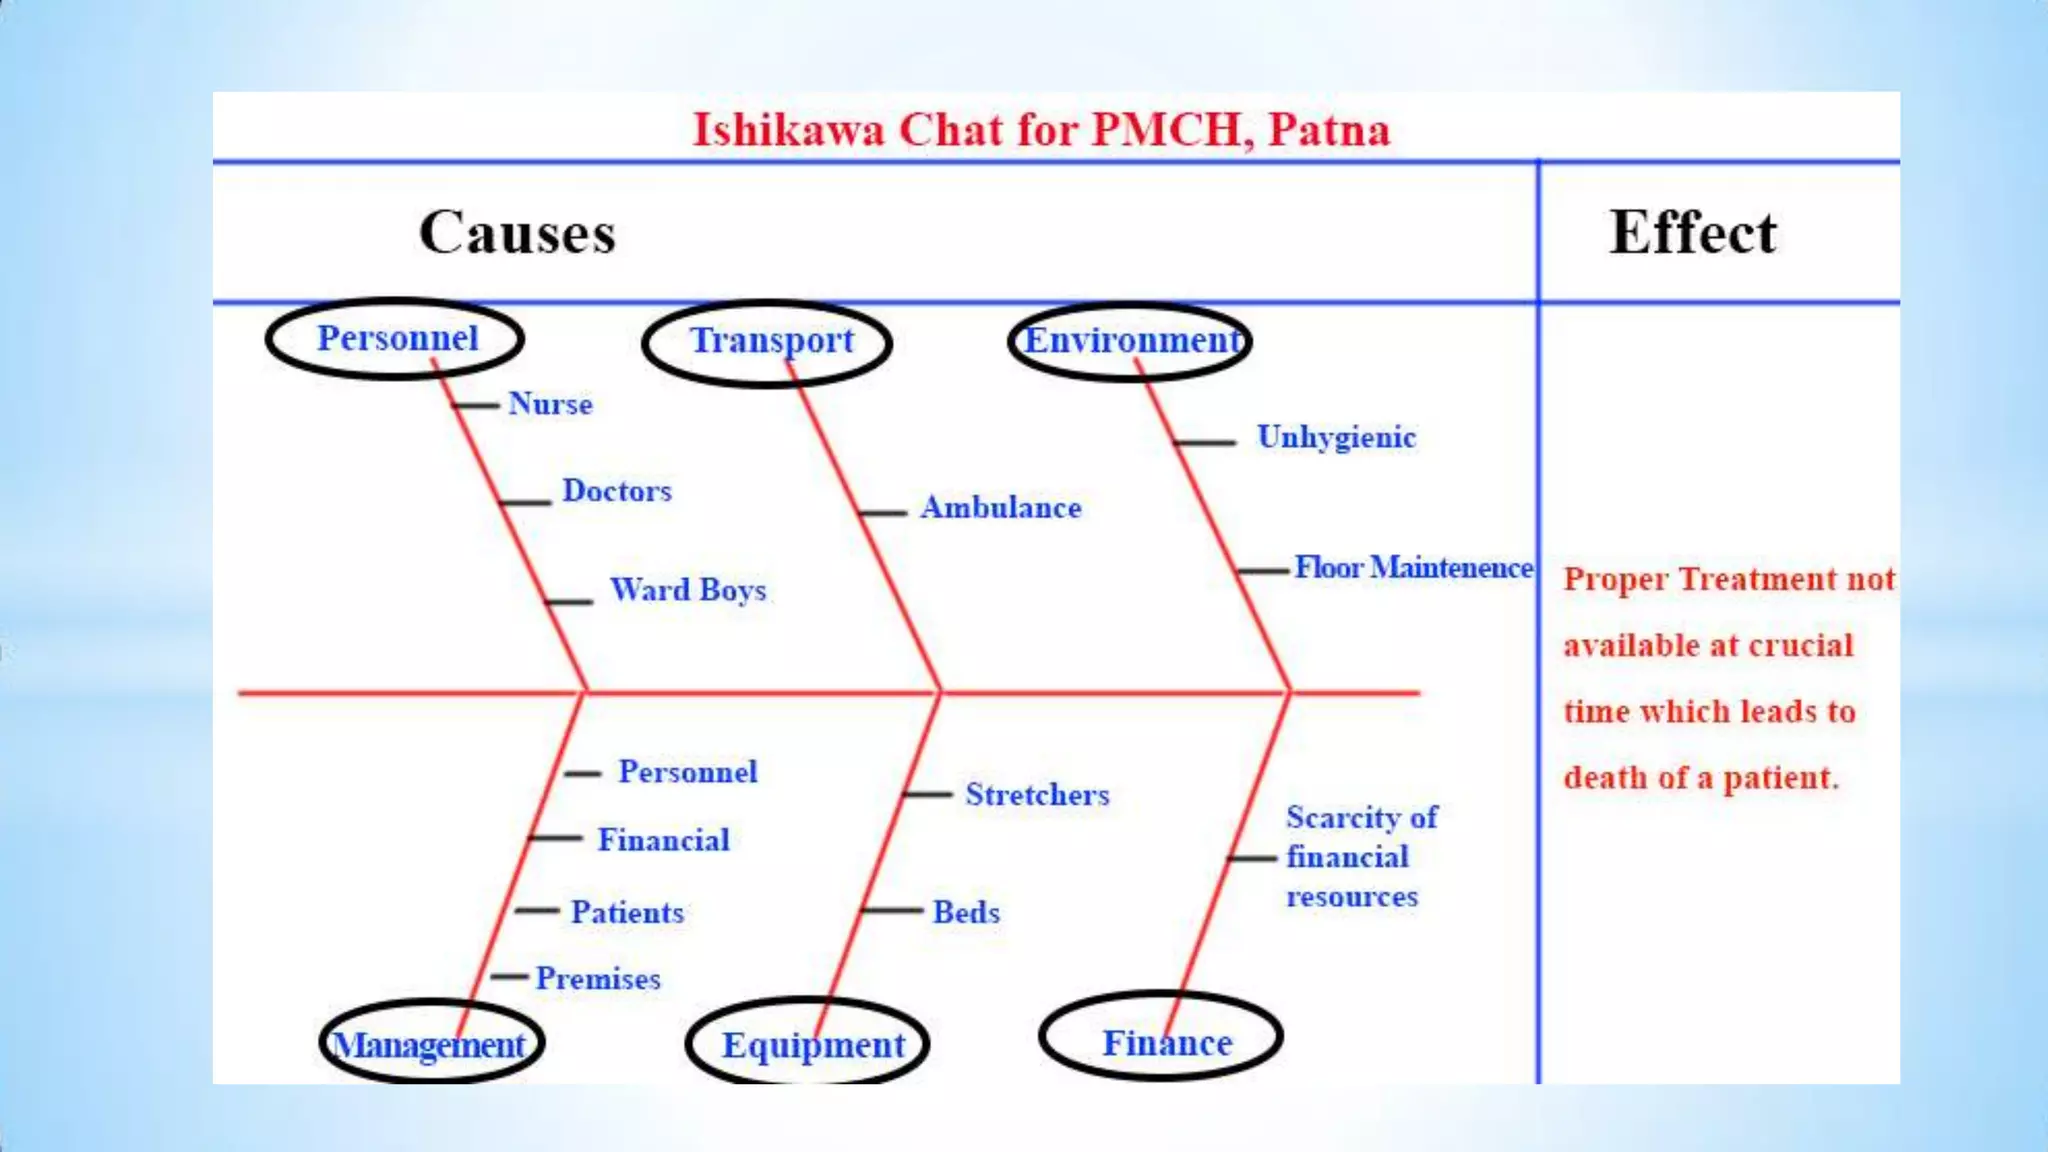
*
Group Members Are:1. Swati Kaushal
2. Shreya Srivastava
3. Ravindra Kumar
4. Madhusudan Kumar
5. Ratnesh Kumar
6. Srishti
7. Nitika Kumari
8. Ankita

MBA/15001/13
MBA/15003/13
MBA/15004/13
MBA/15005/13
MBA/15006/13
MBA/15008/13
MBA/15009/13
MBA/15010/13
*

Ishikawa Chart
*
*The

Seven Basic Tools of Quality Control is a designation

given to a fixed set of graphical techniques identified as
being most helpful in troubleshooting issues related to
quality. They are called basic because they are suitable for
people with little formal training in statistics and because
they can be used to solve the vast majority of qualityrelated issues.
*
* The Ishikawa Chart, also known as the Fishbone Diagram or the Cause-andEffect Diagram,

* It

is a tool used for systematically identifying and presenting all the possible

causes of a particular problem in an organisation in graphical format.

* The

possible causes are presented at various levels of detail in connected

branches, with the level of detail increasing as the branch goes outward, i.e.,

an outer branch is a cause of the inner branch it is attached
*
* Thus, the outermost branches usually indicate the root causes of the problem.
* The Ishikawa Diagram resembles a fishbone - it has a box (the 'fish head') that
contains the statement of the problem at one end of the diagram.

* From this box originates the main branch (the 'fish spine') of the diagram.
* Sticking

out of this main branch are major branches that categorize the

causes according to their nature.
*
* It is created by KAORU ISHIKAWA in 1968
* He

was a Japanese Organizational Theorist, Professor at the Faculty of

Engineering at The University of Tokyo

* He was noted for his quality management innovations.
* He

was pioneered the quality management processes in the Kawasaki

shipyards, and in the process became one of the founding fathers of modern

management
*
*
*Step 1 -

Identify the Problem

*Step 2 -

Draw “spine” and “bones”

*Step 3 -

Identify different areas where problems may arise from

*Step 4 -

Identify what these specific causes could be

*Step 5 – Use the finished diagram to brainstorm solutions to the main
problems.
Ishikawa diagram, in fishbone shape, showing factors of
Equipment, Process, People, Materials, Environment and Management,
all affecting the overall problem.
Smaller arrows connect the sub-causes to major causes
The categories typically include:
• People: Anyone involved with the process
• Methods: How the process is performed and the specific requirements
for doing it, such as policies, procedures, rules, regulations and laws

• Machines: Any equipment, computers, tools, etc. required to
accomplish the job
• Materials: Raw materials, parts, pens, paper, etc. used to produce the
final product
• Measurements: Data generated from the process that are used to
evaluate its quality
• Environment: The conditions, such as location, time, temperature, and
culture in which the process operates
Classification of Causes:-

In an Organization
The 6 Ms (used in manufacturing industry):• Machine (technology)
• Method (process)
• Material (Includes Raw Material, Consumables and Information.)
• Man Power (physical work)/Mind Power)
• Measurement (Inspection)
• Milieu/Mother Nature (Environment)

The original 6Ms used by the Toyota Production System have been
expanded by some to include the following and are referred to as the
8Ms.
The 7 Ps (used in marketing industry):• Product/Service
• Price
• Place
• Promotion
• People/personnel
• Positioning
• Packaging
The 5 Ss (used in service industry):• Samples
• Scheme
• Synchronous
• Skin.
• Search
*
*A family

with patient goes to Patna Medical College, Patna (PMCH)

and Hospital in critical condition, he need immediate diagnosis, he
is examined by a doctor. Doctor told patient’s family member that
he needed to be admitted, then patient’s family member filled all
the required documents. But, although the formalities were done
the patient didn’t get bed in OPD neither he got the treatment,
rather he had to lie down on the floor in the corridor because
stretchers was unavailable in the hospital. And due to this poor
management of the hospital, the patient died with hours.
That’s All
Special Thank s to IFTEKAR SIR for all these
opportunity

And Thank You All

Ishikawa chart of quality control

  • 1.
    * Group Members Are:1.Swati Kaushal 2. Shreya Srivastava 3. Ravindra Kumar 4. Madhusudan Kumar 5. Ratnesh Kumar 6. Srishti 7. Nitika Kumari 8. Ankita MBA/15001/13 MBA/15003/13 MBA/15004/13 MBA/15005/13 MBA/15006/13 MBA/15008/13 MBA/15009/13 MBA/15010/13
  • 2.
  • 3.
    * *The Seven Basic Toolsof Quality Control is a designation given to a fixed set of graphical techniques identified as being most helpful in troubleshooting issues related to quality. They are called basic because they are suitable for people with little formal training in statistics and because they can be used to solve the vast majority of qualityrelated issues.
  • 4.
    * * The IshikawaChart, also known as the Fishbone Diagram or the Cause-andEffect Diagram, * It is a tool used for systematically identifying and presenting all the possible causes of a particular problem in an organisation in graphical format. * The possible causes are presented at various levels of detail in connected branches, with the level of detail increasing as the branch goes outward, i.e., an outer branch is a cause of the inner branch it is attached
  • 5.
    * * Thus, theoutermost branches usually indicate the root causes of the problem. * The Ishikawa Diagram resembles a fishbone - it has a box (the 'fish head') that contains the statement of the problem at one end of the diagram. * From this box originates the main branch (the 'fish spine') of the diagram. * Sticking out of this main branch are major branches that categorize the causes according to their nature.
  • 6.
    * * It iscreated by KAORU ISHIKAWA in 1968 * He was a Japanese Organizational Theorist, Professor at the Faculty of Engineering at The University of Tokyo * He was noted for his quality management innovations. * He was pioneered the quality management processes in the Kawasaki shipyards, and in the process became one of the founding fathers of modern management
  • 7.
  • 8.
    * *Step 1 - Identifythe Problem *Step 2 - Draw “spine” and “bones” *Step 3 - Identify different areas where problems may arise from *Step 4 - Identify what these specific causes could be *Step 5 – Use the finished diagram to brainstorm solutions to the main problems.
  • 9.
    Ishikawa diagram, infishbone shape, showing factors of Equipment, Process, People, Materials, Environment and Management, all affecting the overall problem. Smaller arrows connect the sub-causes to major causes
  • 10.
    The categories typicallyinclude: • People: Anyone involved with the process • Methods: How the process is performed and the specific requirements for doing it, such as policies, procedures, rules, regulations and laws • Machines: Any equipment, computers, tools, etc. required to accomplish the job • Materials: Raw materials, parts, pens, paper, etc. used to produce the final product • Measurements: Data generated from the process that are used to evaluate its quality • Environment: The conditions, such as location, time, temperature, and culture in which the process operates
  • 11.
  • 12.
    The 6 Ms(used in manufacturing industry):• Machine (technology) • Method (process) • Material (Includes Raw Material, Consumables and Information.) • Man Power (physical work)/Mind Power) • Measurement (Inspection) • Milieu/Mother Nature (Environment) The original 6Ms used by the Toyota Production System have been expanded by some to include the following and are referred to as the 8Ms.
  • 13.
    The 7 Ps(used in marketing industry):• Product/Service • Price • Place • Promotion • People/personnel • Positioning • Packaging
  • 14.
    The 5 Ss(used in service industry):• Samples • Scheme • Synchronous • Skin. • Search
  • 15.
  • 16.
    *A family with patientgoes to Patna Medical College, Patna (PMCH) and Hospital in critical condition, he need immediate diagnosis, he is examined by a doctor. Doctor told patient’s family member that he needed to be admitted, then patient’s family member filled all the required documents. But, although the formalities were done the patient didn’t get bed in OPD neither he got the treatment, rather he had to lie down on the floor in the corridor because stretchers was unavailable in the hospital. And due to this poor management of the hospital, the patient died with hours.
  • 18.
    That’s All Special Thanks to IFTEKAR SIR for all these opportunity And Thank You All