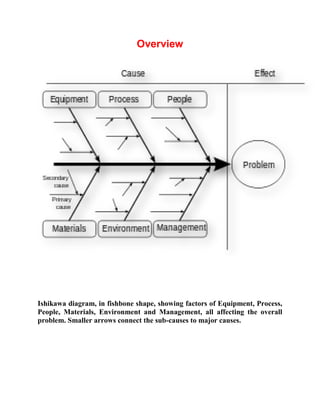
Ishikawa diagram
(Also called fishbone diagrams, herringbone diagrams, cause-and-effect
diagrams, or Fishikawa) are causal diagrams created by Kaoru Ishikawa (1968)
that show the causes of a specific event. Common uses of the Ishikawa diagram are
product design and quality defect prevention, to identify potential factors causing
an overall effect. Each cause or reason for imperfection is a source of variation.
Causes are usually grouped into major categories to identify these sources of
variation. The categories typically include:
People: Anyone involved with the process
Methods: How the process is performed and the specific requirements for
doing it, such as policies, procedures, rules, regulations and laws
Machines: Any equipment, computers, tools, etc. required to accomplish the
job
Materials: Raw materials, parts, pens, paper, etc. used to produce the final
product
Measurements: Data generated from the process that are used to evaluate its
quality
Environment: The conditions, such as location, time, temperature, and
culture in which the process operates
Contents
1 Overview
2 Causes
o 2.1 The 6 Ms (used in manufacturing industry)
o 2.2 The 7 Ps (used in marketing industry)
o 2.3 The 5 Ss (used in service industry)
o 2.4 5 W
3 Criticism
4 See also
5 References
o 5.1 Further reading
6 External links
Overview
Ishikawa diagram, in fishbone shape, showing factors of Equipment, Process,
People, Materials, Environment and Management, all affecting the overall
problem. Smaller arrows connect the sub-causes to major causes.
Causes
Causes in the diagram are often categorized, such as to the 6 M's, described
below. Cause-and-effect diagrams can reveal key relationships among various
variables, and the possible causes provide additional insight into process
behavior.
Causes can be derived from brainstorming sessions. These groups can then be
labeled as categories of the fishbone. They will typically be one of the
traditional categories mentioned above but may be something unique to the
application in a specific case. Causes can be traced back to root causes with
the 5 Whys technique.
The 6 Ms (used in manufacturing industry)
Machine (technology)
Method (process)
Material (Includes Raw Material, Consumables and Information.)
Man Power (physical work)/Mind Power (brain work)
Measurement (Inspection)
Milieu/Mother Nature (Environment)
The 7 Ps (used in marketing industry)
Product=Service
Price
Place
Promotion
People/personnel
Process
Physical Evidence
The 5 Ss (used in service industry)
Samples
Scheme
Synchronous
Skin
Search
5 W
Where
What
When
Who
Why
Criticism
In a discussion of the nature of a cause it is customary to distinguish between necessary and
sufficient conditions for the occurrence of an event. A necessary condition for the
occurrence of a specified event is a circumstance in whose absence the event cannot occur.
A sufficient set of conditions is a situation/circumstance in whose presence the event must
occur.[5]
Ishikawa diagrams have been criticized for failing to make the distinction between
necessary conditions and sufficient conditions. It seems that Ishikawa was not even aware
of this distinction.[6]
Ishikawa diagram

Ishikawa diagram

  • 1.
    Ishikawa diagram (Also calledfishbone diagrams, herringbone diagrams, cause-and-effect diagrams, or Fishikawa) are causal diagrams created by Kaoru Ishikawa (1968) that show the causes of a specific event. Common uses of the Ishikawa diagram are product design and quality defect prevention, to identify potential factors causing an overall effect. Each cause or reason for imperfection is a source of variation. Causes are usually grouped into major categories to identify these sources of variation. The categories typically include: People: Anyone involved with the process Methods: How the process is performed and the specific requirements for doing it, such as policies, procedures, rules, regulations and laws Machines: Any equipment, computers, tools, etc. required to accomplish the job Materials: Raw materials, parts, pens, paper, etc. used to produce the final product Measurements: Data generated from the process that are used to evaluate its quality Environment: The conditions, such as location, time, temperature, and culture in which the process operates Contents 1 Overview 2 Causes o 2.1 The 6 Ms (used in manufacturing industry) o 2.2 The 7 Ps (used in marketing industry) o 2.3 The 5 Ss (used in service industry) o 2.4 5 W 3 Criticism 4 See also 5 References o 5.1 Further reading 6 External links
  • 2.
    Overview Ishikawa diagram, infishbone shape, showing factors of Equipment, Process, People, Materials, Environment and Management, all affecting the overall problem. Smaller arrows connect the sub-causes to major causes.
  • 3.
    Causes Causes in thediagram are often categorized, such as to the 6 M's, described below. Cause-and-effect diagrams can reveal key relationships among various variables, and the possible causes provide additional insight into process behavior. Causes can be derived from brainstorming sessions. These groups can then be labeled as categories of the fishbone. They will typically be one of the traditional categories mentioned above but may be something unique to the application in a specific case. Causes can be traced back to root causes with the 5 Whys technique. The 6 Ms (used in manufacturing industry) Machine (technology) Method (process) Material (Includes Raw Material, Consumables and Information.) Man Power (physical work)/Mind Power (brain work) Measurement (Inspection) Milieu/Mother Nature (Environment) The 7 Ps (used in marketing industry) Product=Service Price Place Promotion People/personnel Process Physical Evidence
  • 4.
    The 5 Ss(used in service industry) Samples Scheme Synchronous Skin Search 5 W Where What When Who Why Criticism In a discussion of the nature of a cause it is customary to distinguish between necessary and sufficient conditions for the occurrence of an event. A necessary condition for the occurrence of a specified event is a circumstance in whose absence the event cannot occur. A sufficient set of conditions is a situation/circumstance in whose presence the event must occur.[5] Ishikawa diagrams have been criticized for failing to make the distinction between necessary conditions and sufficient conditions. It seems that Ishikawa was not even aware of this distinction.[6]