Downloaded 105 times
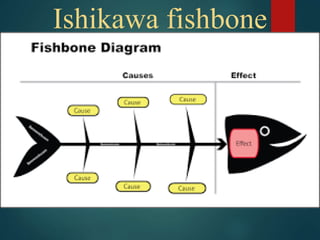


An Ishikawa diagram, also known as a fishbone diagram or cause-and-effect diagram, is a tool for identifying potential factors that cause an overall effect. It visually displays the potential causes for a specific problem or event, with major categories and sub-branches extending from the problem like fish bones. Kaoru Ishikawa popularized the fishbone diagram in the 1960s to help identify root causes of quality issues in manufacturing. The diagram considers all possible causes rather than just the obvious ones and groups causes to identify sources of variation.