Downloaded 759 times
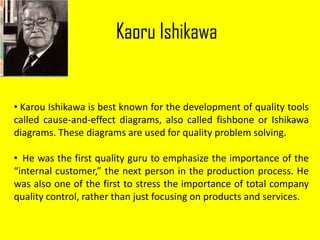
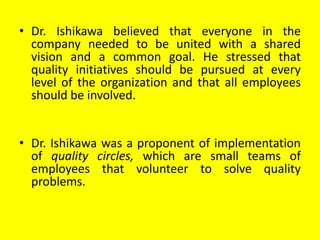
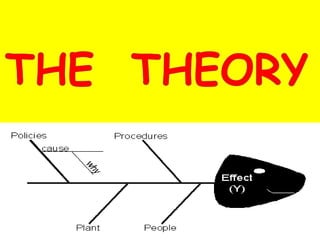
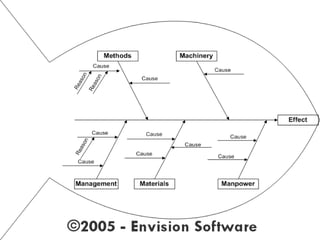

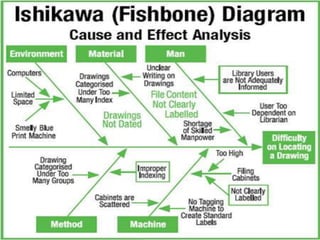
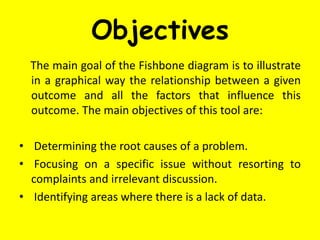
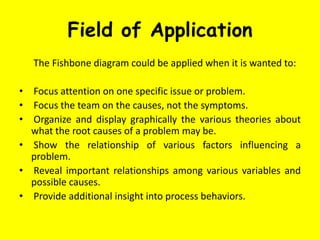
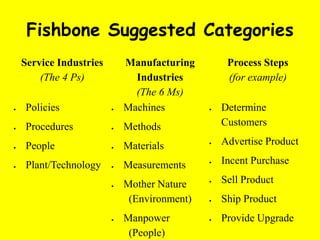
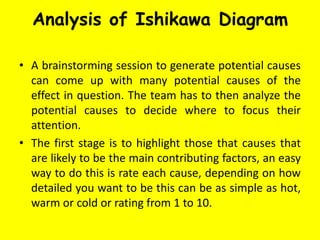

This document provides information about Ishikawa diagrams, also known as fishbone diagrams or cause-and-effect diagrams. It discusses how Kaoru Ishikawa developed these diagrams to help identify root causes of quality problems. The document outlines the key components and objectives of an Ishikawa diagram, including determining root causes, focusing on a specific issue, and showing relationships between various factors influencing a problem. It also provides examples of categories that can be used in an Ishikawa diagram and the benefits of using this tool for problem analysis and driving continuous process improvement.


![7 qc tools training material[1]](https://cdn.slidesharecdn.com/ss_thumbnails/7qctoolstrainingmaterial1-120925054558-phpapp02-thumbnail.jpg?width=640&height=640&fit=bounds)


![Qcl 14-v3 [cause effect diagram-poor placement of students]-[banasthali unive...](https://cdn.slidesharecdn.com/ss_thumbnails/qcl-14-v3causeeffectdiagram-poorplacementofstudentsbanasthaliuniversityanshuverma-150110071924-conversion-gate01-thumbnail.jpg?width=640&height=640&fit=bounds)


