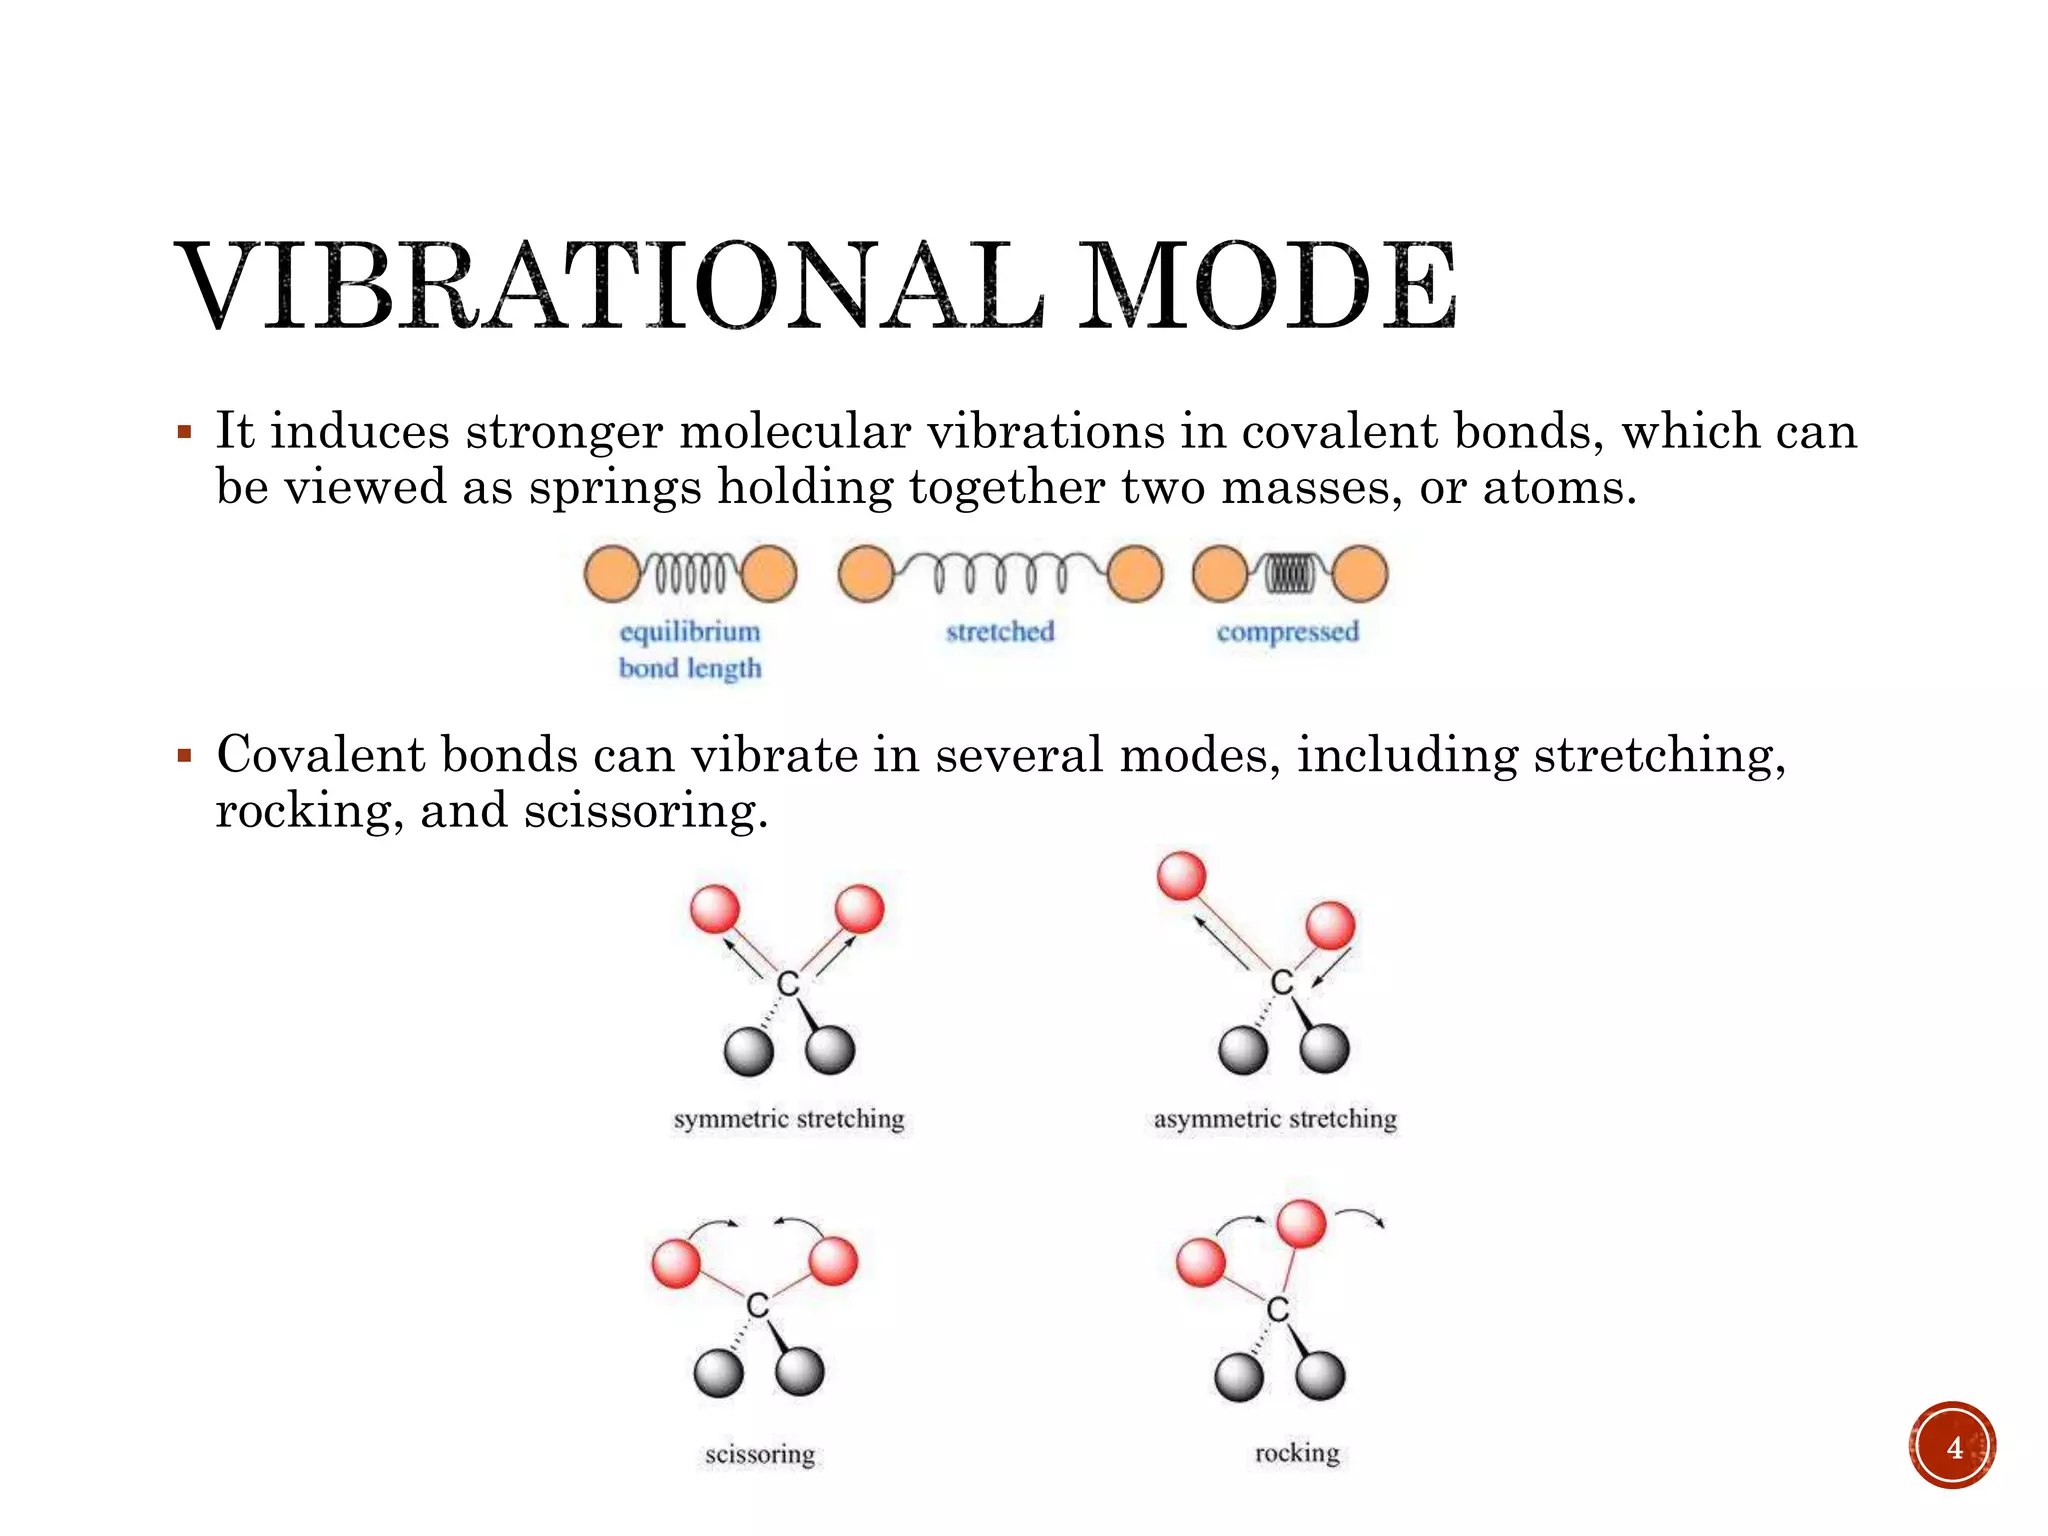
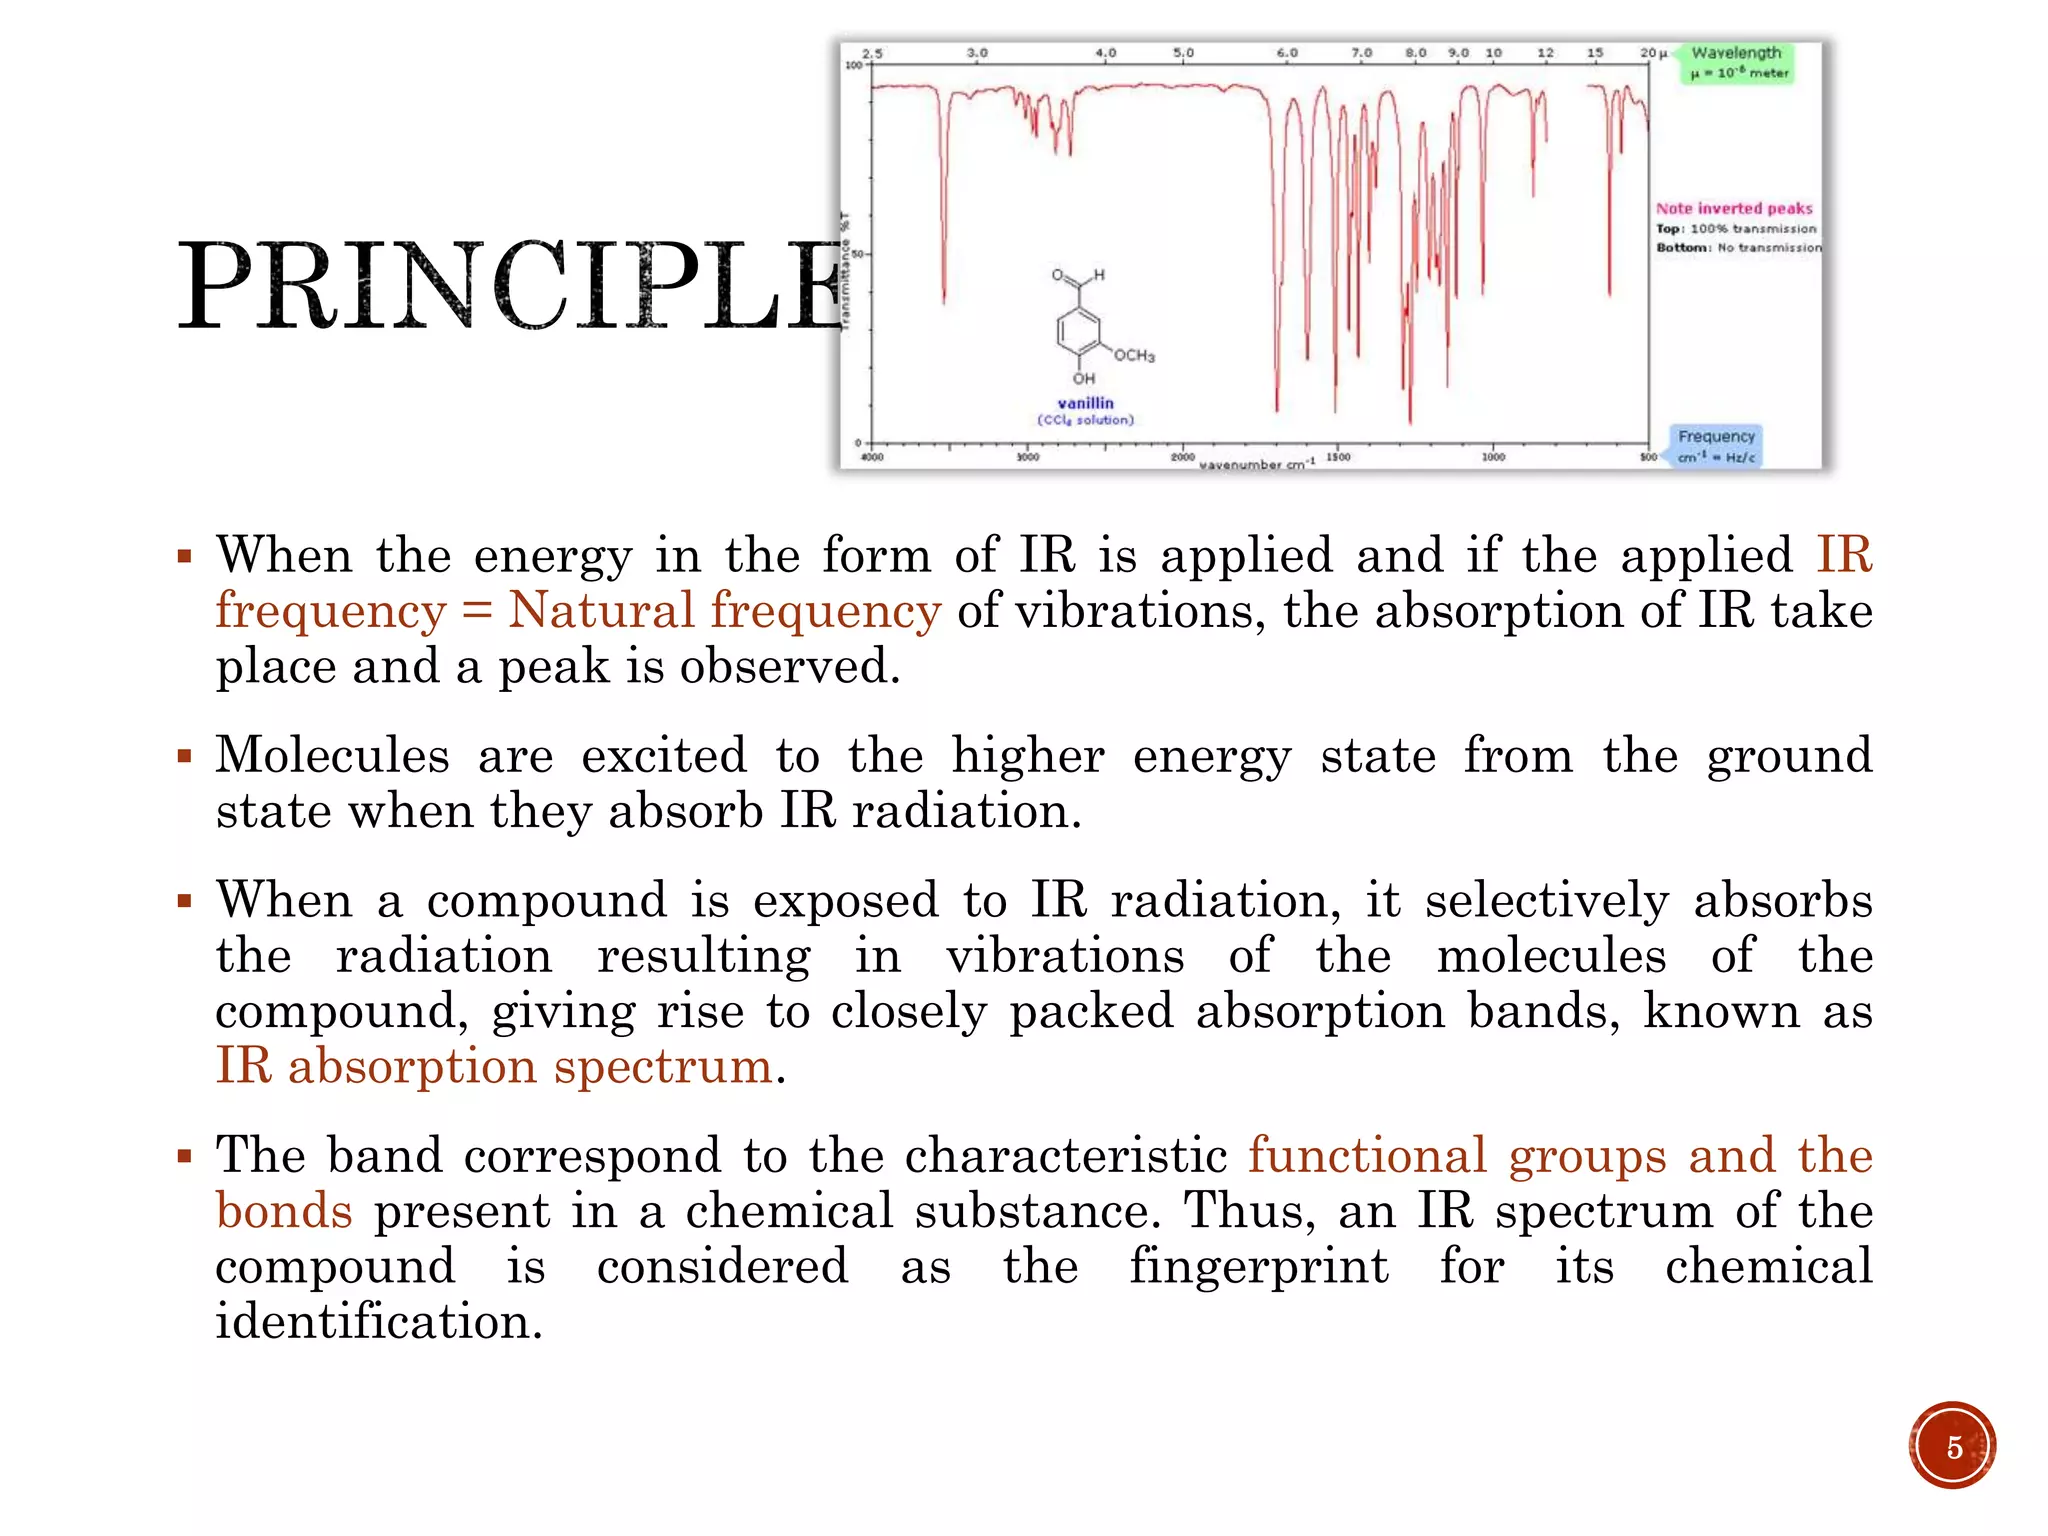
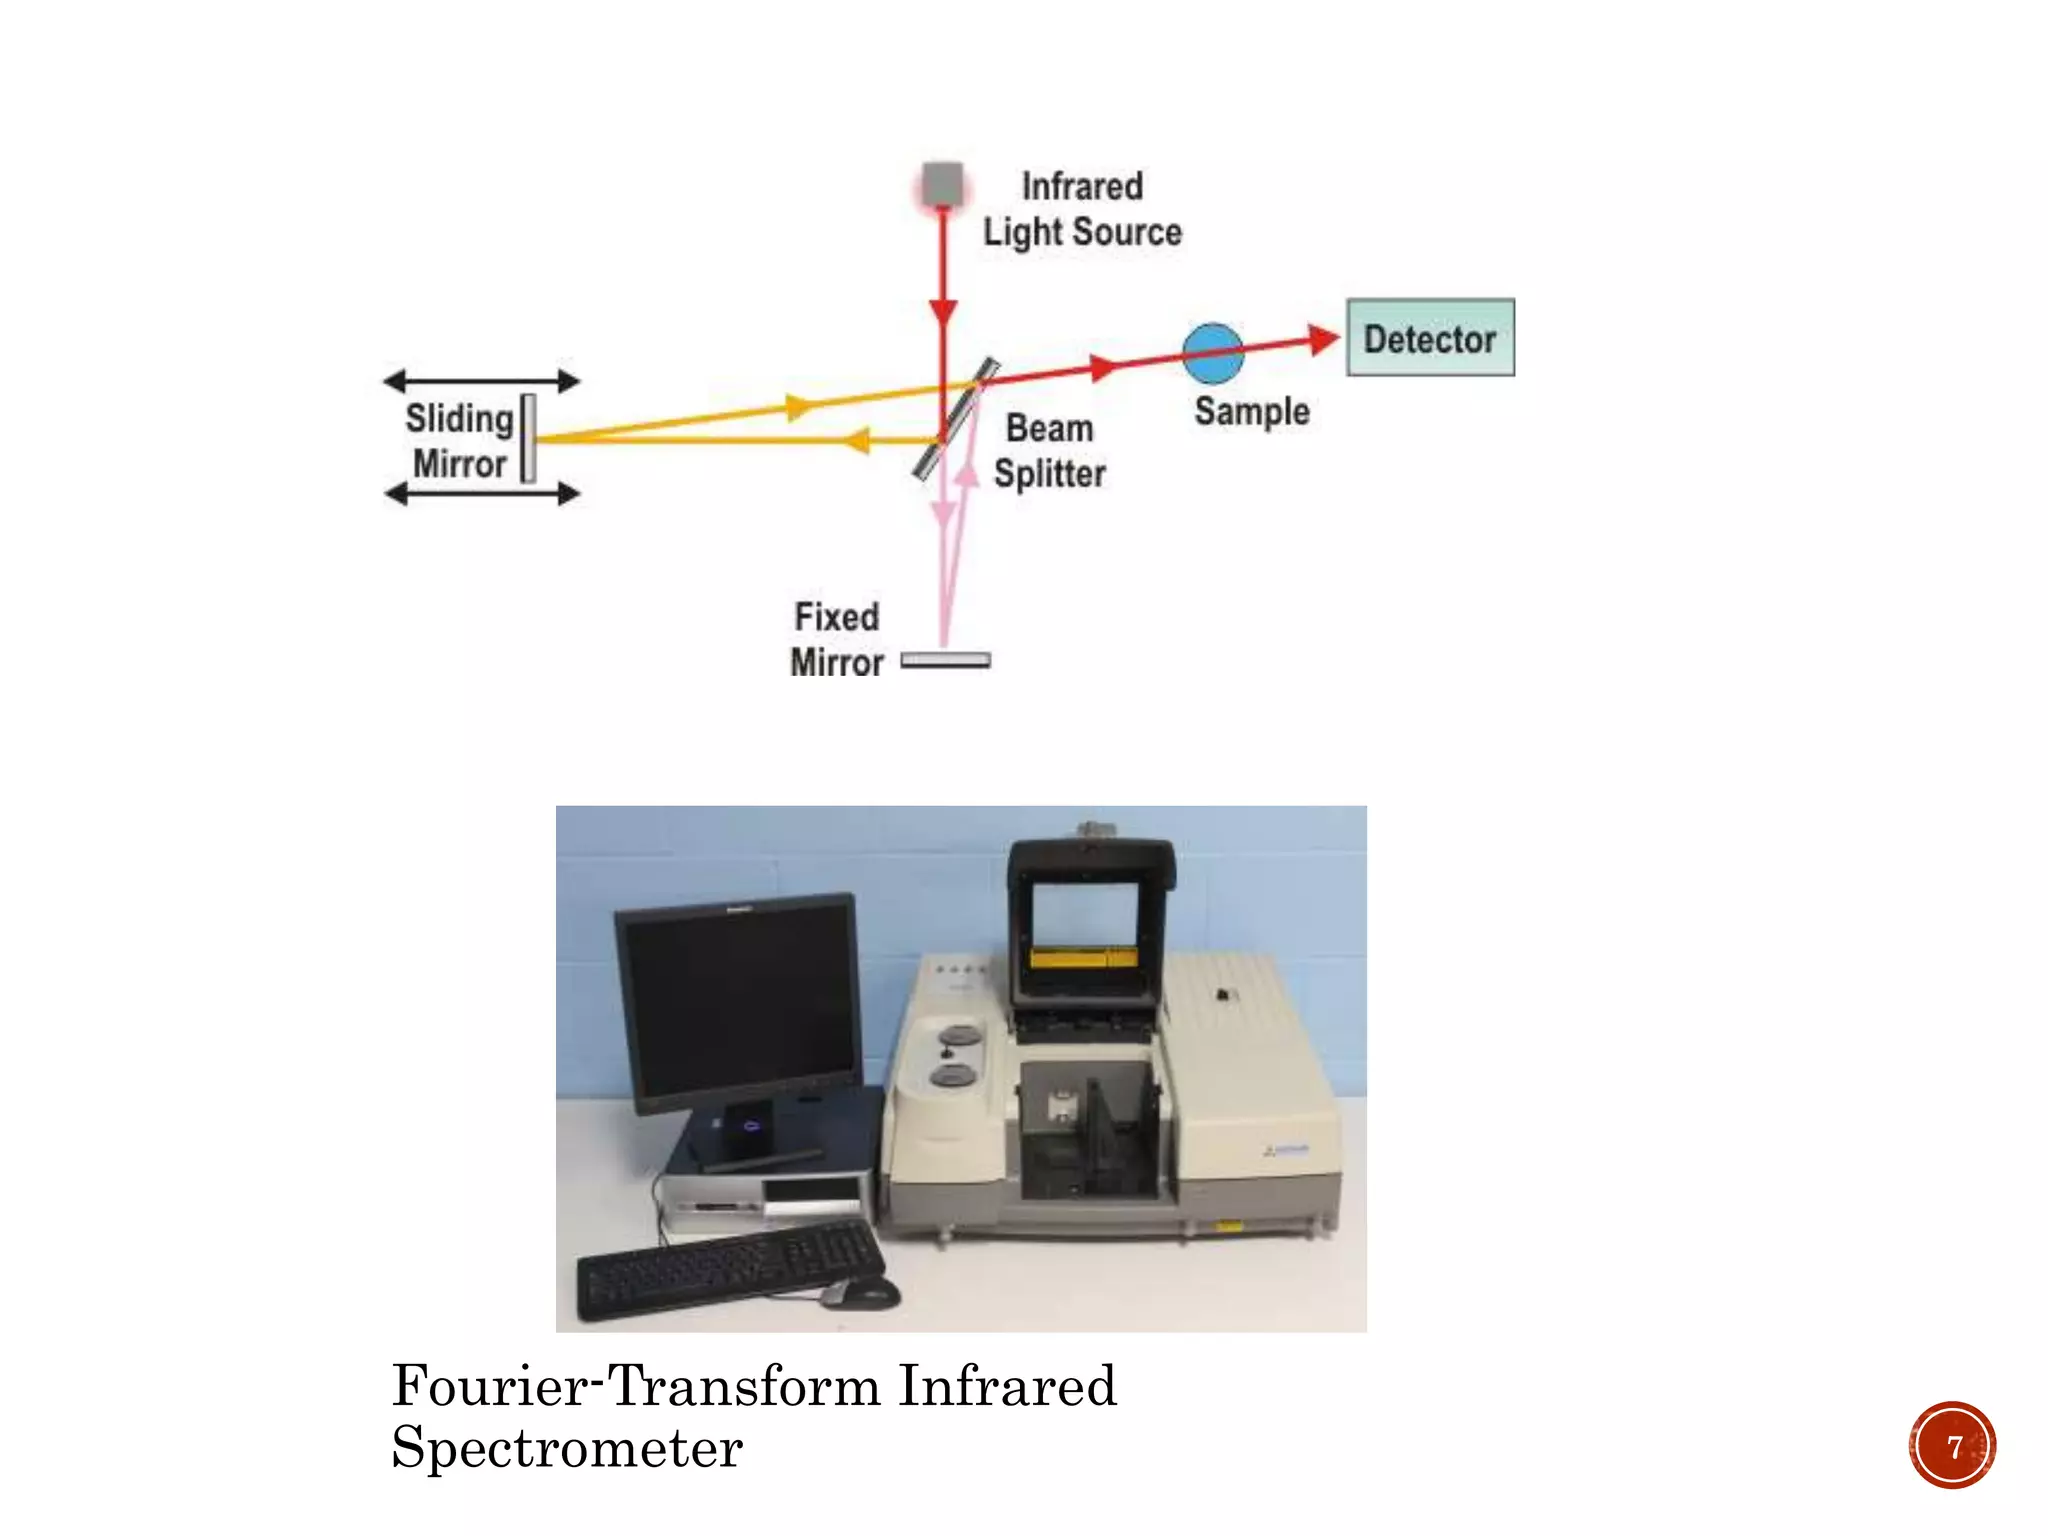
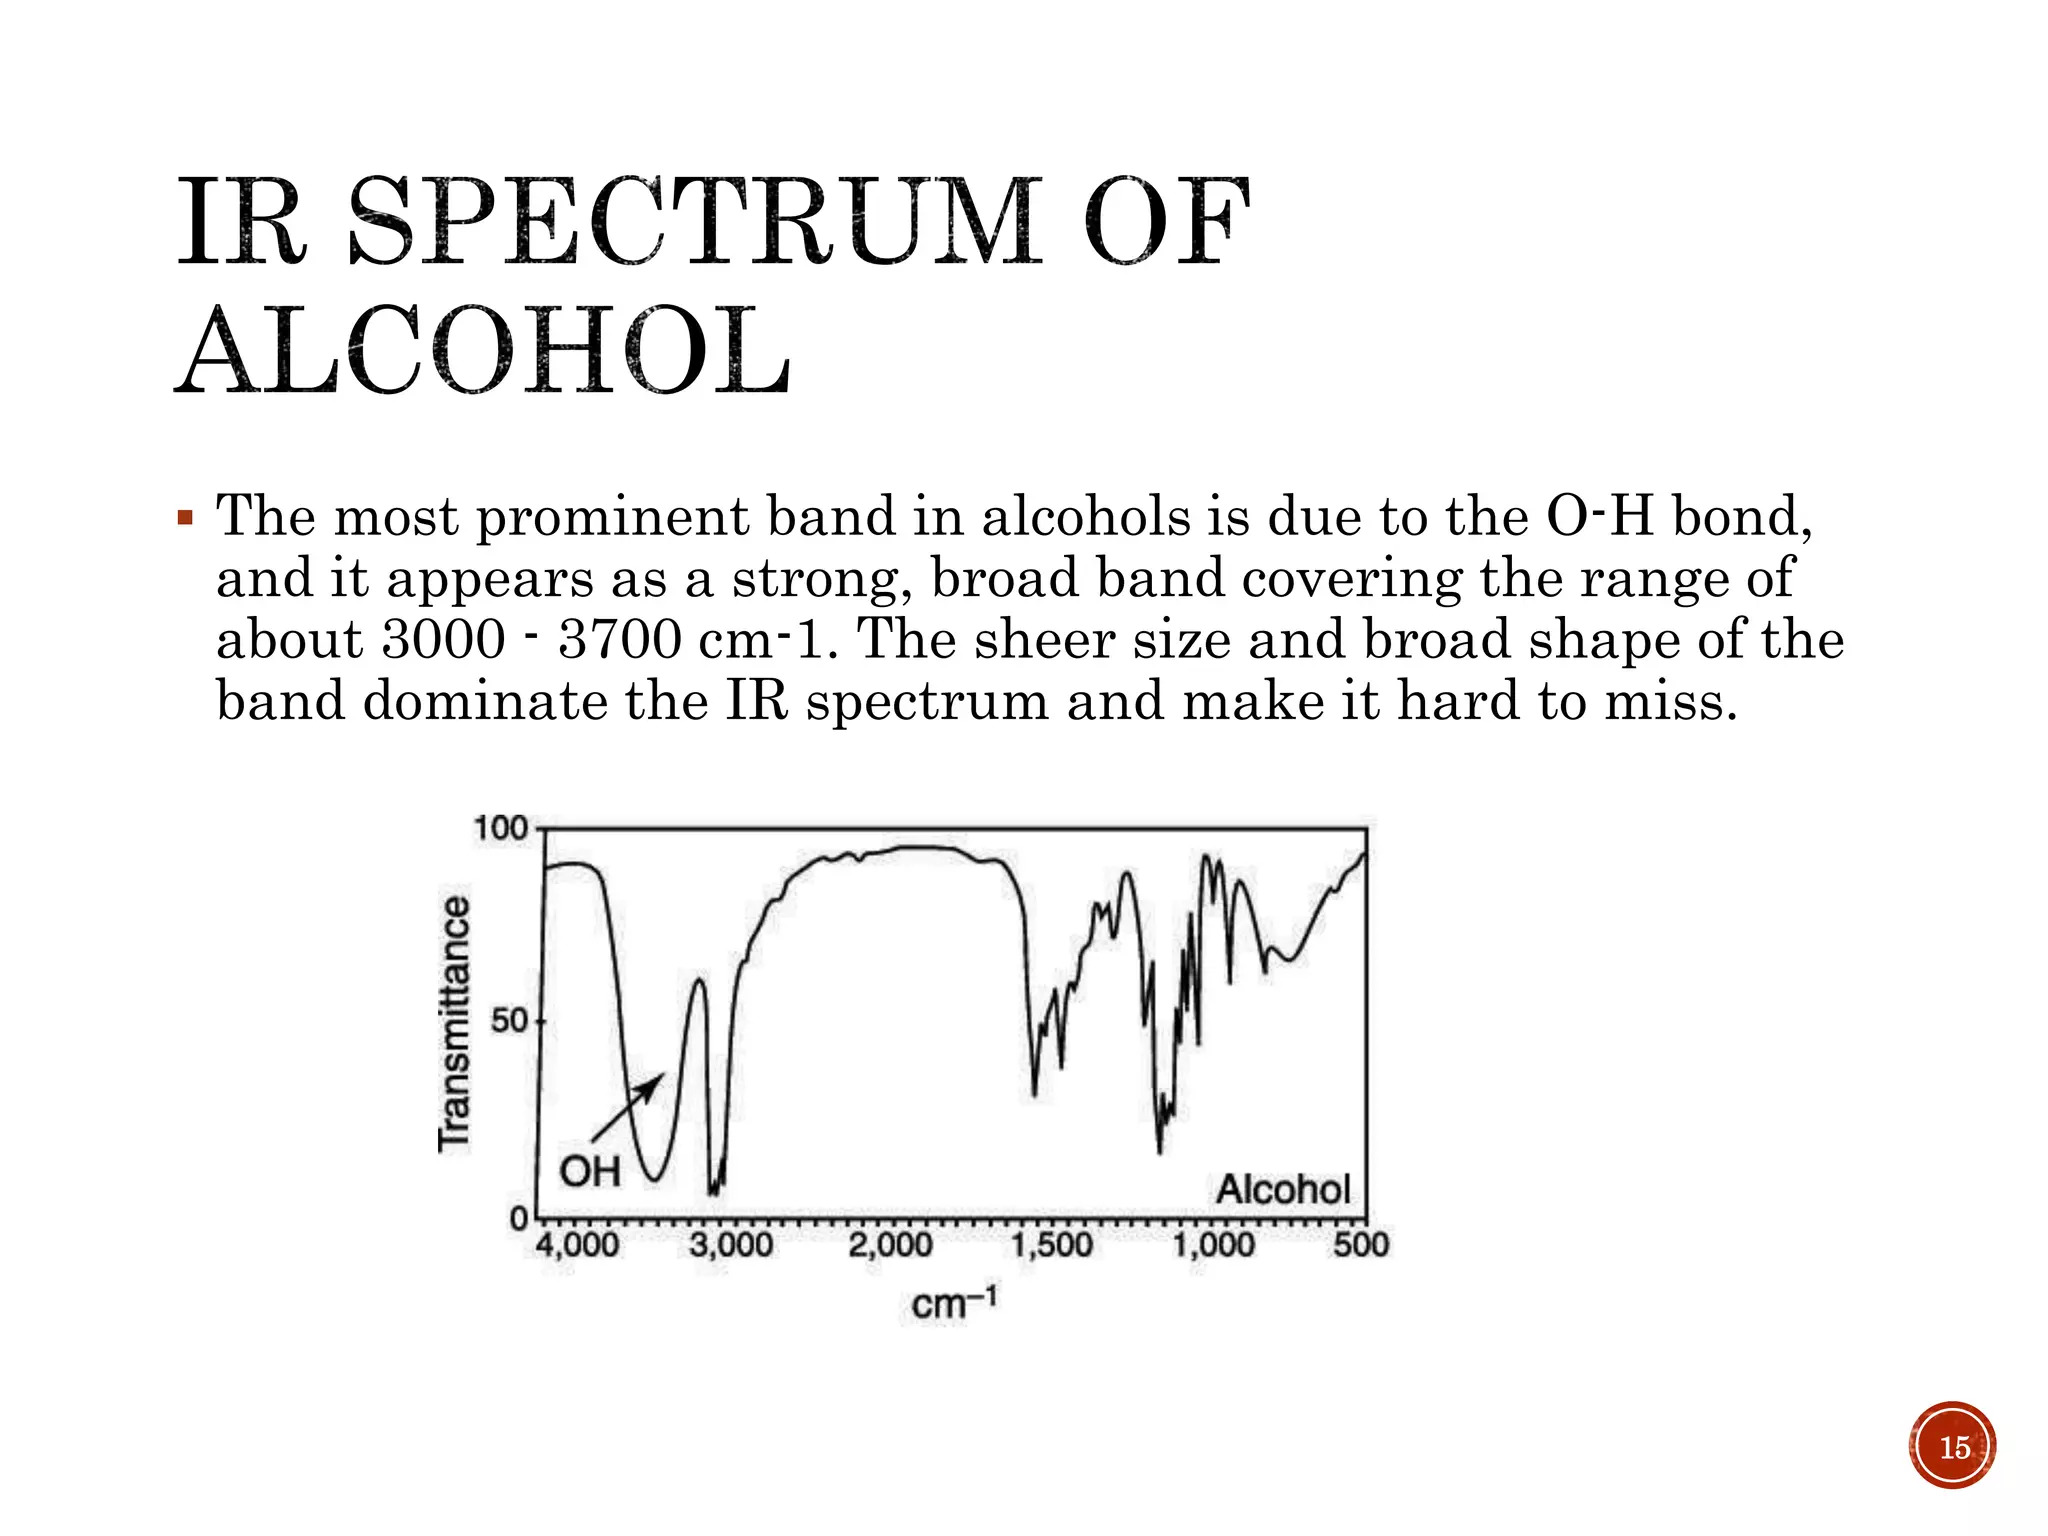
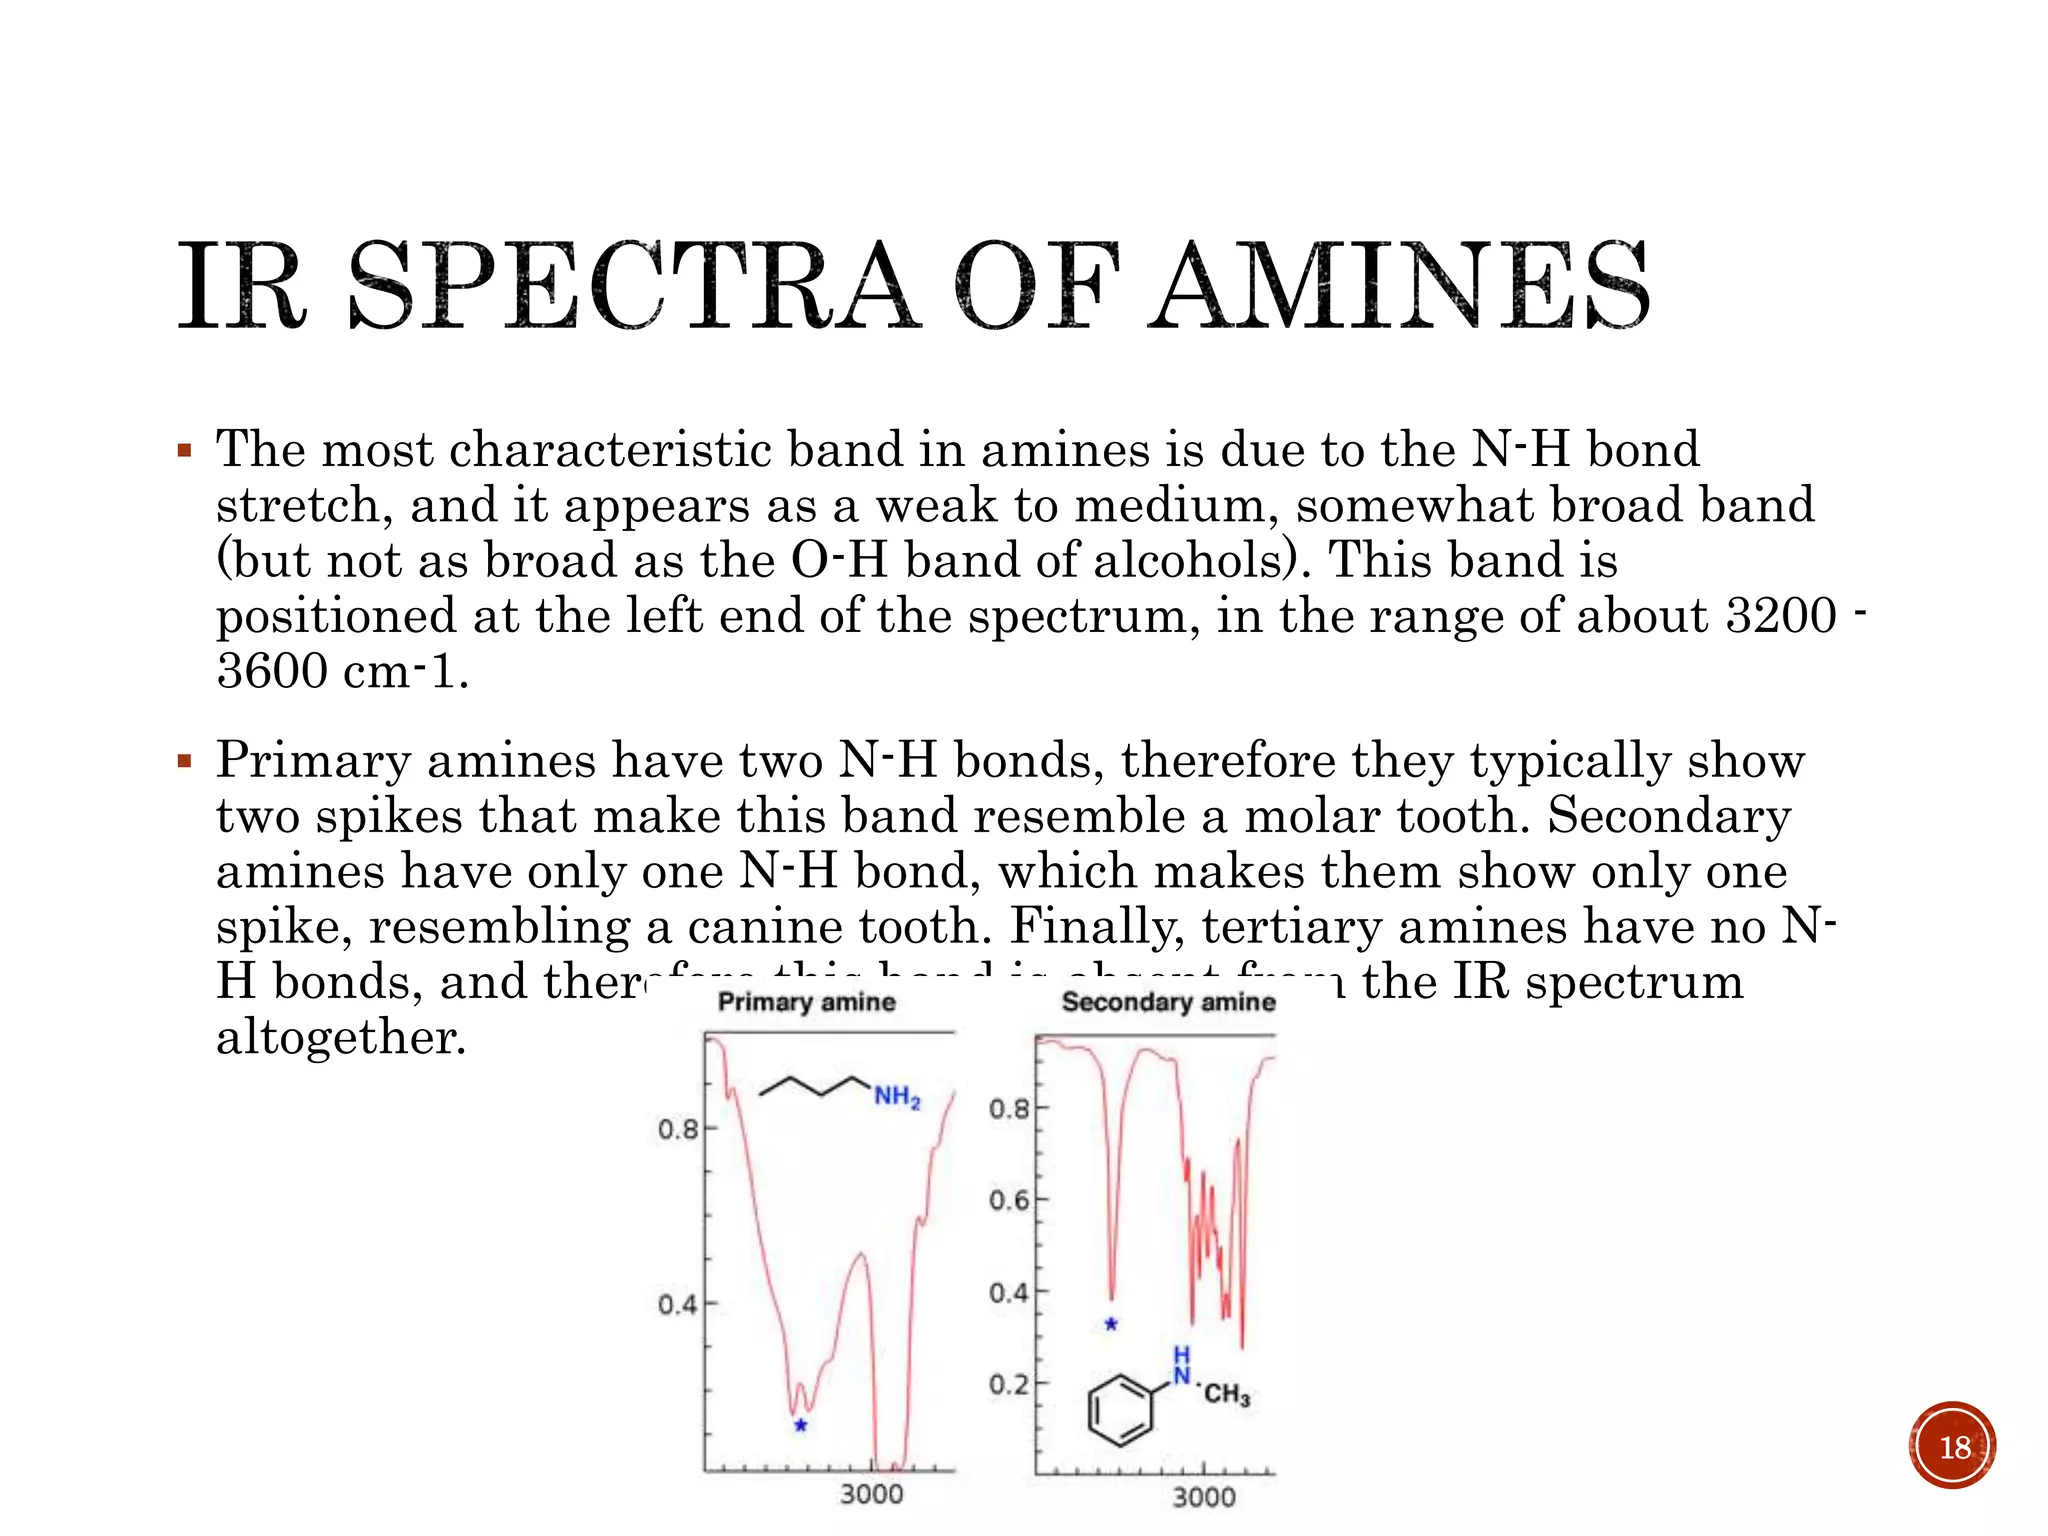
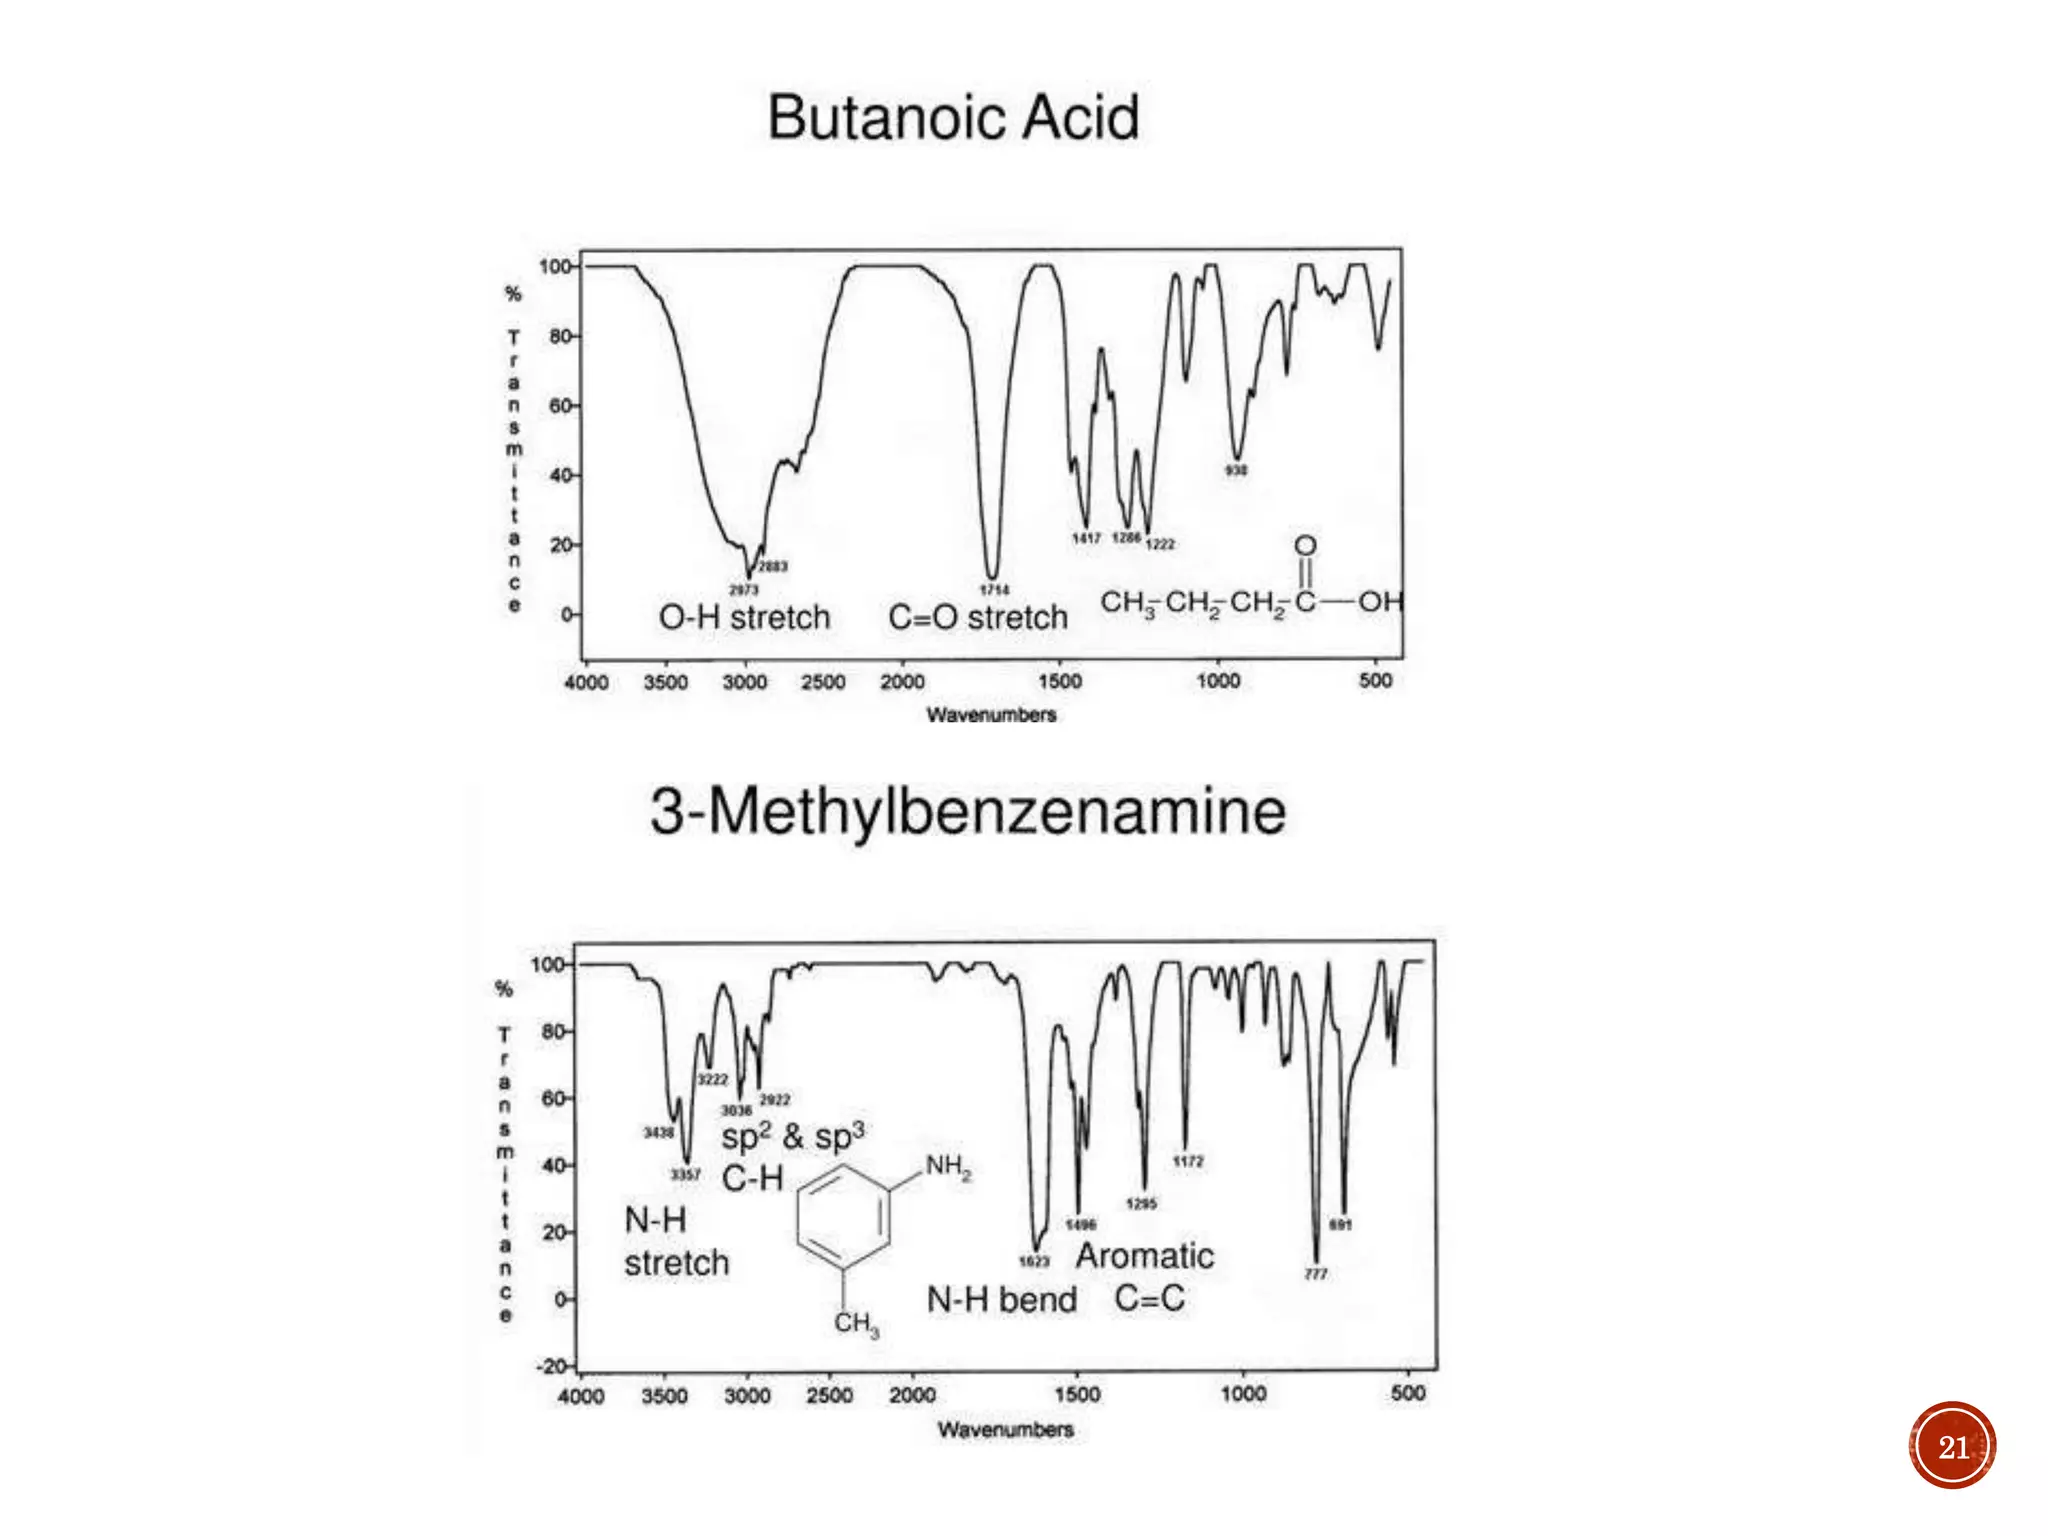
SlideShare a Scribd company logo
1 of 33
KUMARI NEHA
Ph.D. (RESEARCH SCHOLAR)
DEPARTMENT OF PHARMACEUTICAL
CHEMISTRY
1
 Introduction
 Vibrational mode
 Principle
 Instrumentation
 IR Bands
 Interpretation
 Examples
 Uses and applications
 Advantages & Disadvantages
 References
2
 Infrared (IR) spectroscopy or vibrational spectroscopy is an analytical
technique that takes advantage of the vibrational transitions of a
molecule.
 It is one of the most common and widely used spectroscopic
techniques employed mainly by inorganic and organic chemists due to
its usefulness in determining functional groups of compounds and
identifying them.
 It is a method of measurement of the extent, at a various wave
numbers, of absorption of infrared radiation when it passes through a
layer of substances.
 Intensity and frequency of samples absorption are depicted in a two-
dimensional plot called a spectrum. Intensity is generally reported in
terms of absorbance - the amount of light absorbed by a sample, or
percent transmittance – i.e. the amount of light, which passes
through it.
3
 It induces stronger molecular vibrations in covalent bonds, which can
be viewed as springs holding together two masses, or atoms.
 Covalent bonds can vibrate in several modes, including stretching,
rocking, and scissoring.
4
 When the energy in the form of IR is applied and if the applied IR
frequency = Natural frequency of vibrations, the absorption of IR take
place and a peak is observed.
 Molecules are excited to the higher energy state from the ground
state when they absorb IR radiation.
 When a compound is exposed to IR radiation, it selectively absorbs
the radiation resulting in vibrations of the molecules of the
compound, giving rise to closely packed absorption bands, known as
IR absorption spectrum.
 The band correspond to the characteristic functional groups and the
bonds present in a chemical substance. Thus, an IR spectrum of the
compound is considered as the fingerprint for its chemical
identification.
5
 The method or technique of infrared spectroscopy is conducted with
an instrument called an infrared spectrometer (or spectrophotometer)
to produce an infrared spectrum.
 Infrared (IR) spectrometers measure the interaction of IR radiation
with samples. The FTIR spectrometer measures the frequencies at
which the samples absorb the radiation, and the intensities of the
absorptions.
 The main parts of IR spectrometer are as follows:
1.Radiation source
2.Sample cells and sampling of substances
3.Monochromators
4.Detectors
5.Recorder
6
Fourier-Transform Infrared
Spectrometer 7
 IR bands can be classified as strong (s), medium (m), or weak
(w), depending on their relative intensities in the infrared
spectrum. A strong band covers most of the y-axis. A medium
band falls to about half of the y-axis, and a weak band falls to
about one third or less of the y-axis.
8
 The typical IR absorption range for polar covalent bonds is
600 - 4000 cm-1. The graph shows the regions of the spectrum
where the following types of bonds normally absorb. For
example a sharp band around 2200-2400 cm-1 would indicate
the possible presence of a C-N or a C-C triple bond.
9
10
 Although the entire IR spectrum can be used as a fingerprint for the
purposes of comparing molecules, the 600 - 1400 cm-1 range is called
the fingerprint region. This is normally a complex area showing many
bands, frequently overlapping each other. This complexity limits its
use to that of a fingerprint, and should be ignored by beginners when
analyzing the spectrum. As a student, you should focus your analysis
on the rest of the spectrum, that is the region to the left of 1400 cm-1.
11
 Alkanes have no functional groups. Their IR spectrum displays only
C-C and C-H bond vibrations. Of these the most useful are the C-H
bands, which appear around 3000 cm-1.
 Alkenes also show sharp, medium bands corresponding to the C=C
bond stretching vibration at about 1600-1700 cm-1. Some alkenes
might also show a band for the =C-H bond stretch, appearing around
3080 cm-1 as shown below.
12
 Alkynes displays as a sharp, weak band at about 2100 cm-1. The
reason it’s weak is because the triple bond is not very polar. Terminal
alkynes, that is to say those where the triple bond is at the end of a
carbon chain, have C-H bonds involving the sp carbon (the carbon that
forms part of the triple bond). Therefore they may also show a sharp,
weak band at about 3300 cm-1 corresponding to the C-H stretch.
13
 In a manner very similar to alkynes, nitriles show a prominent band
around 2250 cm-1 caused by the CN triple bond. This band has a
sharp, pointed shape just like the alkyne C-C triple bond, but because
the CN triple bond is more polar, this band is stronger than in
alkynes.
14
 The most prominent band in alcohols is due to the O-H bond,
and it appears as a strong, broad band covering the range of
about 3000 - 3700 cm-1. The sheer size and broad shape of the
band dominate the IR spectrum and make it hard to miss.
15
 Carbonyl compounds are those that contain the C=O functional
group. In aldehydes, this group is at the end of a carbon chain,
whereas in ketones it’s in the middle of the chain. Aldehydes and
ketones show a strong, prominent, stake-shaped band around 1710 -
1720 cm-1 (due to the highly polar C=O bond).
 Aldehydes also contain a C-H bond to the sp2 carbon of the C=O
bond, they also show a pair of medium strength bands positioned
about 2700 and 2800 cm-1. These bands are missing in the spectrum
of a ketone because the sp2 carbon of the ketone lacks the C-H bond.
16
 A carboxylic acid functional group combines the features of
alcohols and ketones because it has both the O-H bond and the
C=O bond. Therefore carboxylic acids show a very strong and
broad band covering a wide range between 2800 and 3500 cm-
1 for the O-H stretch. At the same time they also show the
stake-shaped band in the middle of the spectrum around 1710
cm-1 corresponding to the C=O stretch.
17
 The most characteristic band in amines is due to the N-H bond
stretch, and it appears as a weak to medium, somewhat broad band
(but not as broad as the O-H band of alcohols). This band is
positioned at the left end of the spectrum, in the range of about 3200 -
3600 cm-1.
 Primary amines have two N-H bonds, therefore they typically show
two spikes that make this band resemble a molar tooth. Secondary
amines have only one N-H bond, which makes them show only one
spike, resembling a canine tooth. Finally, tertiary amines have no N-
H bonds, and therefore this band is absent from the IR spectrum
altogether.
18
 The amide functional group combines the features of amines and
ketones because it has both the N-H bond and the C=O bond.
Therefore amides show a very strong, somewhat broad band at the
left end of the spectrum, in the range between 3100 and 3500 cm-1 for
the N-H stretch. At the same time they also show the stake-shaped
band in the middle of the spectrum around 1710 cm-1 for the C=O
stretch. As with amines, primary amides show two spikes, whereas
secondary amides show only one spike.
19
20
21
22
Dibutyl ether
23
24
25
26
27
28
 Chemical Analysis: Testing Pill Quality (Near-infrared spectroscopy
(NIR) to make a prediction regarding quick dissolution of pills inside
the body.
 Protein characterization
 Nanoscale semiconductor analysis
 Space exploration.
 Analysis of gaseous, liquid or solid samples
 Identification of compounds.(Discovery of new chemical compounds )
 Information regarding functional groups of molecules and
constitution of molecules can be deduced from IR spectrum
 It is also used in forensic analysis in both criminal and civil cases, for
example in identifying polymer degradation. 29
 Advantages
 It's cheap and fast compared to things like NMR.
 It also works for a wide variety of samples and can detect things
very strongly, whereas similar techniques like Raman spectroscopy
are weaker.
 Disadvantages
 Sample preparation is time consuming and that it can't give
information as detailed as other techniques such as NMR.
 It's also a destructive analysis method and therefore precious or
scarce sample should be analyzed by a non-destructive method
such as Raman.
 It's also qualitative rather than quantitative and there are a lot of
compounds which are not IR active and therefore can't be detected.
30
 IR identifies the components of a sample (liquid, solid or gas).
Infrared (IR) spectrometers measure the interaction of IR radiation
with samples. The FTIR spectrometer measures the frequencies at
which the samples absorb the radiation, and the intensities of the
absorptions. Intensity and frequency of samples absorption are
depicted in a two-dimensional plot called a spectrum.
 Intensity is generally reported in terms of absorbance - the amount of
light absorbed by a sample, or percent transmittance – i.e. the
amount of light, which passes through it. What makes up an
unknown sample, and how much of each component is present in that
sample, can be valuable information supplied by this technique. Its
many applications include research and development of new
products.
31
 https://commons.wikimedia.org/wiki/File:IR-spectroscopy-
sample.svg
 https://ruby-sapphire.com/index.php/about/10-articles/810-ftir-
intrigue
 https://www.dummies.com/education/science/chemistry/how-to-
identify-carbonyls-alkenes-alkynes-and-aromatics-in-the-ir-
spectrum/
 https://orgspectroscopyint.blogspot.com/2014/12/infrared-
spectroscopy.html
32
THANK YOU
33

More Related Content

What's hot

Raman fluorescencespec
Raman fluorescencespecRaman fluorescencespec
Raman fluorescencespec
Archa Dave
 

What's hot (18)

CHM260 - UV-VIS
CHM260 - UV-VISCHM260 - UV-VIS
CHM260 - UV-VIS
 
UV VISIBLE REFLECTANCESPECTROSCOPY AND APPLICATION
UV VISIBLE REFLECTANCESPECTROSCOPY AND APPLICATION UV VISIBLE REFLECTANCESPECTROSCOPY AND APPLICATION
UV VISIBLE REFLECTANCESPECTROSCOPY AND APPLICATION
 
U.V Spectroscopy
U.V SpectroscopyU.V Spectroscopy
U.V Spectroscopy
 
Ir interpretation
Ir interpretationIr interpretation
Ir interpretation
 
Advantages of raman over infrared spectroscopy
Advantages of raman over infrared spectroscopyAdvantages of raman over infrared spectroscopy
Advantages of raman over infrared spectroscopy
 
Infrared Spectroscopy and UV-Visible spectroscopy
 Infrared Spectroscopy and UV-Visible spectroscopy Infrared Spectroscopy and UV-Visible spectroscopy
Infrared Spectroscopy and UV-Visible spectroscopy
 
Prabhakar singh ii sem-paper-ir spectroscopy & fluorimetry
Prabhakar singh  ii sem-paper-ir spectroscopy & fluorimetryPrabhakar singh  ii sem-paper-ir spectroscopy & fluorimetry
Prabhakar singh ii sem-paper-ir spectroscopy & fluorimetry
 
Principle and instrumentation of UV-visible spectrophotometer.
Principle and instrumentation of UV-visible spectrophotometer.Principle and instrumentation of UV-visible spectrophotometer.
Principle and instrumentation of UV-visible spectrophotometer.
 
Analytical instruments introduction
Analytical instruments introductionAnalytical instruments introduction
Analytical instruments introduction
 
IR Spectroscopy
IR Spectroscopy IR Spectroscopy
IR Spectroscopy
 
UV Visible Spectroscopy
UV Visible SpectroscopyUV Visible Spectroscopy
UV Visible Spectroscopy
 
Ultraviolet and visible spectrophotometer and Its application in pharmaceutic...
Ultraviolet and visible spectrophotometer and Its application in pharmaceutic...Ultraviolet and visible spectrophotometer and Its application in pharmaceutic...
Ultraviolet and visible spectrophotometer and Its application in pharmaceutic...
 
Spectroscopy uv visble intro
Spectroscopy uv visble introSpectroscopy uv visble intro
Spectroscopy uv visble intro
 
Raman fluorescencespec
Raman fluorescencespecRaman fluorescencespec
Raman fluorescencespec
 
Applicationofu v-spectroscopy-120416145659-phpapp02
Applicationofu v-spectroscopy-120416145659-phpapp02Applicationofu v-spectroscopy-120416145659-phpapp02
Applicationofu v-spectroscopy-120416145659-phpapp02
 
uv -visible spectroscopy
 uv -visible spectroscopy uv -visible spectroscopy
uv -visible spectroscopy
 
Application of u.v. spectroscopy
Application of u.v. spectroscopyApplication of u.v. spectroscopy
Application of u.v. spectroscopy
 
Spectroscopy of uv visible
Spectroscopy of uv visibleSpectroscopy of uv visible
Spectroscopy of uv visible
 

Similar to Ir

Fourier transform infrared spectroscopy (FTIR) Likhith K
Fourier transform infrared spectroscopy (FTIR) Likhith KFourier transform infrared spectroscopy (FTIR) Likhith K
Fourier transform infrared spectroscopy (FTIR) Likhith K
LIKHITHK1
 

Similar to Ir (20)

Unit 2 (3).pptx
Unit 2 (3).pptxUnit 2 (3).pptx
Unit 2 (3).pptx
 
Infrared Spectroscopy (IR)
Infrared Spectroscopy (IR)Infrared Spectroscopy (IR)
Infrared Spectroscopy (IR)
 
Ir spectroscopy
Ir spectroscopyIr spectroscopy
Ir spectroscopy
 
IR SPECTROSCOPY
IR SPECTROSCOPYIR SPECTROSCOPY
IR SPECTROSCOPY
 
Presentation2
Presentation2Presentation2
Presentation2
 
Infrared spectroscopy
Infrared spectroscopyInfrared spectroscopy
Infrared spectroscopy
 
IR Spectroscopy_2022.pptx
IR Spectroscopy_2022.pptxIR Spectroscopy_2022.pptx
IR Spectroscopy_2022.pptx
 
INFRARED(IR) SPECTROSCOPY OF NATURAL PRODUCTS
INFRARED(IR) SPECTROSCOPY OF NATURAL PRODUCTSINFRARED(IR) SPECTROSCOPY OF NATURAL PRODUCTS
INFRARED(IR) SPECTROSCOPY OF NATURAL PRODUCTS
 
I R spectroscopy & its application
I R spectroscopy & its application I R spectroscopy & its application
I R spectroscopy & its application
 
IR Spectroscopy.pptx
IR Spectroscopy.pptxIR Spectroscopy.pptx
IR Spectroscopy.pptx
 
Ir
IrIr
Ir
 
Infra red spectroscopy protein analysis
Infra red spectroscopy protein analysisInfra red spectroscopy protein analysis
Infra red spectroscopy protein analysis
 
IR SPECTROSCOPY
IR SPECTROSCOPYIR SPECTROSCOPY
IR SPECTROSCOPY
 
Turbidity usp
Turbidity uspTurbidity usp
Turbidity usp
 
Application of ir
Application of irApplication of ir
Application of ir
 
Visible and ultraviolet spectroscopy
Visible and ultraviolet spectroscopyVisible and ultraviolet spectroscopy
Visible and ultraviolet spectroscopy
 
Fourier transform infrared spectroscopy (FTIR) Likhith K
Fourier transform infrared spectroscopy (FTIR) Likhith KFourier transform infrared spectroscopy (FTIR) Likhith K
Fourier transform infrared spectroscopy (FTIR) Likhith K
 
IR spectroscopy
IR spectroscopy IR spectroscopy
IR spectroscopy
 
Uvspectroscopyup 140119003106-phpapp01
Uvspectroscopyup 140119003106-phpapp01Uvspectroscopyup 140119003106-phpapp01
Uvspectroscopyup 140119003106-phpapp01
 
spectroscopy sidra
spectroscopy sidraspectroscopy sidra
spectroscopy sidra
 

More from Neha Kumari (6)

Narcotics & non-narcotics analgesics
Narcotics & non-narcotics analgesicsNarcotics & non-narcotics analgesics
Narcotics & non-narcotics analgesics
 
Photochemical reactions
Photochemical reactionsPhotochemical reactions
Photochemical reactions
 
Anti convulsants
Anti convulsantsAnti convulsants
Anti convulsants
 
Anti psychotics
Anti psychoticsAnti psychotics
Anti psychotics
 
Sedative and hypnotics
Sedative and hypnoticsSedative and hypnotics
Sedative and hypnotics
 
Vitamins and coenymes
Vitamins and coenymesVitamins and coenymes
Vitamins and coenymes
 

Recently uploaded

Recently uploaded (20)

Night 7k to 12k Navi Mumbai Call Girl Photo 👉 BOOK NOW 9833363713 👈 ♀️ night ...
Night 7k to 12k Navi Mumbai Call Girl Photo 👉 BOOK NOW 9833363713 👈 ♀️ night ...Night 7k to 12k Navi Mumbai Call Girl Photo 👉 BOOK NOW 9833363713 👈 ♀️ night ...
Night 7k to 12k Navi Mumbai Call Girl Photo 👉 BOOK NOW 9833363713 👈 ♀️ night ...
 
Best Rate (Patna ) Call Girls Patna ⟟ 8617370543 ⟟ High Class Call Girl In 5 ...
Best Rate (Patna ) Call Girls Patna ⟟ 8617370543 ⟟ High Class Call Girl In 5 ...Best Rate (Patna ) Call Girls Patna ⟟ 8617370543 ⟟ High Class Call Girl In 5 ...
Best Rate (Patna ) Call Girls Patna ⟟ 8617370543 ⟟ High Class Call Girl In 5 ...
 
Russian Call Girls Service Jaipur {8445551418} ❤️PALLAVI VIP Jaipur Call Gir...
Russian Call Girls Service  Jaipur {8445551418} ❤️PALLAVI VIP Jaipur Call Gir...Russian Call Girls Service  Jaipur {8445551418} ❤️PALLAVI VIP Jaipur Call Gir...
Russian Call Girls Service Jaipur {8445551418} ❤️PALLAVI VIP Jaipur Call Gir...
 
Premium Bangalore Call Girls Jigani Dail 6378878445 Escort Service For Hot Ma...
Premium Bangalore Call Girls Jigani Dail 6378878445 Escort Service For Hot Ma...Premium Bangalore Call Girls Jigani Dail 6378878445 Escort Service For Hot Ma...
Premium Bangalore Call Girls Jigani Dail 6378878445 Escort Service For Hot Ma...
 
Call Girls Haridwar Just Call 8250077686 Top Class Call Girl Service Available
Call Girls Haridwar Just Call 8250077686 Top Class Call Girl Service AvailableCall Girls Haridwar Just Call 8250077686 Top Class Call Girl Service Available
Call Girls Haridwar Just Call 8250077686 Top Class Call Girl Service Available
 
Best Rate (Guwahati ) Call Girls Guwahati ⟟ 8617370543 ⟟ High Class Call Girl...
Best Rate (Guwahati ) Call Girls Guwahati ⟟ 8617370543 ⟟ High Class Call Girl...Best Rate (Guwahati ) Call Girls Guwahati ⟟ 8617370543 ⟟ High Class Call Girl...
Best Rate (Guwahati ) Call Girls Guwahati ⟟ 8617370543 ⟟ High Class Call Girl...
 
Call Girls Guntur Just Call 8250077686 Top Class Call Girl Service Available
Call Girls Guntur  Just Call 8250077686 Top Class Call Girl Service AvailableCall Girls Guntur  Just Call 8250077686 Top Class Call Girl Service Available
Call Girls Guntur Just Call 8250077686 Top Class Call Girl Service Available
 
Book Paid Powai Call Girls Mumbai 𖠋 9930245274 𖠋Low Budget Full Independent H...
Book Paid Powai Call Girls Mumbai 𖠋 9930245274 𖠋Low Budget Full Independent H...Book Paid Powai Call Girls Mumbai 𖠋 9930245274 𖠋Low Budget Full Independent H...
Book Paid Powai Call Girls Mumbai 𖠋 9930245274 𖠋Low Budget Full Independent H...
 
Pondicherry Call Girls Book Now 9630942363 Top Class Pondicherry Escort Servi...
Pondicherry Call Girls Book Now 9630942363 Top Class Pondicherry Escort Servi...Pondicherry Call Girls Book Now 9630942363 Top Class Pondicherry Escort Servi...
Pondicherry Call Girls Book Now 9630942363 Top Class Pondicherry Escort Servi...
 
Call Girls Varanasi Just Call 8250077686 Top Class Call Girl Service Available
Call Girls Varanasi Just Call 8250077686 Top Class Call Girl Service AvailableCall Girls Varanasi Just Call 8250077686 Top Class Call Girl Service Available
Call Girls Varanasi Just Call 8250077686 Top Class Call Girl Service Available
 
Best Rate (Hyderabad) Call Girls Jahanuma ⟟ 8250192130 ⟟ High Class Call Girl...
Best Rate (Hyderabad) Call Girls Jahanuma ⟟ 8250192130 ⟟ High Class Call Girl...Best Rate (Hyderabad) Call Girls Jahanuma ⟟ 8250192130 ⟟ High Class Call Girl...
Best Rate (Hyderabad) Call Girls Jahanuma ⟟ 8250192130 ⟟ High Class Call Girl...
 
Top Rated Bangalore Call Girls Richmond Circle ⟟ 9332606886 ⟟ Call Me For Ge...
Top Rated Bangalore Call Girls Richmond Circle ⟟  9332606886 ⟟ Call Me For Ge...Top Rated Bangalore Call Girls Richmond Circle ⟟  9332606886 ⟟ Call Me For Ge...
Top Rated Bangalore Call Girls Richmond Circle ⟟ 9332606886 ⟟ Call Me For Ge...
 
Call Girls Faridabad Just Call 9907093804 Top Class Call Girl Service Available
Call Girls Faridabad Just Call 9907093804 Top Class Call Girl Service AvailableCall Girls Faridabad Just Call 9907093804 Top Class Call Girl Service Available
Call Girls Faridabad Just Call 9907093804 Top Class Call Girl Service Available
 
Call Girls Kochi Just Call 8250077686 Top Class Call Girl Service Available
Call Girls Kochi Just Call 8250077686 Top Class Call Girl Service AvailableCall Girls Kochi Just Call 8250077686 Top Class Call Girl Service Available
Call Girls Kochi Just Call 8250077686 Top Class Call Girl Service Available
 
Top Quality Call Girl Service Kalyanpur 6378878445 Available Call Girls Any Time
Top Quality Call Girl Service Kalyanpur 6378878445 Available Call Girls Any TimeTop Quality Call Girl Service Kalyanpur 6378878445 Available Call Girls Any Time
Top Quality Call Girl Service Kalyanpur 6378878445 Available Call Girls Any Time
 
Call Girls Siliguri Just Call 8250077686 Top Class Call Girl Service Available
Call Girls Siliguri Just Call 8250077686 Top Class Call Girl Service AvailableCall Girls Siliguri Just Call 8250077686 Top Class Call Girl Service Available
Call Girls Siliguri Just Call 8250077686 Top Class Call Girl Service Available
 
Night 7k to 12k Chennai City Center Call Girls 👉👉 7427069034⭐⭐ 100% Genuine E...
Night 7k to 12k Chennai City Center Call Girls 👉👉 7427069034⭐⭐ 100% Genuine E...Night 7k to 12k Chennai City Center Call Girls 👉👉 7427069034⭐⭐ 100% Genuine E...
Night 7k to 12k Chennai City Center Call Girls 👉👉 7427069034⭐⭐ 100% Genuine E...
 
Top Rated Bangalore Call Girls Mg Road ⟟ 9332606886 ⟟ Call Me For Genuine S...
Top Rated Bangalore Call Girls Mg Road ⟟   9332606886 ⟟ Call Me For Genuine S...Top Rated Bangalore Call Girls Mg Road ⟟   9332606886 ⟟ Call Me For Genuine S...
Top Rated Bangalore Call Girls Mg Road ⟟ 9332606886 ⟟ Call Me For Genuine S...
 
Call Girls Bangalore Just Call 8250077686 Top Class Call Girl Service Available
Call Girls Bangalore Just Call 8250077686 Top Class Call Girl Service AvailableCall Girls Bangalore Just Call 8250077686 Top Class Call Girl Service Available
Call Girls Bangalore Just Call 8250077686 Top Class Call Girl Service Available
 
Call Girls Service Jaipur {9521753030} ❤️VVIP RIDDHI Call Girl in Jaipur Raja...
Call Girls Service Jaipur {9521753030} ❤️VVIP RIDDHI Call Girl in Jaipur Raja...Call Girls Service Jaipur {9521753030} ❤️VVIP RIDDHI Call Girl in Jaipur Raja...
Call Girls Service Jaipur {9521753030} ❤️VVIP RIDDHI Call Girl in Jaipur Raja...
 

Ir

  • 1. KUMARI NEHA Ph.D. (RESEARCH SCHOLAR) DEPARTMENT OF PHARMACEUTICAL CHEMISTRY 1
  • 2.  Introduction  Vibrational mode  Principle  Instrumentation  IR Bands  Interpretation  Examples  Uses and applications  Advantages & Disadvantages  References 2
  • 3.  Infrared (IR) spectroscopy or vibrational spectroscopy is an analytical technique that takes advantage of the vibrational transitions of a molecule.  It is one of the most common and widely used spectroscopic techniques employed mainly by inorganic and organic chemists due to its usefulness in determining functional groups of compounds and identifying them.  It is a method of measurement of the extent, at a various wave numbers, of absorption of infrared radiation when it passes through a layer of substances.  Intensity and frequency of samples absorption are depicted in a two- dimensional plot called a spectrum. Intensity is generally reported in terms of absorbance - the amount of light absorbed by a sample, or percent transmittance – i.e. the amount of light, which passes through it. 3
  • 4.  It induces stronger molecular vibrations in covalent bonds, which can be viewed as springs holding together two masses, or atoms.  Covalent bonds can vibrate in several modes, including stretching, rocking, and scissoring. 4
  • 5.  When the energy in the form of IR is applied and if the applied IR frequency = Natural frequency of vibrations, the absorption of IR take place and a peak is observed.  Molecules are excited to the higher energy state from the ground state when they absorb IR radiation.  When a compound is exposed to IR radiation, it selectively absorbs the radiation resulting in vibrations of the molecules of the compound, giving rise to closely packed absorption bands, known as IR absorption spectrum.  The band correspond to the characteristic functional groups and the bonds present in a chemical substance. Thus, an IR spectrum of the compound is considered as the fingerprint for its chemical identification. 5
  • 6.  The method or technique of infrared spectroscopy is conducted with an instrument called an infrared spectrometer (or spectrophotometer) to produce an infrared spectrum.  Infrared (IR) spectrometers measure the interaction of IR radiation with samples. The FTIR spectrometer measures the frequencies at which the samples absorb the radiation, and the intensities of the absorptions.  The main parts of IR spectrometer are as follows: 1.Radiation source 2.Sample cells and sampling of substances 3.Monochromators 4.Detectors 5.Recorder 6
  • 8.  IR bands can be classified as strong (s), medium (m), or weak (w), depending on their relative intensities in the infrared spectrum. A strong band covers most of the y-axis. A medium band falls to about half of the y-axis, and a weak band falls to about one third or less of the y-axis. 8
  • 9.  The typical IR absorption range for polar covalent bonds is 600 - 4000 cm-1. The graph shows the regions of the spectrum where the following types of bonds normally absorb. For example a sharp band around 2200-2400 cm-1 would indicate the possible presence of a C-N or a C-C triple bond. 9
  • 10. 10
  • 11.  Although the entire IR spectrum can be used as a fingerprint for the purposes of comparing molecules, the 600 - 1400 cm-1 range is called the fingerprint region. This is normally a complex area showing many bands, frequently overlapping each other. This complexity limits its use to that of a fingerprint, and should be ignored by beginners when analyzing the spectrum. As a student, you should focus your analysis on the rest of the spectrum, that is the region to the left of 1400 cm-1. 11
  • 12.  Alkanes have no functional groups. Their IR spectrum displays only C-C and C-H bond vibrations. Of these the most useful are the C-H bands, which appear around 3000 cm-1.  Alkenes also show sharp, medium bands corresponding to the C=C bond stretching vibration at about 1600-1700 cm-1. Some alkenes might also show a band for the =C-H bond stretch, appearing around 3080 cm-1 as shown below. 12
  • 13.  Alkynes displays as a sharp, weak band at about 2100 cm-1. The reason it’s weak is because the triple bond is not very polar. Terminal alkynes, that is to say those where the triple bond is at the end of a carbon chain, have C-H bonds involving the sp carbon (the carbon that forms part of the triple bond). Therefore they may also show a sharp, weak band at about 3300 cm-1 corresponding to the C-H stretch. 13
  • 14.  In a manner very similar to alkynes, nitriles show a prominent band around 2250 cm-1 caused by the CN triple bond. This band has a sharp, pointed shape just like the alkyne C-C triple bond, but because the CN triple bond is more polar, this band is stronger than in alkynes. 14
  • 15.  The most prominent band in alcohols is due to the O-H bond, and it appears as a strong, broad band covering the range of about 3000 - 3700 cm-1. The sheer size and broad shape of the band dominate the IR spectrum and make it hard to miss. 15
  • 16.  Carbonyl compounds are those that contain the C=O functional group. In aldehydes, this group is at the end of a carbon chain, whereas in ketones it’s in the middle of the chain. Aldehydes and ketones show a strong, prominent, stake-shaped band around 1710 - 1720 cm-1 (due to the highly polar C=O bond).  Aldehydes also contain a C-H bond to the sp2 carbon of the C=O bond, they also show a pair of medium strength bands positioned about 2700 and 2800 cm-1. These bands are missing in the spectrum of a ketone because the sp2 carbon of the ketone lacks the C-H bond. 16
  • 17.  A carboxylic acid functional group combines the features of alcohols and ketones because it has both the O-H bond and the C=O bond. Therefore carboxylic acids show a very strong and broad band covering a wide range between 2800 and 3500 cm- 1 for the O-H stretch. At the same time they also show the stake-shaped band in the middle of the spectrum around 1710 cm-1 corresponding to the C=O stretch. 17
  • 18.  The most characteristic band in amines is due to the N-H bond stretch, and it appears as a weak to medium, somewhat broad band (but not as broad as the O-H band of alcohols). This band is positioned at the left end of the spectrum, in the range of about 3200 - 3600 cm-1.  Primary amines have two N-H bonds, therefore they typically show two spikes that make this band resemble a molar tooth. Secondary amines have only one N-H bond, which makes them show only one spike, resembling a canine tooth. Finally, tertiary amines have no N- H bonds, and therefore this band is absent from the IR spectrum altogether. 18
  • 19.  The amide functional group combines the features of amines and ketones because it has both the N-H bond and the C=O bond. Therefore amides show a very strong, somewhat broad band at the left end of the spectrum, in the range between 3100 and 3500 cm-1 for the N-H stretch. At the same time they also show the stake-shaped band in the middle of the spectrum around 1710 cm-1 for the C=O stretch. As with amines, primary amides show two spikes, whereas secondary amides show only one spike. 19
  • 20. 20
  • 21. 21
  • 22. 22
  • 24. 24
  • 25. 25
  • 26. 26
  • 27. 27
  • 28. 28
  • 29.  Chemical Analysis: Testing Pill Quality (Near-infrared spectroscopy (NIR) to make a prediction regarding quick dissolution of pills inside the body.  Protein characterization  Nanoscale semiconductor analysis  Space exploration.  Analysis of gaseous, liquid or solid samples  Identification of compounds.(Discovery of new chemical compounds )  Information regarding functional groups of molecules and constitution of molecules can be deduced from IR spectrum  It is also used in forensic analysis in both criminal and civil cases, for example in identifying polymer degradation. 29
  • 30.  Advantages  It's cheap and fast compared to things like NMR.  It also works for a wide variety of samples and can detect things very strongly, whereas similar techniques like Raman spectroscopy are weaker.  Disadvantages  Sample preparation is time consuming and that it can't give information as detailed as other techniques such as NMR.  It's also a destructive analysis method and therefore precious or scarce sample should be analyzed by a non-destructive method such as Raman.  It's also qualitative rather than quantitative and there are a lot of compounds which are not IR active and therefore can't be detected. 30
  • 31.  IR identifies the components of a sample (liquid, solid or gas). Infrared (IR) spectrometers measure the interaction of IR radiation with samples. The FTIR spectrometer measures the frequencies at which the samples absorb the radiation, and the intensities of the absorptions. Intensity and frequency of samples absorption are depicted in a two-dimensional plot called a spectrum.  Intensity is generally reported in terms of absorbance - the amount of light absorbed by a sample, or percent transmittance – i.e. the amount of light, which passes through it. What makes up an unknown sample, and how much of each component is present in that sample, can be valuable information supplied by this technique. Its many applications include research and development of new products. 31
  • 32.  https://commons.wikimedia.org/wiki/File:IR-spectroscopy- sample.svg  https://ruby-sapphire.com/index.php/about/10-articles/810-ftir- intrigue  https://www.dummies.com/education/science/chemistry/how-to- identify-carbonyls-alkenes-alkynes-and-aromatics-in-the-ir- spectrum/  https://orgspectroscopyint.blogspot.com/2014/12/infrared- spectroscopy.html 32