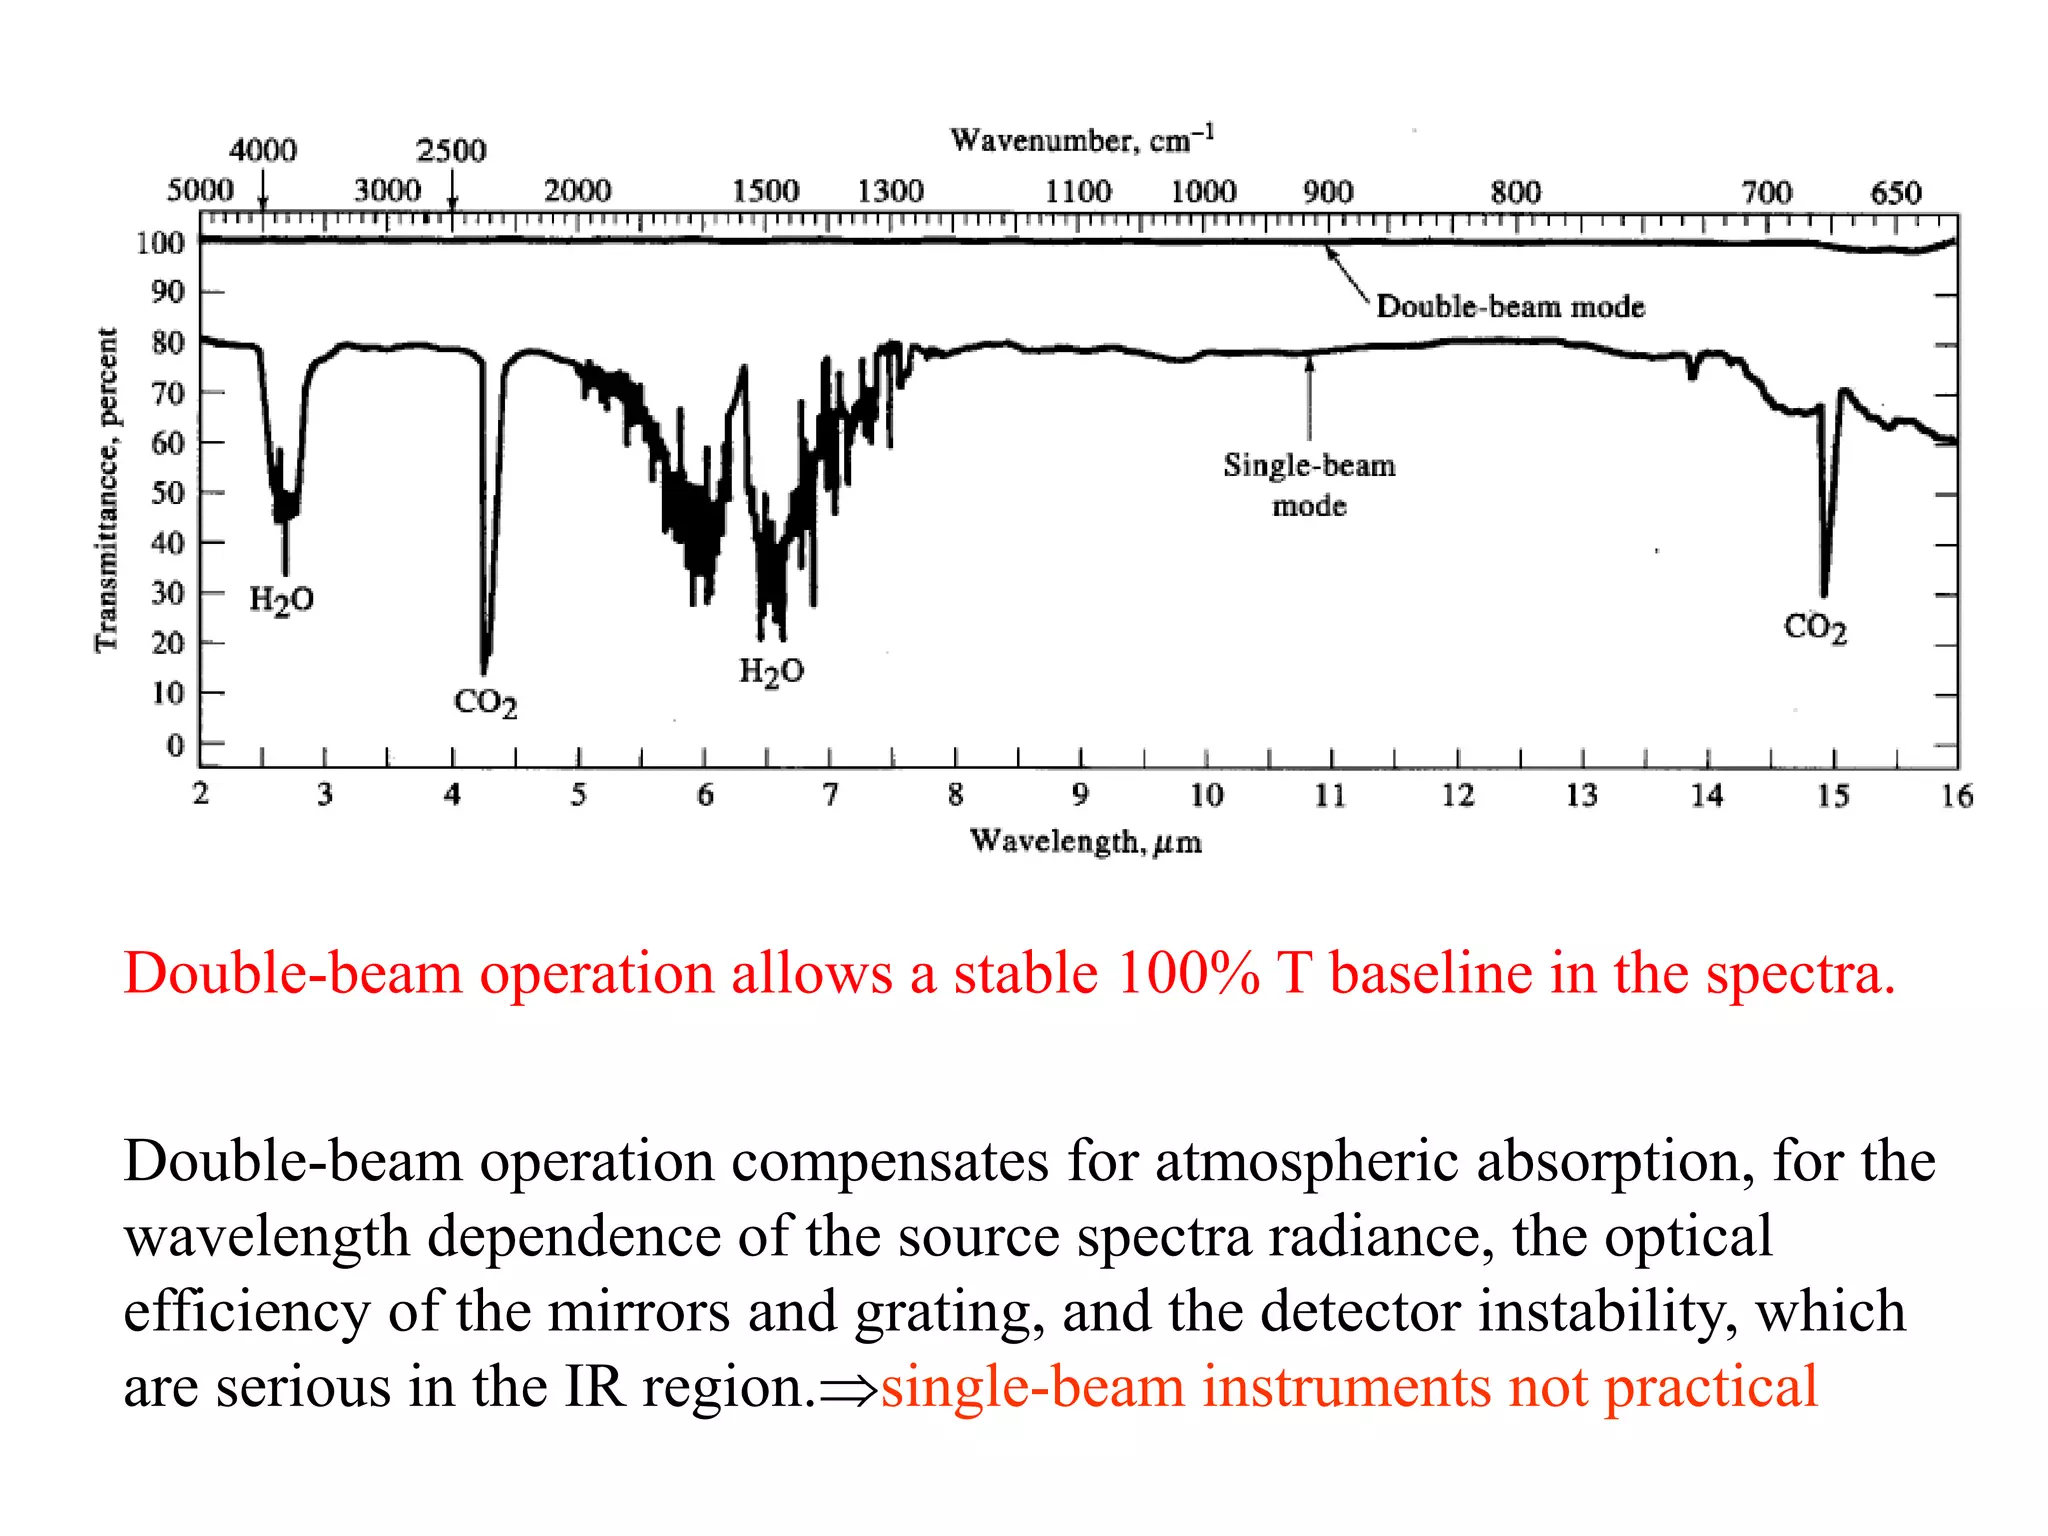
10. Factors Influence the Normal Modes
Occasionally more peaks are found than are expected
based upon the number of normal modes.
The occurrence of overtone peaks that occur at two or three
times the frequency of a fundamental peak.
In addition combination bands are sometimes encountered
when a photon excites two vibrational modes simultaneously.
The frequency of the combination band is approximately the
sum or difference of the two fundamental frequencies.
11. Vibratrional Coupling
The energy of a vibration, and thus the
wavelength of its absorption peak, may be
influenced by other vibrators in the molecule.
A number of factors influence the extent of
such coupling.
1. Strong coupling between stretching
vibrations occurs only when there is an atom
common to the two vibrations.
2. Interaction between bending vibrations
requires a common bond between the
vibrating groups.
12. …continued…
3. Coupling between a stretching and a bending vibration can occur if
the stretching bond forms one side of the angle that varies in the
bending vibration.
4. Interaction is greatest when the coupled groups have individual
energies that are approximately equal.
5. Little or no interaction is observed between groups separated by
two or more bonds.
6. Coupling requires that the vibrations be of the same symmetry
species.
Coupling of vibration is a common phenomenon.
As a result, the position of a absorption band for a given organic function group can’t
be specified exactly.
C-O stretching frequency:
MeOH: 1034 cm-1, EtOH: 1053 cm-1, BuOH: 1105 cm-1
13. Combination Bands
Combination bands are observed when more than two or more fundamental
vibrations are excited simultaneously.
One reason a combination band might occur is if a fundamental vibration does not
occur because of symmetry.
This is comparable to vibronic coupling in electronic transitions in which a
fundamental mode can be excited and allowed as a “doubly excited state.”
Combination implies addition of two frequencies, but it also possible to have a
difference band where the frequencies are subtracted.
Combination bands arise when two fundamental bands absorbing at ν1 and ν2 absorb energy
simultaneously. The resulting band will appear at (ν1 + ν2) wavenumbers.
NOTE: A practical use for understanding overtones and combination bands is applied to organic
solvents used in spectroscopy. Most organic liquids have strong overtone and combination
bands in the mid-infrared region, therefore, acetone, DMSO, or acetonitrile should only be used
in very narrow spectral regions. Solvents such at CCl4, CS2 and CDCl3 can be used above 1200 cm-
1.
14. Coupled Vibrations
Vibrations in the skeletons of molecules become coupled.
Such vibrations are not restricted to one or two bonds, but may involve a large part
of the carbon backbone and oxygen or nitrogen atoms if present.
The energy levels mix, hence resulting in the same number of vibrational modes,
but at different frequencies, and bands can no longer be assigned to one bond.
This is very common and occurs when adjacent bonds have similar frequencies.
Coupling commonly occurs between C–C stretching, C–O stretching, C–N
stretching, C–H rocking and C–H wagging motions.
A further requirement is that to be strongly coupled, the motions must be in the
same part of the molecule.
15. C—H: we expect stretching absorption frequency.
-CH2-: two absorptions (symmetric and asymmetric)
Asymmetric vibrations always occur at higher wave number compared with
symmetric). These are called coupled vibrations as these vibrations occur at
different frequencies than that required for an isolated C-H stretching.
Sometimes, it happens that two different vibrational levels have nearly the same
energy.
If such vibrations belong to the same species (i.e. -CH2-, -CH3 groups), then a mutual
perturbation of energy may occur.
It results in the shift of one towards lower frequency and the other on higher side.
It also accompanied by substantial increase in the intensity of the respective band.
16.
17. 2.5 4 5 5.5 6.1 6.5 15.4
4000 2500 2000 1800 1650 1550 650
FREQUENCY (cm-1)
WAVELENGTH (mm)
O-H C-H
N-H
C=O C=N
Very
few
bands
C=C
C-Cl
C-O
C-N
C-C
X=C=Y
(C,O,N,S)
C N
C C
N=O N=O *
How to Analyze an IR Spectrum
18. How to Analyze an IR Spectrum
• Pay the most attention to the strongest absorptions:
– -C=O
– -OH
– -NH2
– -C≡N
– -NO2
• Pay more attention to the peaks to the left of the
fingerprint region (>1250 cm-1).
19. How to Analyze an IR Spectrum
• Pay the most attention to the strongest
absorptions.
• Pay more attention to the peaks to the left of
the fingerprint region (>1250 cm-1).
• Note the absence of certain peaks.
• Be aware of O-H peaks, water is a common
contaminant.
20. Characteristic IR Wavenumbers
Functional group wavenumber (cm-1)
sp3 C-H str ~2800-3000
sp2 C-H str ~3000-3100
sp C-H str ~3300
O-H str ~3300 (broad*)
O-H str in COOH ~3000 (broad*)
N-H str ~3300 (broad*)
aldehyde C-H str ~2700, ~2800
*The peak is broad when H bonding is extensive.
Otherwise, the peak can be sharp.
21. Characteristic IR Wavenumbers
Functional group wavenumber (cm-1)
C=C isolated ~1640-1680
C=C conjugated ~1620-1640
C=C aromatic ~1600
C≡N just above 2200
C≡C just below 2200
C=O ester ~1730-1740
C=O aldehyde, ketone,
or acid
~1710 (aldehyde can
run 1725)
C=O amide ~1640-1680
22. How to Analyze an IR Spectrum
Look for what’s there and what’s not there.
• C-H absorption
– The wavenumber will tell you sp3(C-C), sp2(C=C), sp (C≡C) and
perhaps aldehyde.
• Carbonyl (C=O) absorption
– Its presence means the compound is an aldehyde,
ketone, carboxylic acid, ester, amide, anhydride or acyl
halide.
– Its absence means the compound cannot be any of
the carbonyl-containing compounds.
23. How to Analyze an IR Spectrum
• O-H or N-H absorption
– This indicates either an alcohol, N-H containing
amine or amide, or carboxylic acid.
• C≡C and C≡N absorptions
– Be careful: internal triple bonds often do not show
up in IR spectra.
• C=C absorption
– Can indicate whether compound is alkene or
aromatic.
24. How to Analyze an IR Spectrum
• N-O of NO2 absorption
– This is a distinctive, strong doublet that it pays to
know (1515-1560 & 1345-1385 cm-1).
• Read the scale for the value of the
wavenumbers (be able to interpolate), or
• Read the wavenumbers in the table provided.
25. Infrared interpretation
• Step 1
– Look first for the carbonyl C=O band.
– Look for a strong band at 1820-1660 cm-1.
This band is usually the most intense absorption band in a
spectrum. It will have a medium width. If you see the
carbonyl band, look for other bands associated with
functional groups that contain the carbonyl by going to step 2.
– If no C=O band is present, check for alcohols and go to step
3.
• Step 2
– If a C=O is present you want to determine if it is part of an
acid, an ester, or an aldehyde or ketone. At this time you may
not be able to distinguish aldehyde from ketone.
25
26. • ACID
– Look for indications that an O-H is also present.
– It has a broad absorption near 3300-2500 cm-1.
– This actually will overlap the C-H stretch. There will also be
a C-O single bond band near 1100-1300 cm-1.
– Look for the carbonyl band near 1725-1700 cm-1.
• ESTER
– Look for C-O absorption of medium intensity near 1300-1000
cm-1.
– There will be no O-H band.
26
27. • ALDEHYDE
– Look for aldehyde type C-H absorption bands. These are
two weak absorptions to the right of the C-H stretch near
2850 cm-1 and 2750 cm-1 and are caused by the C-H bond
that is part of the CHO aldehyde functional group.
– Look for the carbonyl band around 1740-1720 cm-1.
• KETONE
– The weak aldehyde CH absorption bands will be absent.
Look for the carbonyl CO band around 1725-1705 cm-1.
• Step 3
– If no carbonyl band appears in the spectrum, look for an
alcohol O-H band.
• ALCOHOL
– Look for the broad OH band near 3600-3300 cm-1 and a C-
O absorption band near 1300-1000 cm-1.
27
29. • Step 4
– If no carbonyl bands and no O-H bands are in the spectrum,
check for double bonds, C=C, from an aromatic or an
alkene.
• ALKENE
– Look for weak absorption near 1650 cm-1 for a double bond.
There will be a CH stretch band near 3000 cm-1.
• AROMATIC
– Look for the benzene, C=C, double bonds which appear as
medium to strong absorptions in the region 1650-1450 cm-1.
The CH stretch band is much weaker than in alkenes.
29
30. C-H stretching region
• Alkanes C-H sp3 stretch < 3000 cm-1
• Alkenes C-H sp2 stretch > 3000 cm-1
• Alkynes C-H spa stretch ~ 3300 cm-1
• C-H Bending region
• CH2 bending ~ 1460 cm-1
• CH3 bending (asym) appears near the same value
• CH3 bending (sym) ~ 1380 cm-1
30
31. • Step 5
– If none of the previous groups can be identified, you may
have an alkane.
• ALKANE
– The main absorption will be the C-H stretch near 3000 cm-1.
The spectrum will be simple with another band near 1450
cm-1.
• Step 6
– If the spectrum still cannot be assigned you may have an
alkyl halide.
• ALKYL BROMIDE
– Look for the C-H stretch and a relatively simple spectrum
with an absorption to the right of 667 cm-1.
31
32. IR Spectra - Examples
SDBSWeb : http://riodb01.ibase.aist.go.jp/sdbs/ (National Institute
of Advanced Industrial Science and Technology, 10/15/09)
sp3 C-H str
no O-H
str
no N-H
str
no spa
or sp2
C-H str
no C=O str
no C=C str
C-H bend
This is an alkane.
CH2 bending ~ 1460 cm-1
CH3 bending (asym) appears near the same value
CH3 bending (sym) ~ 1380 cm-1
33. IR Spectra - Examples
SDBSWeb : http://riodb01.ibase.aist.go.jp/sdbs/ (National Institute
of Advanced Industrial Science and Technology, 10/15/09)
sp3 C-H str
sp2 C-H str
C=C str
This is an alkene.
C=C isolated = ~1640-1680
Alkenes C-H sp2 stretch > 3000 cm-1
34. IR Spectra - Examples
SDBSWeb : http://riodb01.ibase.aist.go.jp/sdbs/ (National Institute
of Advanced Industrial Science and Technology, 10/15/09)
This is a terminal alkyne.
C≡C str at
2120 cm-1
sp3 C-H str
spa C-H
str
Alkynes C-H spa stretch ~ 3300 cm-1
C≡C < 2200 cm-1 and C≡N > 2200 cm-1absorptions
35. IR Spectra - Examples
SDBSWeb : http://riodb01.ibase.aist.go.jp/sdbs/ (National Institute
of Advanced Industrial Science and Technology, 10/15/09)
sp3 C-H str
C≡N str at
2260 cm-1
This is a nitrile.
C≡C < 2200 cm-1 and C≡N > 2200 cm-1absorptions
36. IR Spectra - Examples
SDBSWeb : http://riodb01.ibase.aist.go.jp/sdbs/ (National Institute
of Advanced Industrial Science and Technology, 10/16/09)
sp3 C-H str
alc.
O-H
str
C-O str
This is an alcohol.
Look for the broad OH band near 3600-3300 cm-1 and a
C-O absorption band near 1300-1000 cm-1.
37. How to Analyze an IR Spectrum
• O-H absorption, peak shape
– Peak shapes are influenced by hydrogen
bonding.
– Lots of H-bonding, broad peak around 3300 cm-
1.
– In a dilute solution, there is little H bonding and
the O-H peak is sharper and around 3500 cm-1.
• This can happen to N-H and the acid O-H as
well .
38. IR Spectra - Examples
SDBSWeb : http://riodb01.ibase.aist.go.jp/sdbs/ (National Institute
of Advanced Industrial Science and Technology, 10/16/11)
Cyclohexanol, neat
39. IR Spectra - Examples
SDBSWeb : http://riodb01.ibase.aist.go.jp/sdbs/ (National Institute
of Advanced Industrial Science and Technology, 9/3/11)
Cyclohexanol in CCl4
40. IR Spectra - Examples
SDBSWeb : http://riodb01.ibase.aist.go.jp/sdbs/ (National Institute
of Advanced Industrial Science and Technology, 10/16/09)
sp3 C-H str
C=O str
acid O-H str
This is a carboxylic acid.
It has a broad absorption near 3300-2500 cm-1.
This actually will overlap the C-H stretch.
There will also be a C-O single bond band near 1100-1300 cm-1.
Look for the carbonyl band near 1725-1700 cm-1.
41. IR Spectra - Examples
SDBSWeb : http://riodb01.ibase.aist.go.jp/sdbs/ (National Institute
of Advanced Industrial Science and Technology, 10/16/09)
C=O str
C-H str
doublet:
2826 cm-1
and 2728
cm-1
sp2 C-H str aromatic
C=C str
This compound has two functional groups: a benzene
ring and an aldehyde.
aldehyde C-H str ~2700, ~2800
C=C aromatic ~1600
42. IR Spectra - Examples
SDBSWeb : http://riodb01.ibase.aist.go.jp/sdbs/ (National Institute
of Advanced Industrial Science and Technology, 10/16/09)
sp3 C-H str
C-O str
C=O str
This is an alkyl ester. Esters and ketones have
fairly similar spectra.
46. Dispersive instruments: with a grating monochromator to
be used in the mid-IR region for spectral scanning and
quantitative analysis.
Fourier transform IR (FTIR) systems: widely applied and
quite popular in the far-IR and mid-IR spectrometry.
Nondispersive instruments: use filters for wavelength
selection or an infrared-absorbing gas in the detection system
for the analysis of gas at specific wavelength.
47. Dispersive IR spectrophotometers
Simplified diagram of a double beam infrared spectrometer
Modern dispersive IR spectrophotometers are invariably double-beam
instruments, but many allow single-beam operation via a front-panel
switch.
48. Double-beam operation compensates for atmospheric absorption, for the
wavelength dependence of the source spectra radiance, the optical
efficiency of the mirrors and grating, and the detector instability, which
are serious in the IR region.single-beam instruments not practical.
Double-beam operation allows a stable 100% T baseline in the spectra.
53. • Reflection gratings (made from various plastics): the groove
spacing is greater (e.g. 120 grooves mm-1). To reduce the effect of
overlapping orders and stray radiation, filters or a preceding prism
are usually employed. Two or more gratings are often used with
several filters to scan a wide region.
• Mirrors but not lenses are used to focus and collimate the IR
radiation. Generally made from Pyrex or another material with low
coefficient of thermal expansion. Front surfaces coated with a
vacuum-deposited thin metal film of Al, Ag, or Au.
54. •Windows are used for sample cells and to permit various compartment
to be isolated from the environment.
transparent to IR over the wavelength region
inert to the various chemicals analyzed
capable of being shaped, ground, and polished to the desired
optical quality
55. The Fourier transform method provides an alternatives to the
use of monochromators based on dispersion.
In conversional dispersive spectroscopy, frequencies are
separated and only a small portion is detected at any particular
instant, while the remainder is discarded. The immediate result
is a frequency-domain spectrum.
Fourier transform infrared spectroscopy generates time-domain
spectra as the immediately available data, in which the
intensity is obtained as a function of time.
Direct observation of a time-domain spectrum is not
immediately useful because it is not possible to deduce, by
inspection, frequency-domain spectra from the corresponding
time-domain waveform (Fourier transform is thus introduced).
Fourier Transform Infrared Spectrometer (FTIR)
56. In one arm of the interferometer, the IR source radiation travels through the
beam splitter to the fixed mirror back to the beam splitter through the sample
and to the detector. In the other arm, the IR source radiation travels to the beam
splitter to the movable mirror, back through the beam splitter to the sample and
to the detector. The difference in pathlengths of the two beams is the
retardation . An He-NE laser is used as a monochromatic reference source.
The laser beam is sent through the interferometer in the opposite direction to
that of the IR beam.
Single-beam FTIR Spectrometer
58. Interferometer
Michelson interferometer
If moving mirror moves 1/4 l (1/2 l round-trip) waves are out of phase at beam-
splitting mirror - no signal
If moving mirror moves 1/2 l (1 l round-trip) waves are in phase at beam-splitting
mirror – signal
...
59. Michaelson Interferometer
• 1014 Hz is too fast for the rapid changes in
power to be directly measured as a function
of time.
• Can not measure the FID signal directly
• Interferometer creates a replicate interference
pattern at a frequency that is a factor of 1010
times slower
• 104-105 Hz can be measured electronically
• f = (2vm/c)n = 10-10n, vm = 1.5 cm/s
60. Michaelson Interferometer
• Beam splitter
• Stationary mirror
• Moving mirror at constant velocity
• Motor driven Micrometer screw
• He/Ne laser; sampling interval, control mirror
velocity
62. Infrared Experimental
• To obtain an IR spectrum, the sample must be
placed in a “container” or cell that is transparent in
the IR region of the spectrum.
• Sodium chloride or salt plates are a common means
of placing the sample in the light beam of the
instrument.
64. Infrared Experimental
• These plates are made
of salt and must be
stored in a water free
environment such as
the dessicator shown
here.
65. Infrared Experimental
• The plates must also be
handled with gloves to
avoid contact of the
plate with moisture
from one’s hands.
66. Infrared Experimental
• To run an IR spectrum of a
liquid sample, a drop or two
of the liquid sample is
applied to a salt plate.
• A second salt plate is placed
on top of the first one such
that the liquid forms a thin
film “sandwiched” between
the two plates.
67. Infrared Experimental
• The cell holder is then
placed in the beam of the
instrument.
• The sample is then scanned
by the instrument utilizing
predestinated parameters.
• A satisfactory spectrum has
well defined peaks-but not
so intense as to cause
flattening on the bottom of
the peaks.
68. Sample Handling
• No good solvents exist that are transparent throughout
the region of interest.
• As a consequence, sample handling is frequently the
most difficult and time-consuming part of an infrared
spectrometric analysis.
• Gases: The spectrum of a low-boiling liquid or gas can
be obtained by permitting the sample to expand into an
evacuated cylindrical cell equipped with suitable
windows.
MID-INFRARED ABSORPTION SPECTROMETRY
68
(SHARMA page 84)
69. • A gas sample cell consists of a cylinder of glass or sometimes a metal.
The cell is closed at both ends with an appropriate window materials
(NaCl/KBr) and equipped with valves or stopcocks for introduction of the
sample.
• Long path length (10 cm) cells – used to study dilute (few molecules) or
weakly absorbing samples.
• Multipass cells – more compact and efficient instead of long-pathlength
cells. Mirrors are used so that the beam makes several passes through the
sample before exiting the cell. (Effective pathlength 10 m).
• To resolve the rotational structure of the sample, the cells must be
capable of being evacuated to measure the spectrum at reduced pressure.
• For quantitative determinations with light molecules, the cell is
sometimes pressurized in order to broaden the rotational structure and all
simpler measurement.
Gas samples
69
70. • Solutions:
• A convenient way of obtaining infrared spectra is on solutions
prepared to contain a known concentration of sample.
• This technique is somewhat limited in its applications, however,
by the availability of solvents that are transparent over significant
regions in the infrared.
Solvents:
• No single solvents is transparent throughout the entire mid-
infrared region.
• Water and alcohols are seldom employed, not only because they
absorb strongly, but also because they attack alkali-metal halides,
the most common materials used for cell windows.
70
72. Cells:
• Sodium chloride windows are most commonly employed; even
with care, however, their surfaces eventually become fogged due
to absorption of moisture.
• Polishing with a buffing powder returns them to their original
condition.
Liquids:
• When the amount of liquid sample is small or when a suitable
solvent is unavailable, it is common practice to obtain spectra on
the pure (neat) liquid.
• A drop of the neat liquid is squeezed between two rock-salt plated
to give a layer that has a thickness of 0.01 mm or less.
• The two plates, held together are then mounted in the beam path.
Such a technique does not give reproducible transmittance data,
but the resulting spectra are usually satisfactory for qualitative
investigations.
72
78. Solids:
• Most organic compounds exhibit numerous absorption peaks
throughout the mid-infrared region, and finding a solvent that does
not have overlapping peaks is often impossible.
• As a consequence, spectra are often obtained on dispersions of the
solid in a liquid or solid matrix.
Pelleting:
• One of the most popular techniques for handling solid samples has
been KBr pelleting.
• A milligram or less of the finely ground sample is mixed with
about 100 mg of dried potassium bromide powder.
• The mixture is then pressed in a die at 10,000 to 15,000 pounds
per square inch to yield a transparent disk.
• The disk is then held in the instrument beam for spectroscopic
examination.
78
82. Mulls (suspension):
• Infrared spectra of solids that are not soluble in an
infrared-transparent solvent or are not conveniently
pelleted in KBr are often obtained by dispersing the
analyte in a mineral oil or fluorinated hydrocarbon
mull.
• Mulls are formed by grinding 2 to 5 mg of the finely
powdered sample in the presence of one or two drops
of a heavy hydrocarbon oil (Nujol).
• If hydrocarbon bands interfere, Fluorolube, a
halogenated polymer, can be used.
• The resulting mull is then examined as a film between
flat salt plates.
82
83.
84.
85.
86.
87.
88.
89.
90. Sample preparation techniques
The preparation of samples for infrared spectrometry is often the most challenging
task in obtaining an IR spectrum. Since almost all substances absorb IR radiation
at some wave length, and solvents must be carefully chosen for the wavelength
region and the sample of interest.
Infrared spectra may be obtained for gases, liquids or solids (neat or in
solution)
91. • A gas sample cell consists of a cylinder of glass or sometimes a metal.
The cell is closed at both ends with an appropriate window materials
(NaCl/KBr) and equipped with valves or stopcocks for introduction of the
sample.
• Long pathlength (10 cm) cells – used to study dilute (few molecules)
or weakly absorbing samples.
• Multipass cells – more compact and efficient instead of long-pathlength
cells. Mirrors are used so that the beam makes several passes through
the sample before exiting the cell. (Effective pathlength 10 m).
• To resolve the rotational structure of the sample, the cells must be
capable of being evacuated to measure the spectrum at reduced
pressure.
• For quantitative determinations with light molecules, the cell is
sometimes pressurized in order to broaden the rotational structure and
all simpler measurement.
Gas samples
92. • Pure or soluted in transparent solvent – not water (attacks windows)
•The sample is most often in the form of liquid films (“sandwiched”
between two NaCl plates)
• Adjustable pathlength (0.015 to 1 mm) – by Teflon spacer
Liquid samples
93. Regions of transparency for common infrared solvents.
The horizontal lines indicate regions where solvent transmits at least
25% of the incident radiation in a 1-mm cell.
94. Solid samples
• Spectra of solids are obtained as alkali halide discs (KBr), mulls
(e.g. Nujol, a highly refined mixture of saturated hydrocarbons) and
films (solvent or melt casting)
Alkali halide discs:
1. A milligram or less of the fine ground sample mixed with about
100 mg of dry KBr powder in a mortar or ball mill.
2. The mixture compressed in a die to form transparent disc.
Mulls
1. Grinding a few milligrams of the powdered sample with a mortar
or with pulverizing equipment. A few drops of the mineral oil
added (grinding continued to form a smooth paste).
2. The IR of the paste can be obtained as the liquid sample.
95. 1. Fundamental chemistry
Determination of molecular structure/geometry.
e.g. Determination of bond lengths, bond angles of
gaseous molecules
2. Qualitative analysis – simple, fast, nondestructive
Monitoring trace gases: NDIR.Rapid, simultaneous
analysis of GC, moisture, N in soil. Analysis of fragments
left at the scene of a crime
Quantitative determination of hydrocarbons on filters, in
air, or in water
Main uses of IR spectroscopy:
96. Near-infrared and Far-infrared absorption
The techniques and applications of near-infrared (NIR) and
far-infrared (FIR) spectrometry are quite different from those
discussed above for conventional, mid-IR spectrometry.
Near-infrared: 0.8 -2.5 mm, 12500 - 4000 cm-1
Mid-infrared: 2.5 - 50 mm, 4000 - 200 cm-1
Far-infrared: 50 - 1000 mm, 200 - 10 cm-1
97. Near-infrared spectrometry
NIR shows some similarities to UV-visible spectrophotometry and
some to mid-IR spectrometry. Indeed the spectrophotometers
used in this region are often combined UV-visible-NIR ones.
The majority of the absorption bands observed are due to
overtones (or combination) of fundamental bands that occur in
the region 3 to 6 mm, usually hydrogen-stretching vibrations.
NIR is most widely used for quantitative organic functional-group
analysis. The NIR region has also been used for qualitative
analyses and studies of hydrogen bonding, solute-solvent
interactions, organometallic compounds, and inorganic
compounds.
98. Far-infrared spectrometry
Almost all FIR studies are now carried out with FTIR
spectrometers.
The far-IR region can provide unique information.
i) The fundamental vibrations of many organometallic and
inorganic molecules fall in this region due to the heavy atoms
and weak bonds in these molecules.
ii) Lattice vibrations of crystalline materials occur in this region,
iii) Electron valence/conduction band transition in
semiconductors often correspond to far-IR wavelengths.
99.
100. CO2 Molecule
Let us consider the infrared spectrum of carbon dioxide. If no
coupling occurred between the two C=O bonds, an absorption
peak would be expected at the same wavenumber as the peak
for the C=O stretching vibration in an aliphatic ketone (about
1700 cm-1).
Experimentally, carbon dioxide exhibits two absorption peaks, the
one at 2330 cm-1 and the other at 667 cm-1. Carbon dioxide is a
linear molecule and thus has 3 x 3 – 5 = 4 normal modes. Two
stretching vibrations are possible. The symmetric vibration
causes no change in dipole. Thus, the symmetric vibration is
infrared inactive.
101. …continued…
The asymmetric vibration produce a change in
dipole moments, so absorption at 2330 cm-1
results.
The remaining two vibrational modes of carbon
dioxide involve scissoring. The two bending
vibrations are the resolved components at 90
deg to one another of the bending motion in all
possible planes around the bond axis. The two
vibrations are identical in energy and thus
produce a single peak at 667 cm-1.
103. H2O molecule
Triatomic molecule such as water, sulfur dioxide,
or nitrogen dioxide have 3 x 3 – 6 = 3 vibrational
modes. The central atom is not in line with the
other two, a symmetric stretching vibration will
produce a change in dipole and will thus be
responsible for infrared absorption. Stretching
peaks at 3650 and 3760 cm-1 appear in the
infrared spectrum for the symmetric and
asymmetric vibrations of the water molecule.
There is only one component to the scissoring
vibration for this nonlinear molecule. For water,
the bending vibration cause absorption at 1595
cm-1.