Downloaded 198 times


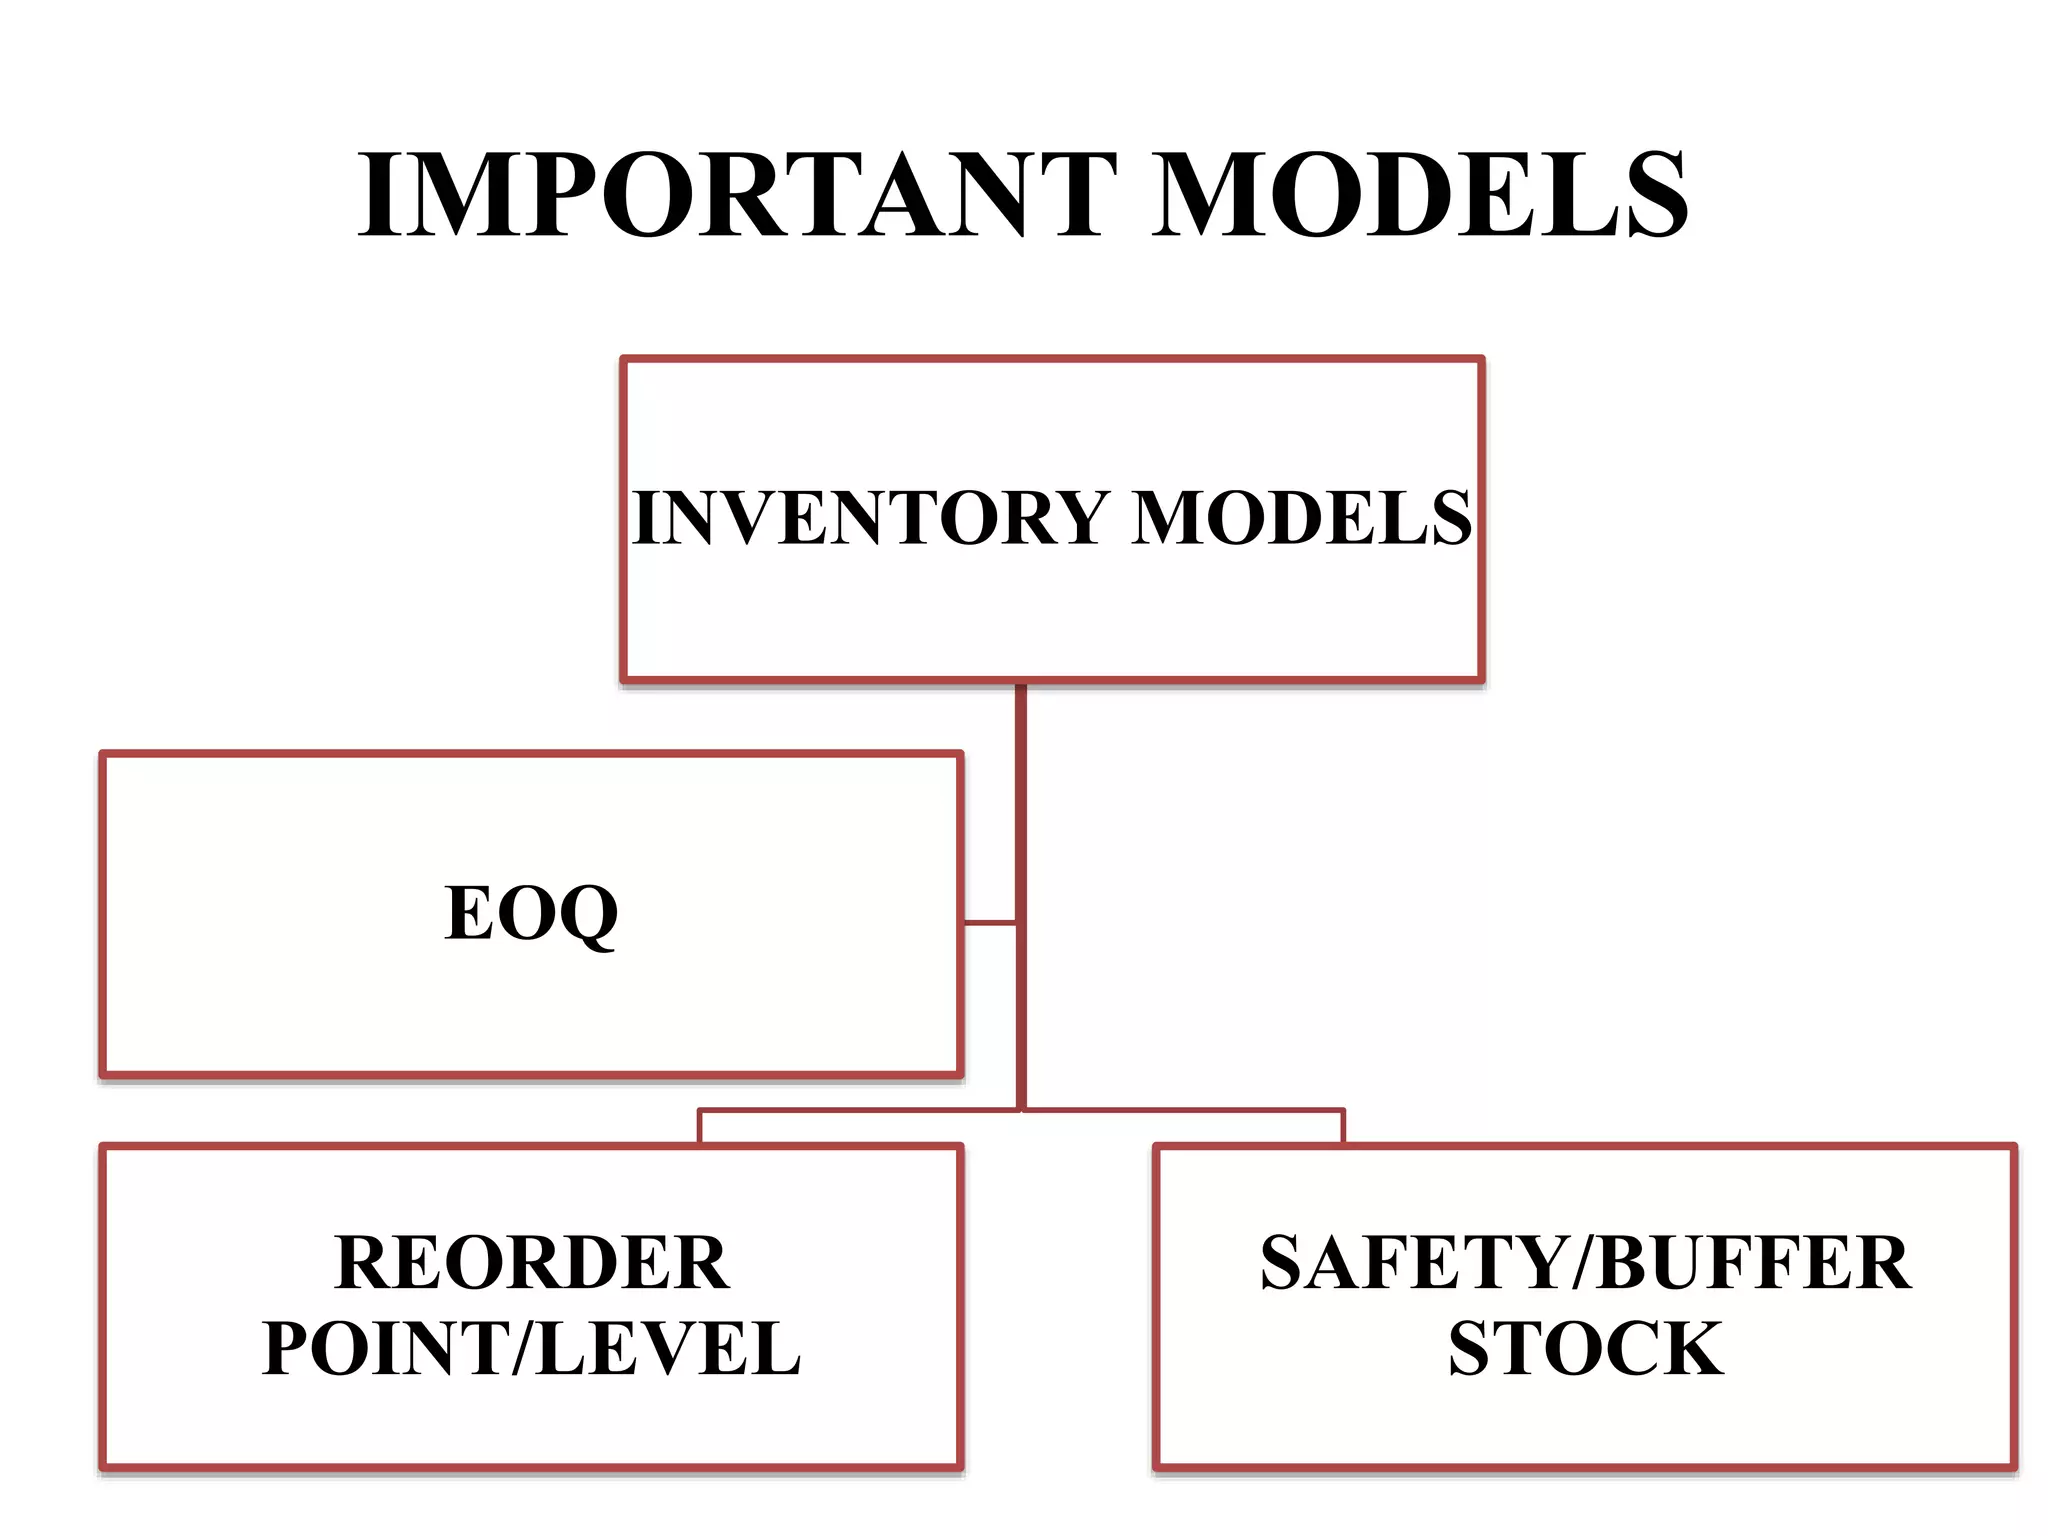


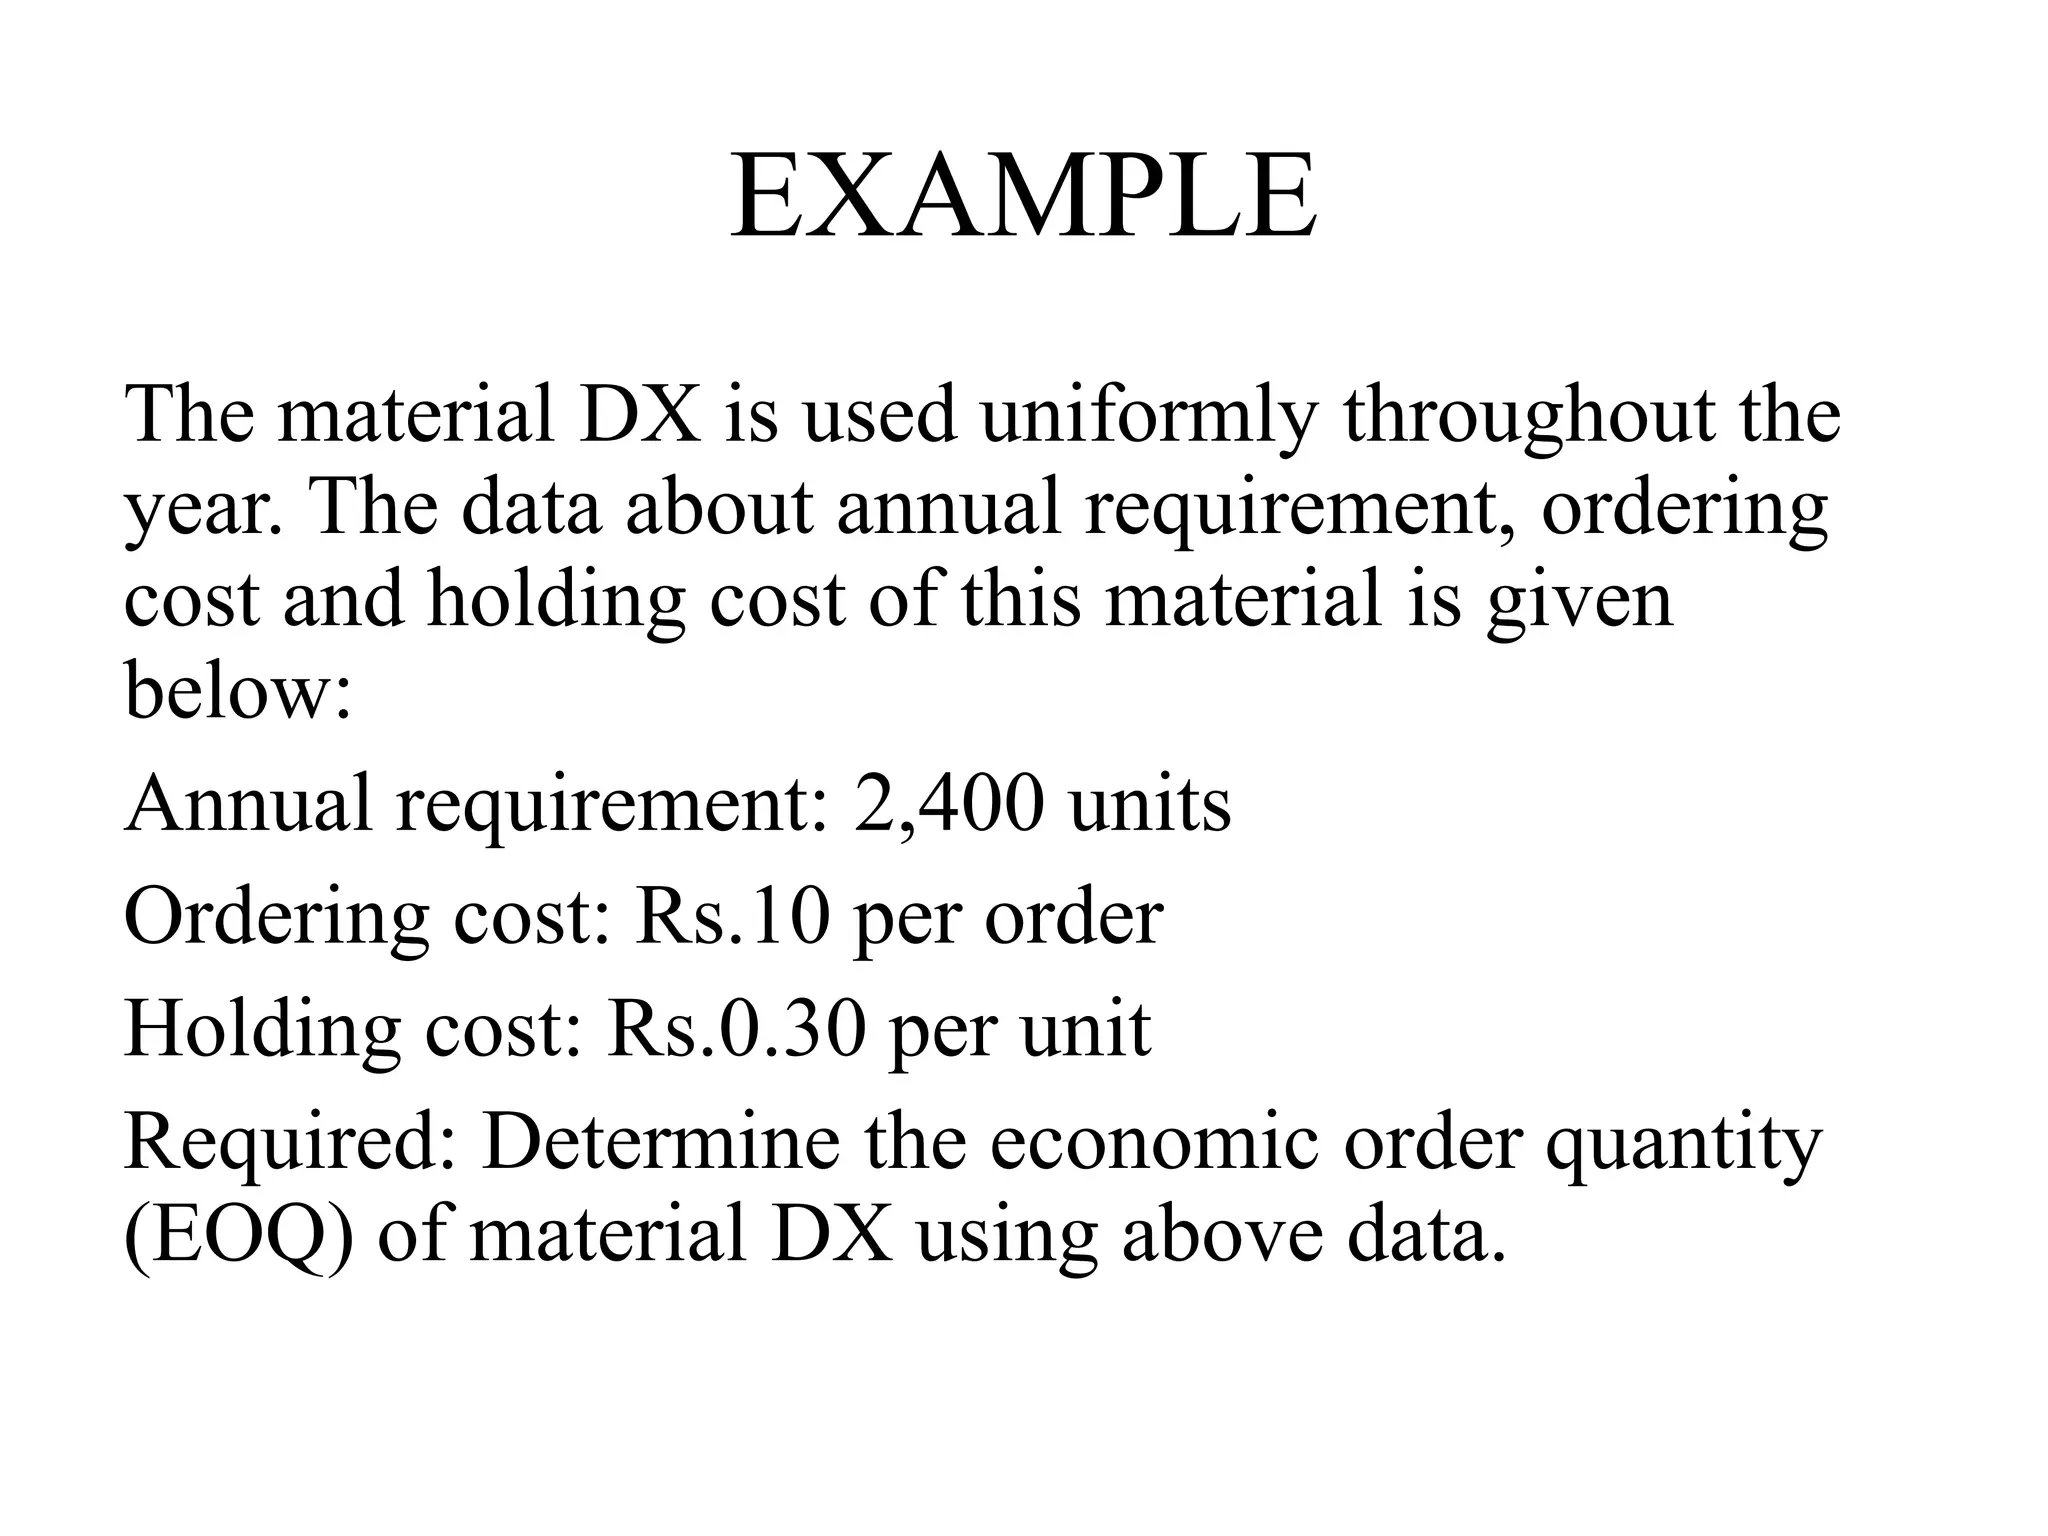


The document discusses the fundamentals of inventory management, focusing on determining the optimal order quantity to minimize ordering and carrying costs. It explains various inventory models, particularly the Economic Order Quantity (EOQ) model, along with stock levels, safety stock, and how these concepts contribute to efficient operations and customer satisfaction. A well-structured inventory management system is essential for business success, helping to prevent stockouts and streamline supply chain processes.


