Download as PDF, PPTX

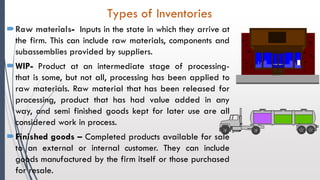
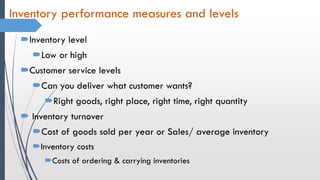


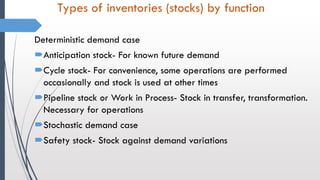

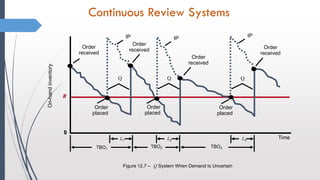
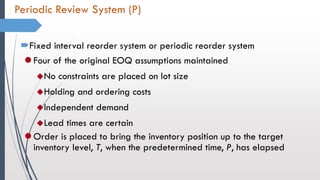
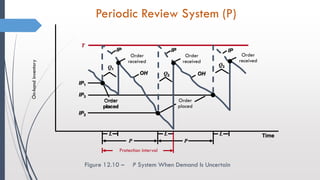
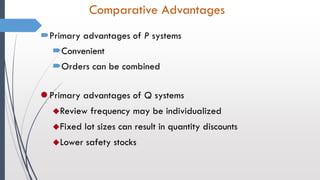


The document provides an overview of inventory management. It discusses the types of inventories including raw materials, work in progress, and finished goods. It describes the functions of inventory including meeting demand, smoothing production, and protecting against stock-outs. It also discusses inventory performance measures, counting systems, key terms, classification systems, and inventory models including economic order quantity, reorder point, and periodic review systems. The document provides insights into effective inventory management.


![Inventory accounting & management [compatibility mode]](https://cdn.slidesharecdn.com/ss_thumbnails/inventoryaccountingmanagementcompatibilitymode-120606195929-phpapp02-thumbnail.jpg?width=640&height=640&fit=bounds)


