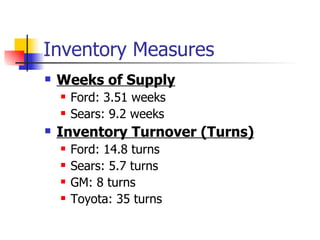
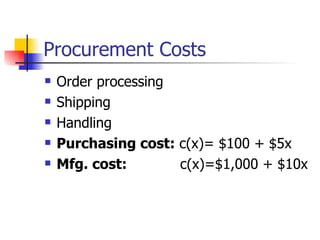
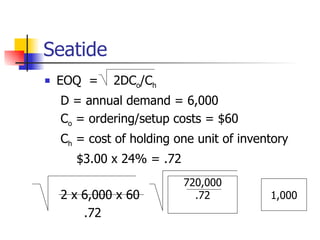
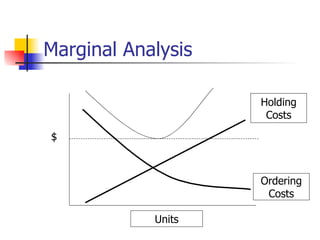
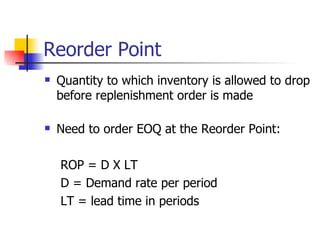
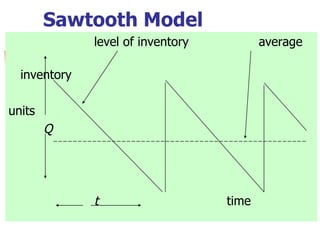
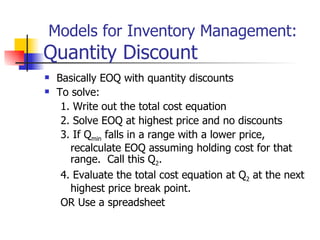
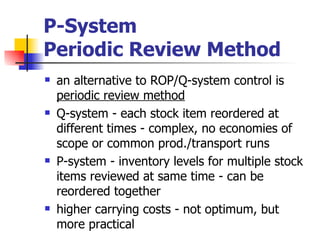
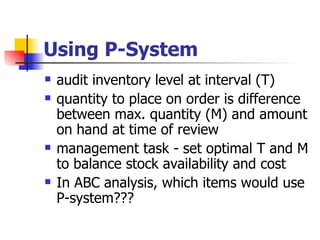
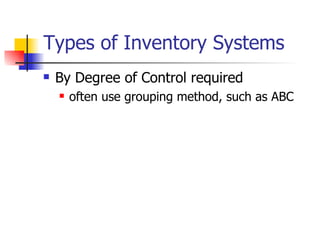
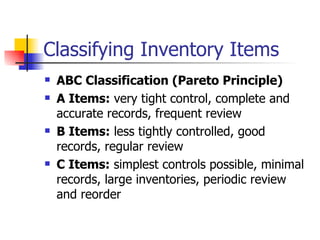
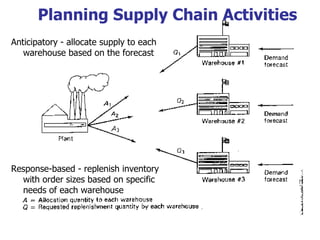
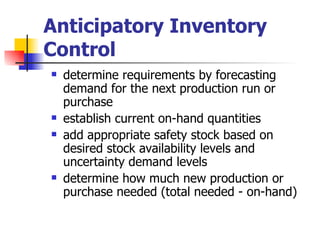
Inventory Management
Definitions
   Inventory-A physical resource that a firm
    holds in stock with the intent of selling it or
    transforming it into a more valuable state.

   Inventory System- A set of policies and
    controls that monitors levels of inventory and
    determines what levels should be maintained,
    when stock should be replenished, and how
    large orders should be
Inventory
   Def. - A physical resource that a firm holds in
    stock with the intent of selling it or
    transforming it into a more valuable state.
   Raw Materials
   Works-in-Process
   Finished Goods
   Maintenance, Repair and Operating (MRO)
Expensive Stuff
   The average carrying cost of inventory
    across all mfg.. in the U.S. is 30-35% of
    its value.
   What does that mean?
   Savings from reduced inventory result
    in increased profit.
Zero Inventory?
   Reducing amounts of raw materials and
    purchased parts and subassemblies by
    having suppliers deliver them directly.

   Reducing the amount of works-in process
    by using just-in-time production.

   Reducing the amount of finished goods by
    shipping to markets as soon as possible.
Inventory Positions in the
 Supply Chain


Raw         Works
Materials             Finished   Finished
            in        Goods      Goods
            Process              in Field
Reasons for Inventories
   Improve customer service
   Economies of purchasing
   Economies of production
   Transportation savings
   Hedge against future
   Unplanned shocks (labor strikes, natural
    disasters, surges in demand, etc.)
   To maintain independence of supply chain
Inventory and Value
   Remember this?
       Quality
       Speed
       Flexibility
       Cost
Nature of Inventory: Adding
Value through Inventory
   Quality - inventory can be a “buffer” against poor
    quality; conversely, low inventory levels may force
    high quality
   Speed - location of inventory has gigantic effect on
    speed
   Flexibility - location, level of anticipatory inventory
    both have effects
   Cost - direct: purchasing, delivery, manufacturing
        indirect: holding, stockout.
        HR systems may promote this-3 year postings
Nature of Inventory:
Functional Roles of Inventory
   Transit
   Buffer
   Seasonal
   Decoupling
   Speculative
   Lot Sizing or Cycle
   Mistakes
Design of Inventory Mgmt.
Systems: Macro Issues
   Need for Finished Goods Inventories
       Need to satisfy internal or external customers?
       Can someone else in the value chain carry the
        inventory?
   Ownership of Inventories
   Specific Contents of Inventories
   Locations of Inventories
   Tracking
How to Measure Inventory
   The Dilemma: closely monitor and control
    inventories to keep them as low as possible
    while providing acceptable customer service.
   Average Aggregate Inventory Value:
        how much of the company’s total assets
    are invested in inventory?
   Ford:6.825 billion
   Sears: 4.039 billion
Inventory Measures
   Weeks of Supply
       Ford: 3.51 weeks
       Sears: 9.2 weeks
   Inventory Turnover (Turns)
       Ford: 14.8 turns
       Sears: 5.7 turns
       GM: 8 turns
       Toyota: 35 turns
Reasons Against Inventory
   Non-value added costs
   Opportunity cost
   Complacency
   Inventory deteriorates, becomes
    obsolete, lost, stolen, etc.
Inventory Costs
   Procurement costs
   Carrying costs
   Out-of-stock costs
Procurement Costs
   Order processing
   Shipping
   Handling
   Purchasing cost: c(x)= $100 + $5x
   Mfg. cost:       c(x)=$1,000 + $10x
Carrying Costs
   Capital (opportunity) costs
   Inventory risk costs
   Space costs
   Inventory service costs
Out-of-Stock Costs
   Lost sales cost
   Back-order cost
Independent Demand
   Independent demand items are
    finished products or parts that are
    shipped as end items to customers.
   Forecasting plays a critical role
   Due to uncertainty- extra units must
    be carried in inventory
Dependent Demand
   Dependent demand items are raw
    materials, component parts, or
    subassemblies that are used to produce
    a finished product.
   MRP systems---next week
Design of Inventory Mgmt.
Systems: Micro Issues
   Order Quantity
      Economic Order Quantity
   Order Timing
         Reorder Point
Objectives of Inventory
Control
   1) Maximize the level of customer
    service by avoiding understocking.
   2) Promote efficiency in production and
    purchasing by minimizing the cost of
    providing an adequate level of customer
    service.
Balance in Inventory Levels
   When should the company replenish its
    inventory, or when should the company
    place an order or manufacture a new
    lot?
   How much should the company order or
    produce?
   Next: Economic Order Quantity
Models for Inventory Management:
EOQ
   EOQ minimizes the sum of holding and setup
    costs
   Q = 2DCo/Ch
    D = annual demand
    Co = ordering/setup costs
    Ch = cost of holding one unit of inventory
Seatide
   EOQ =    2DCo/Ch
    D = annual demand = 6,000
    Co = ordering/setup costs = $60
    Ch = cost of holding one unit of inventory
      $3.00 x 24% = .72
                          720,000
    2 x 6,000 x 60          .72           1,000
        .72
Marginal Analysis

                    Holding
                     Costs

$


                    Ordering
                     Costs

            Units
Reorder Point
   Quantity to which inventory is allowed to drop
    before replenishment order is made

   Need to order EOQ at the Reorder Point:

    ROP = D X LT
    D = Demand rate per period
    LT = lead time in periods
Sawtooth Model
              level of inventory          average

  inventory

units
        Q


              t                    time
Q - System Inventory
Control
   based on reorder point - When
    inventory is depleted to ROP, order
    replenishment of quantity EOQ.
Order Quantities
   when demand is smooth and
    continuous, can operate response-
    based system by determining
       best quantity to replenish periodic demand
        (EOQ)
       frequency of replenishment (ROP)
            Reorder Point
Planning for Uncertainty
   changing lead times
   changing demand
   Uncertainty creeps in:
       Plug in safety stock
Safety stock - allows manager to
  determine the probability of stock levels
  - based on desired customer service
  levels
Inventory Model Under
    Uncertainty

reorder Qm
point


             safety stock
                            time
Models for Inventory Management:
Quantity Discount
   Basically EOQ with quantity discounts
   To solve:
     1. Write out the total cost equation
     2. Solve EOQ at highest price and no discounts
     3. If Qmin falls in a range with a lower price,
       recalculate EOQ assuming holding cost for that
       range. Call this Q2.
     4. Evaluate the total cost equation at Q2 at the next
       highest price break point.
     OR Use a spreadsheet
P-System
Periodic Review Method
   an alternative to ROP/Q-system control is
    periodic review method
   Q-system - each stock item reordered at
    different times - complex, no economies of
    scope or common prod./transport runs
   P-system - inventory levels for multiple stock
    items reviewed at same time - can be
    reordered together
   higher carrying costs - not optimum, but
    more practical
Using P-System
   audit inventory level at interval (T)
   quantity to place on order is difference
    between max. quantity (M) and amount
    on hand at time of review
   management task - set optimal T and M
    to balance stock availability and cost
   In ABC analysis, which items would use
    P-system???
Types of Inventory Systems
   By Degree of Control required
       often use grouping method, such as ABC
Classifying Inventory Items
   ABC Classification (Pareto Principle)
   A Items: very tight control, complete and
    accurate records, frequent review
   B Items: less tightly controlled, good
    records, regular review
   C Items: simplest controls possible, minimal
    records, large inventories, periodic review
    and reorder
Does ABC Classification Make
Sense for an Assembler?
   i.e. – Gateway Computers
Planning Supply Chain Activities
Anticipatory - allocate supply to each
   warehouse based on the forecast


Response-based - replenish inventory
  with order sizes based on specific
  needs of each warehouse
Anticipatory Inventory
Control
   determine requirements by forecasting
    demand for the next production run or
    purchase
   establish current on-hand quantities
   add appropriate safety stock based on
    desired stock availability levels and
    uncertainty demand levels
   determine how much new production or
    purchase needed (total needed - on-hand)
Response-Based System
   replenishment, production, or purchases of
    stock are made only when it has been
    signaled that there is a need for product
    downstream
   requires shorter order cycle time, often more
    frequent, lower volume orders
   determine stock requirements to meet only
    most immediate planning period (usually
    about 3 weeks)
Service Level Achieved
•Item fill rate (IFR): the probability of filling
an order for 1 item from current stock

      expected number of units out of stock/year
 1-
              total annual demand

•Weighted Average Fill Rate (WAFR): multiply
IFR for each stock item on an order weighted
by the ordering frequency for the item

Inventory management

  • 1.
  • 2.
    Definitions  Inventory-A physical resource that a firm holds in stock with the intent of selling it or transforming it into a more valuable state.  Inventory System- A set of policies and controls that monitors levels of inventory and determines what levels should be maintained, when stock should be replenished, and how large orders should be
  • 3.
    Inventory  Def. - A physical resource that a firm holds in stock with the intent of selling it or transforming it into a more valuable state.  Raw Materials  Works-in-Process  Finished Goods  Maintenance, Repair and Operating (MRO)
  • 4.
    Expensive Stuff  The average carrying cost of inventory across all mfg.. in the U.S. is 30-35% of its value.  What does that mean?  Savings from reduced inventory result in increased profit.
  • 5.
    Zero Inventory?  Reducing amounts of raw materials and purchased parts and subassemblies by having suppliers deliver them directly.  Reducing the amount of works-in process by using just-in-time production.  Reducing the amount of finished goods by shipping to markets as soon as possible.
  • 6.
    Inventory Positions inthe Supply Chain Raw Works Materials Finished Finished in Goods Goods Process in Field
  • 7.
    Reasons for Inventories  Improve customer service  Economies of purchasing  Economies of production  Transportation savings  Hedge against future  Unplanned shocks (labor strikes, natural disasters, surges in demand, etc.)  To maintain independence of supply chain
  • 8.
    Inventory and Value  Remember this?  Quality  Speed  Flexibility  Cost
  • 9.
    Nature of Inventory:Adding Value through Inventory  Quality - inventory can be a “buffer” against poor quality; conversely, low inventory levels may force high quality  Speed - location of inventory has gigantic effect on speed  Flexibility - location, level of anticipatory inventory both have effects  Cost - direct: purchasing, delivery, manufacturing indirect: holding, stockout. HR systems may promote this-3 year postings
  • 10.
    Nature of Inventory: FunctionalRoles of Inventory  Transit  Buffer  Seasonal  Decoupling  Speculative  Lot Sizing or Cycle  Mistakes
  • 11.
    Design of InventoryMgmt. Systems: Macro Issues  Need for Finished Goods Inventories  Need to satisfy internal or external customers?  Can someone else in the value chain carry the inventory?  Ownership of Inventories  Specific Contents of Inventories  Locations of Inventories  Tracking
  • 12.
    How to MeasureInventory  The Dilemma: closely monitor and control inventories to keep them as low as possible while providing acceptable customer service.  Average Aggregate Inventory Value: how much of the company’s total assets are invested in inventory?  Ford:6.825 billion  Sears: 4.039 billion
  • 13.
    Inventory Measures  Weeks of Supply  Ford: 3.51 weeks  Sears: 9.2 weeks  Inventory Turnover (Turns)  Ford: 14.8 turns  Sears: 5.7 turns  GM: 8 turns  Toyota: 35 turns
  • 14.
    Reasons Against Inventory  Non-value added costs  Opportunity cost  Complacency  Inventory deteriorates, becomes obsolete, lost, stolen, etc.
  • 15.
    Inventory Costs  Procurement costs  Carrying costs  Out-of-stock costs
  • 16.
    Procurement Costs  Order processing  Shipping  Handling  Purchasing cost: c(x)= $100 + $5x  Mfg. cost: c(x)=$1,000 + $10x
  • 17.
    Carrying Costs  Capital (opportunity) costs  Inventory risk costs  Space costs  Inventory service costs
  • 18.
    Out-of-Stock Costs  Lost sales cost  Back-order cost
  • 19.
    Independent Demand  Independent demand items are finished products or parts that are shipped as end items to customers.  Forecasting plays a critical role  Due to uncertainty- extra units must be carried in inventory
  • 20.
    Dependent Demand  Dependent demand items are raw materials, component parts, or subassemblies that are used to produce a finished product.  MRP systems---next week
  • 21.
    Design of InventoryMgmt. Systems: Micro Issues  Order Quantity Economic Order Quantity  Order Timing  Reorder Point
  • 22.
    Objectives of Inventory Control  1) Maximize the level of customer service by avoiding understocking.  2) Promote efficiency in production and purchasing by minimizing the cost of providing an adequate level of customer service.
  • 23.
    Balance in InventoryLevels  When should the company replenish its inventory, or when should the company place an order or manufacture a new lot?  How much should the company order or produce?  Next: Economic Order Quantity
  • 24.
    Models for InventoryManagement: EOQ  EOQ minimizes the sum of holding and setup costs  Q = 2DCo/Ch D = annual demand Co = ordering/setup costs Ch = cost of holding one unit of inventory
  • 25.
    Seatide  EOQ = 2DCo/Ch D = annual demand = 6,000 Co = ordering/setup costs = $60 Ch = cost of holding one unit of inventory $3.00 x 24% = .72 720,000 2 x 6,000 x 60 .72 1,000 .72
  • 26.
    Marginal Analysis Holding Costs $ Ordering Costs Units
  • 27.
    Reorder Point  Quantity to which inventory is allowed to drop before replenishment order is made  Need to order EOQ at the Reorder Point: ROP = D X LT D = Demand rate per period LT = lead time in periods
  • 28.
    Sawtooth Model level of inventory average inventory units Q t time
  • 29.
    Q - SystemInventory Control  based on reorder point - When inventory is depleted to ROP, order replenishment of quantity EOQ.
  • 30.
    Order Quantities  when demand is smooth and continuous, can operate response- based system by determining  best quantity to replenish periodic demand (EOQ)  frequency of replenishment (ROP)  Reorder Point
  • 31.
    Planning for Uncertainty  changing lead times  changing demand  Uncertainty creeps in:  Plug in safety stock Safety stock - allows manager to determine the probability of stock levels - based on desired customer service levels
  • 32.
    Inventory Model Under Uncertainty reorder Qm point safety stock time
  • 33.
    Models for InventoryManagement: Quantity Discount  Basically EOQ with quantity discounts  To solve: 1. Write out the total cost equation 2. Solve EOQ at highest price and no discounts 3. If Qmin falls in a range with a lower price, recalculate EOQ assuming holding cost for that range. Call this Q2. 4. Evaluate the total cost equation at Q2 at the next highest price break point. OR Use a spreadsheet
  • 34.
    P-System Periodic Review Method  an alternative to ROP/Q-system control is periodic review method  Q-system - each stock item reordered at different times - complex, no economies of scope or common prod./transport runs  P-system - inventory levels for multiple stock items reviewed at same time - can be reordered together  higher carrying costs - not optimum, but more practical
  • 35.
    Using P-System  audit inventory level at interval (T)  quantity to place on order is difference between max. quantity (M) and amount on hand at time of review  management task - set optimal T and M to balance stock availability and cost  In ABC analysis, which items would use P-system???
  • 36.
    Types of InventorySystems  By Degree of Control required  often use grouping method, such as ABC
  • 37.
    Classifying Inventory Items  ABC Classification (Pareto Principle)  A Items: very tight control, complete and accurate records, frequent review  B Items: less tightly controlled, good records, regular review  C Items: simplest controls possible, minimal records, large inventories, periodic review and reorder
  • 38.
    Does ABC ClassificationMake Sense for an Assembler?  i.e. – Gateway Computers
  • 39.
    Planning Supply ChainActivities Anticipatory - allocate supply to each warehouse based on the forecast Response-based - replenish inventory with order sizes based on specific needs of each warehouse
  • 40.
    Anticipatory Inventory Control  determine requirements by forecasting demand for the next production run or purchase  establish current on-hand quantities  add appropriate safety stock based on desired stock availability levels and uncertainty demand levels  determine how much new production or purchase needed (total needed - on-hand)
  • 41.
    Response-Based System  replenishment, production, or purchases of stock are made only when it has been signaled that there is a need for product downstream  requires shorter order cycle time, often more frequent, lower volume orders  determine stock requirements to meet only most immediate planning period (usually about 3 weeks)
  • 42.
    Service Level Achieved •Itemfill rate (IFR): the probability of filling an order for 1 item from current stock expected number of units out of stock/year 1- total annual demand •Weighted Average Fill Rate (WAFR): multiply IFR for each stock item on an order weighted by the ordering frequency for the item