Downloaded 47 times


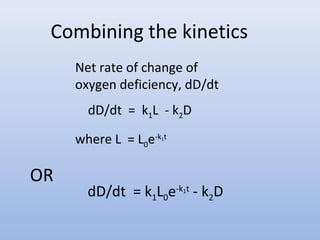
![Kinetics* for Streeter-Phelps Model
• Deoxygenation
L = BOD remaining at any time
dL/dt = Rate of deoxygenation equivalent to rate of BOD removal
dL/dt = -k1L for a first order reaction
k1 = deoxygenation constant, f’n of waste type and temp.
dL
-d[L] = kL
ò C
=- ò dt
C
t k dt
L
0 0
e kt L L e kt
L
L = - kt or L
= - - > = - 0
0 0
L
ln](https://image.slidesharecdn.com/introduction-140930003404-phpapp01/85/Introduction-27-320.jpg)
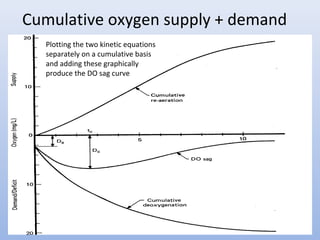
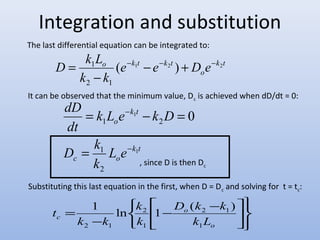
![Developing the Streeter-Phelps
Rate of reoxygenation = k2D
D = deficit in D.O.
k2 = reoxygenation constant*
([ ] )
2
3
2
( 20) 1 2
1
2
3.9 1.025
H
k v
T -
=
Where
– T = temperature of water, ºC
– H = average depth of flow, m
– ν = mean stream velocity, m/s
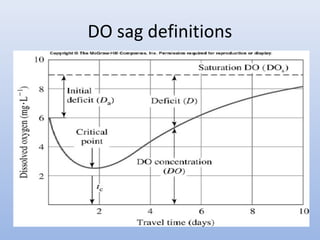
D.O. deficit
= saturation D.O. – D.O. in the water
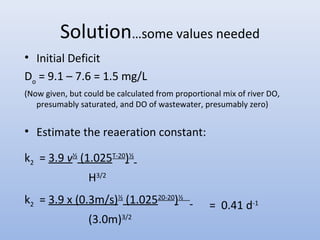
Typical values for k2 at 20 °C, 1/d (base e) are as follows:
small ponds and back water 0.10 - 0.23
sluggish streams and large lakes 0.23 - 0.35
large streams with low velocity 0.35 - 0.46
large streams at normal velocity 0.46 - 0.69
swift streams 0.69 - 1.15
rapids and waterfalls > 1.15
There are many correlations for this.
The simplest one, used here, is from
O’Connor and Dobbins, 1958](https://image.slidesharecdn.com/introduction-140930003404-phpapp01/85/Introduction-28-320.jpg)
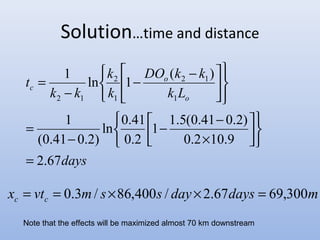
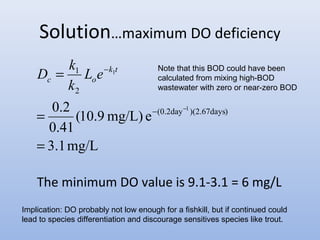

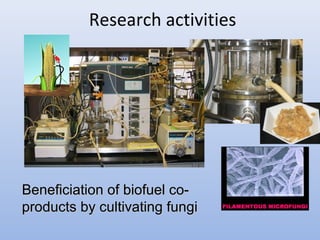
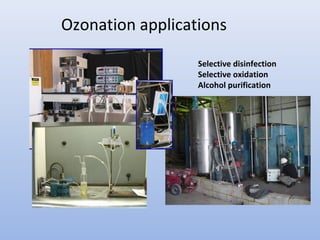
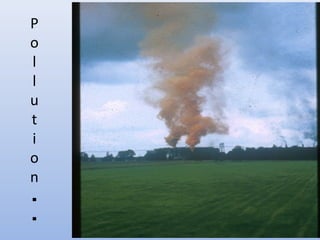
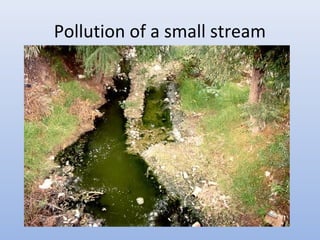
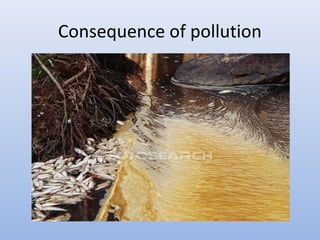
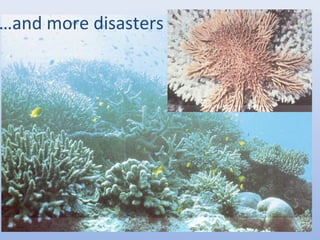
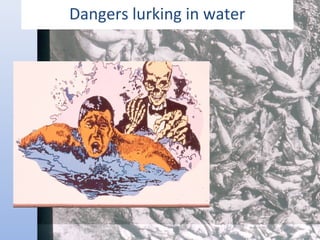
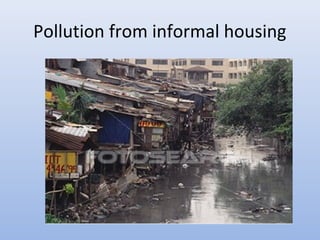
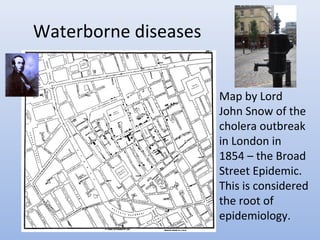
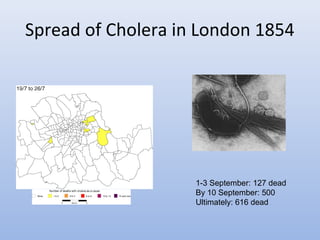
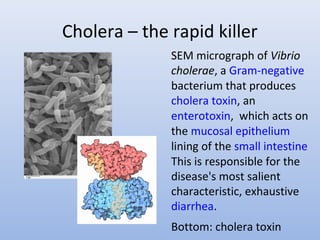
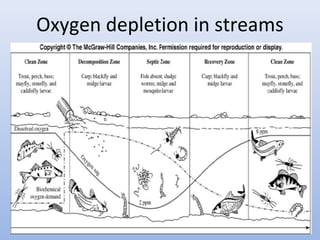
This document provides an introduction to physical-chemical water treatment. It discusses the instructor, Hans van Leeuwen, and his background and research interests in wastewater treatment and bioengineering. It then covers various topics related to water treatment including ozone applications, exotic species in ports, human technological development, pollution, waterborne diseases, dissolved oxygen, biochemical oxygen demand, oxygen depletion in streams, and uses the Streeter-Phelps model to analyze an example of oxygen sag in a river.