Download as PDF, PPTX
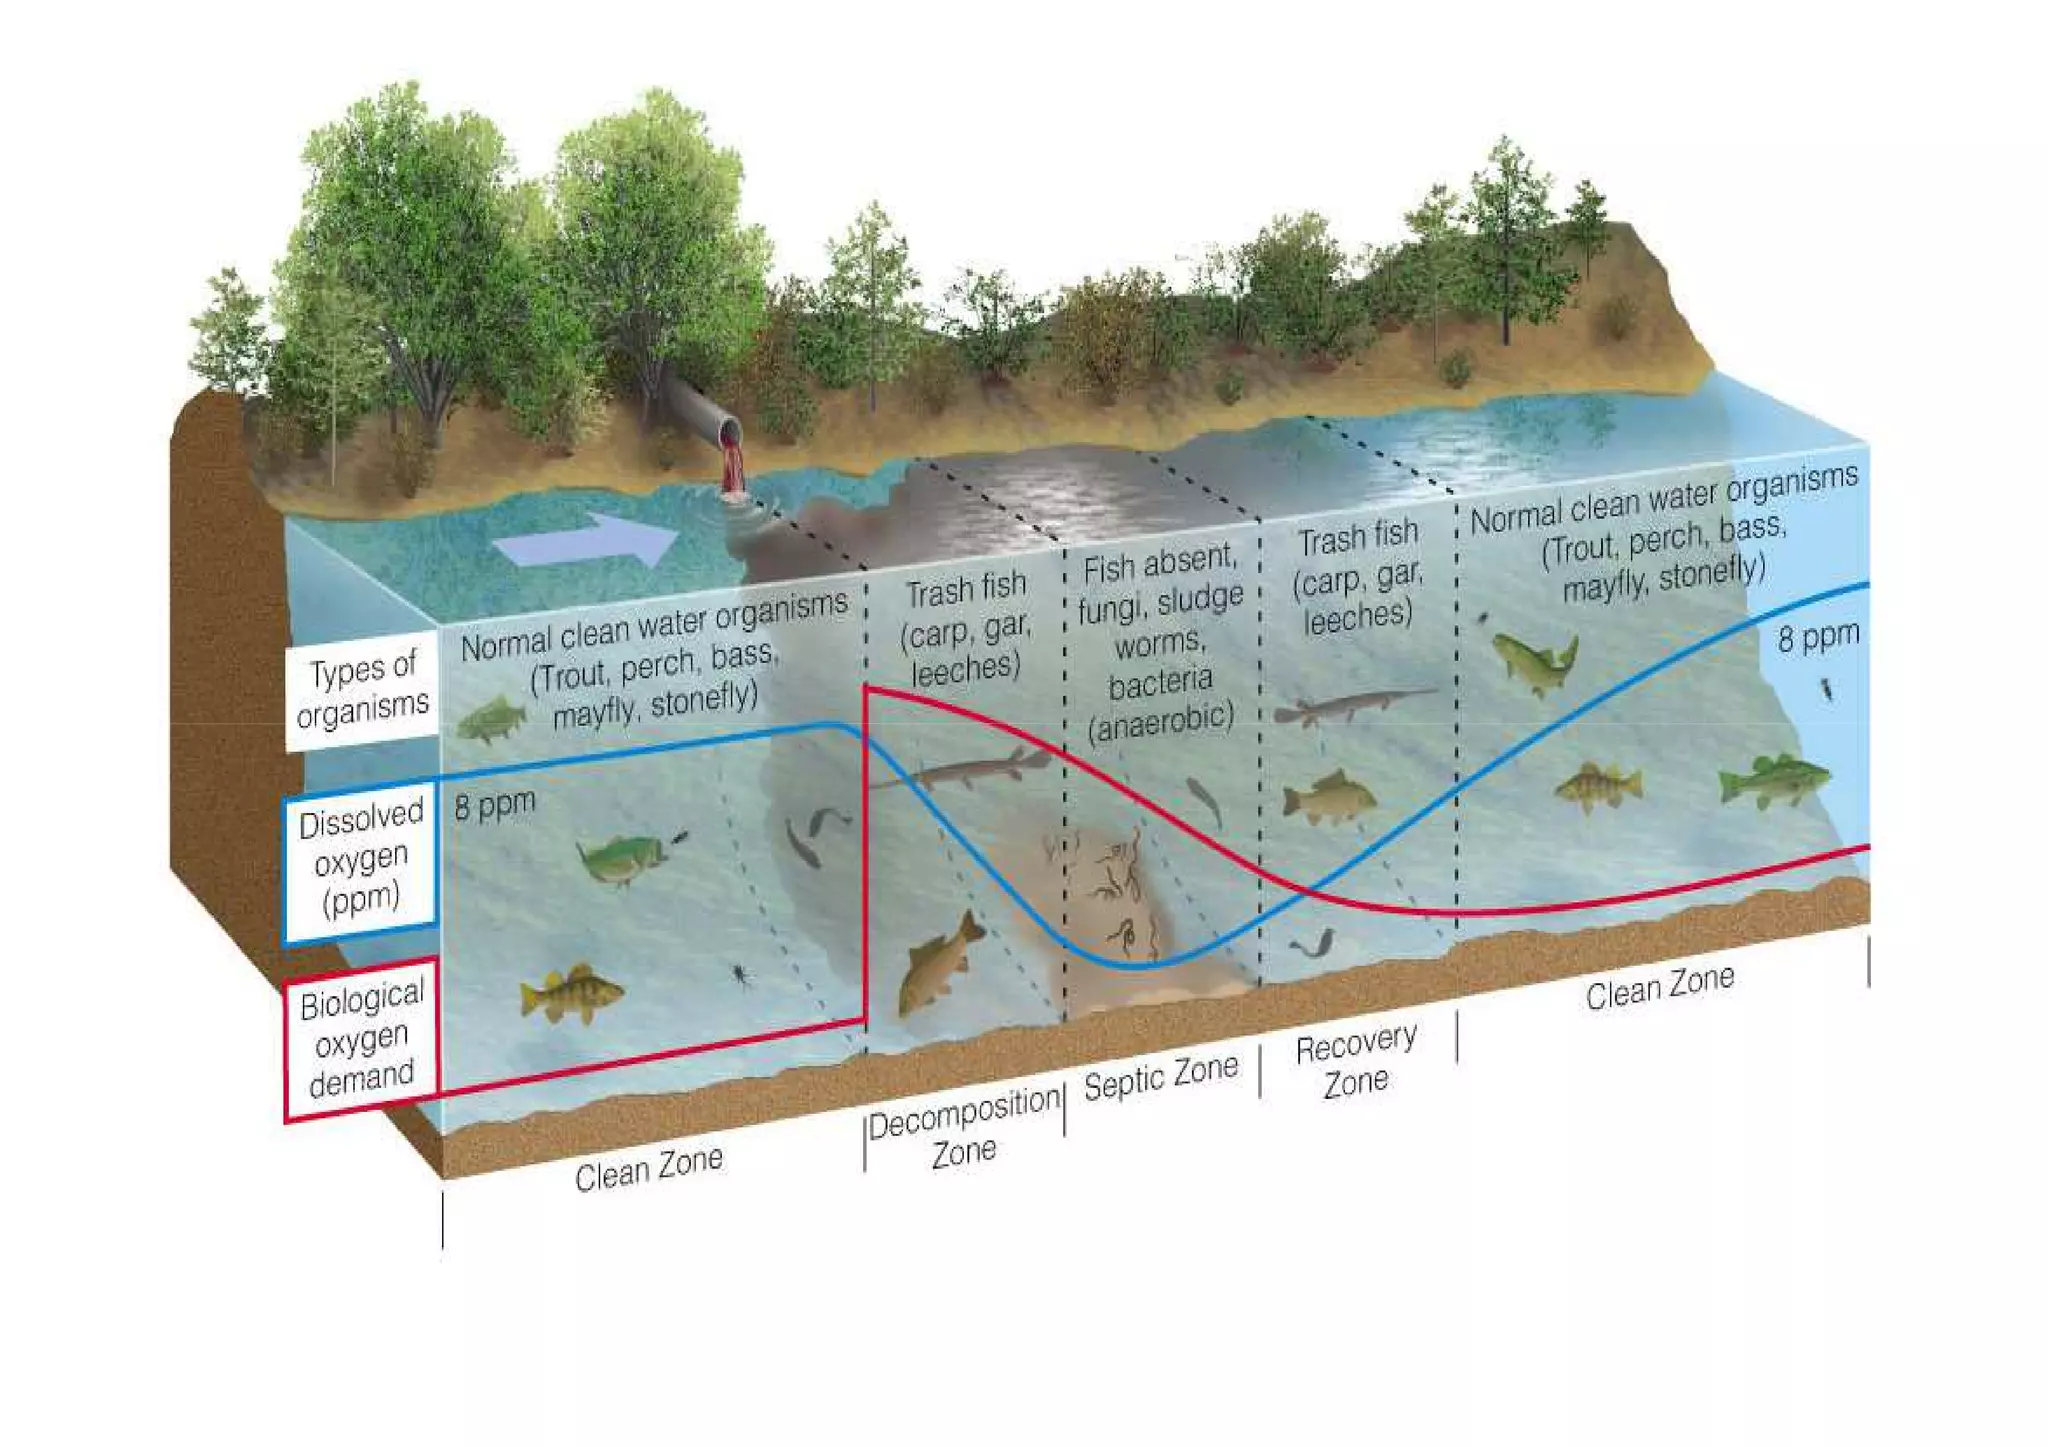
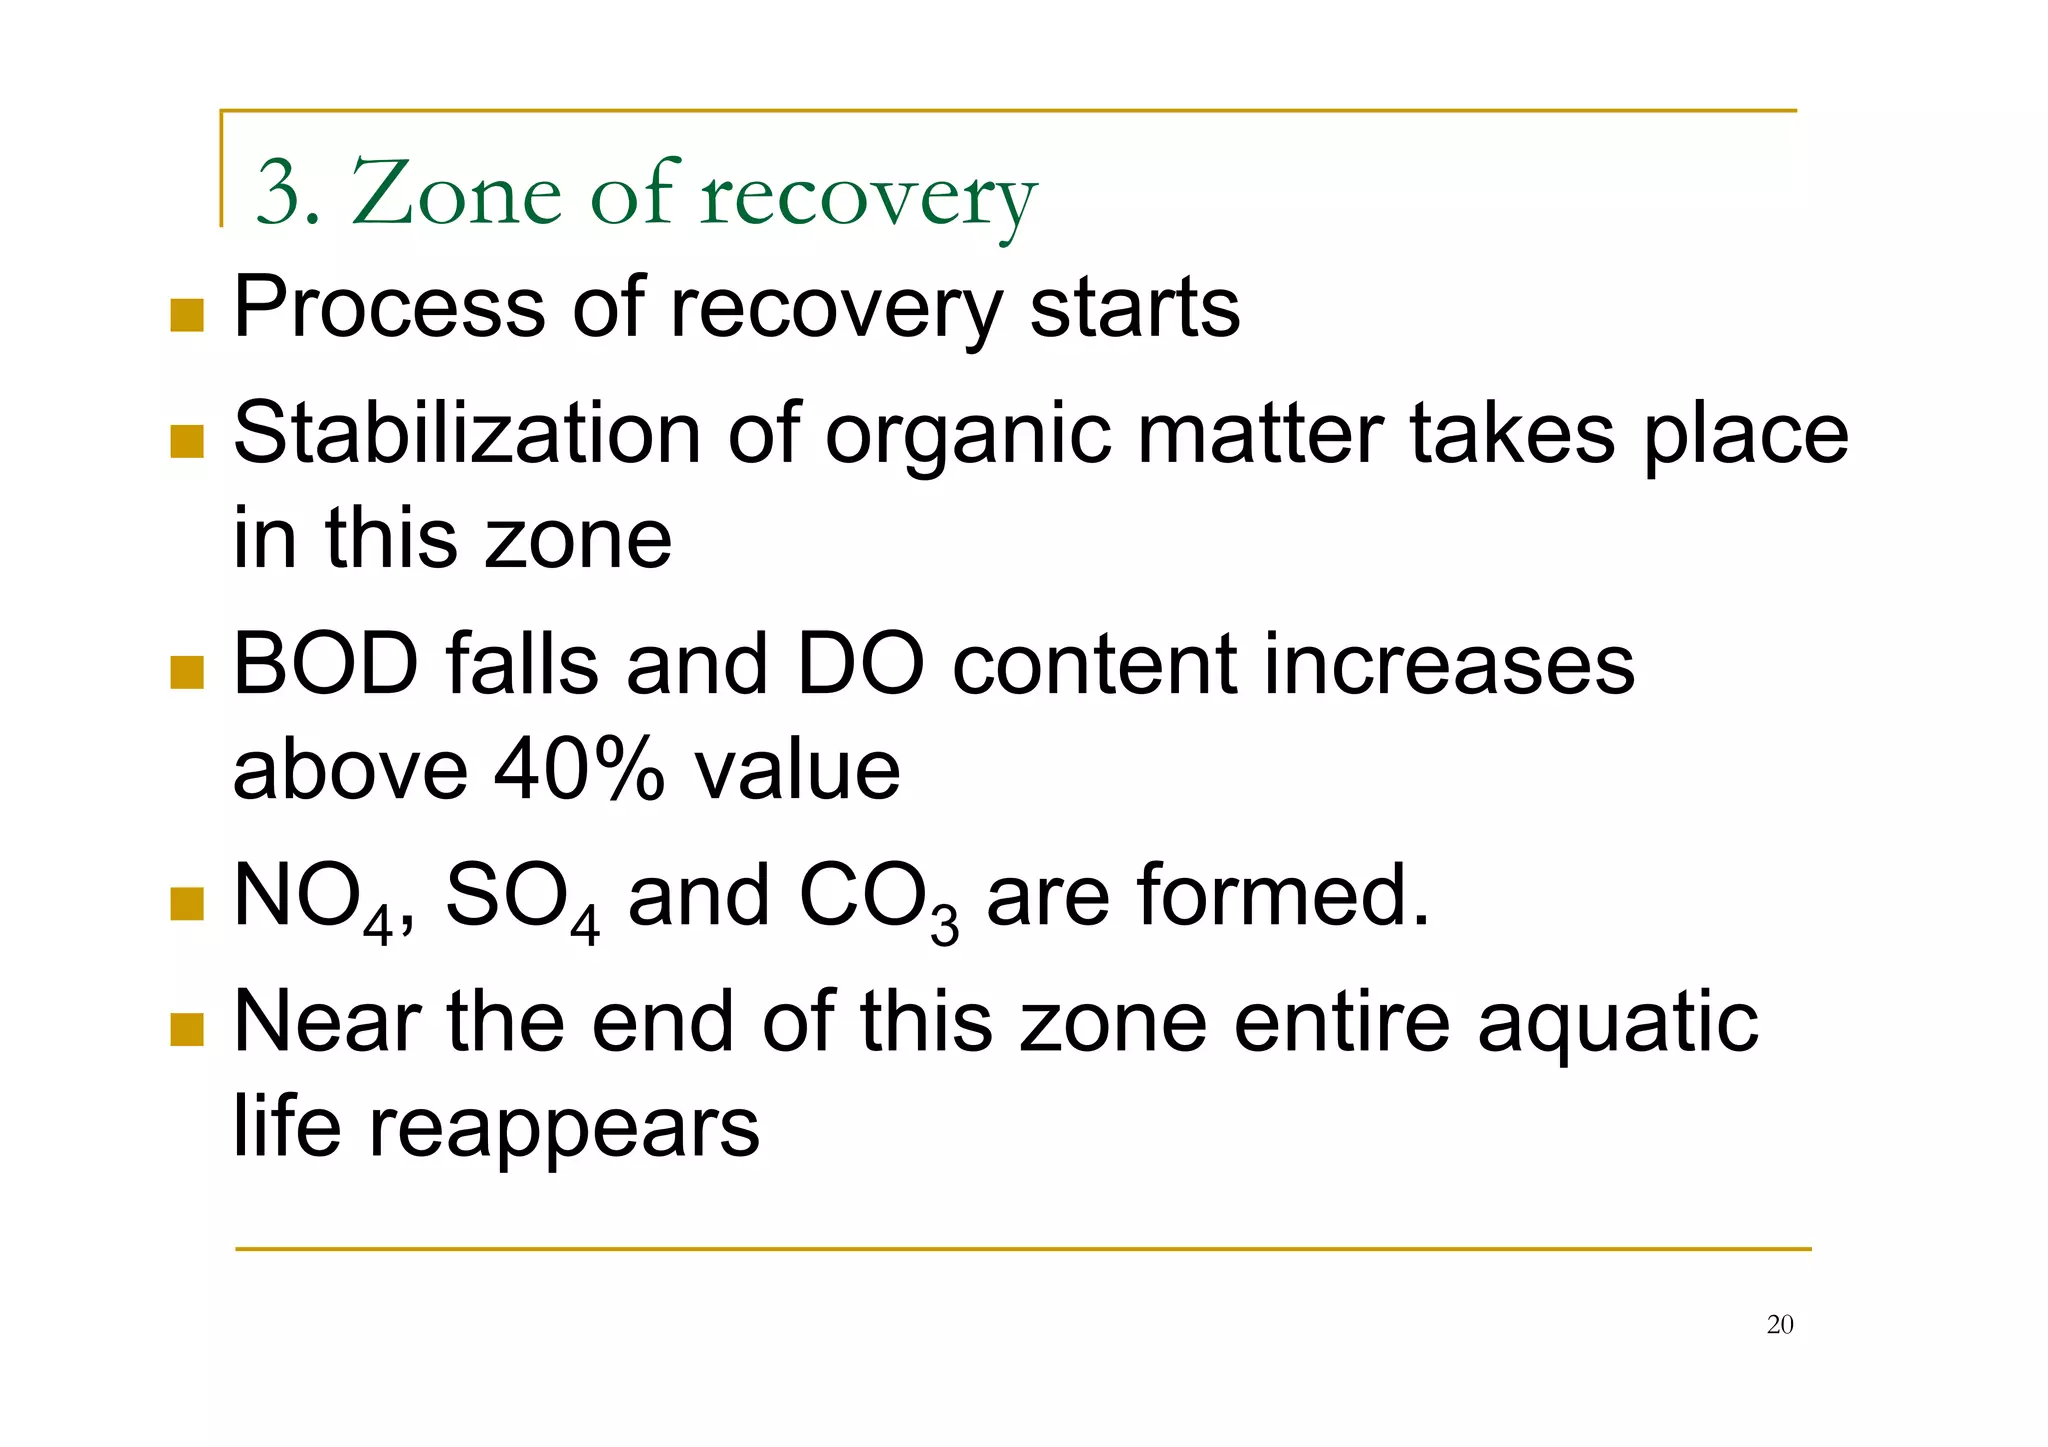
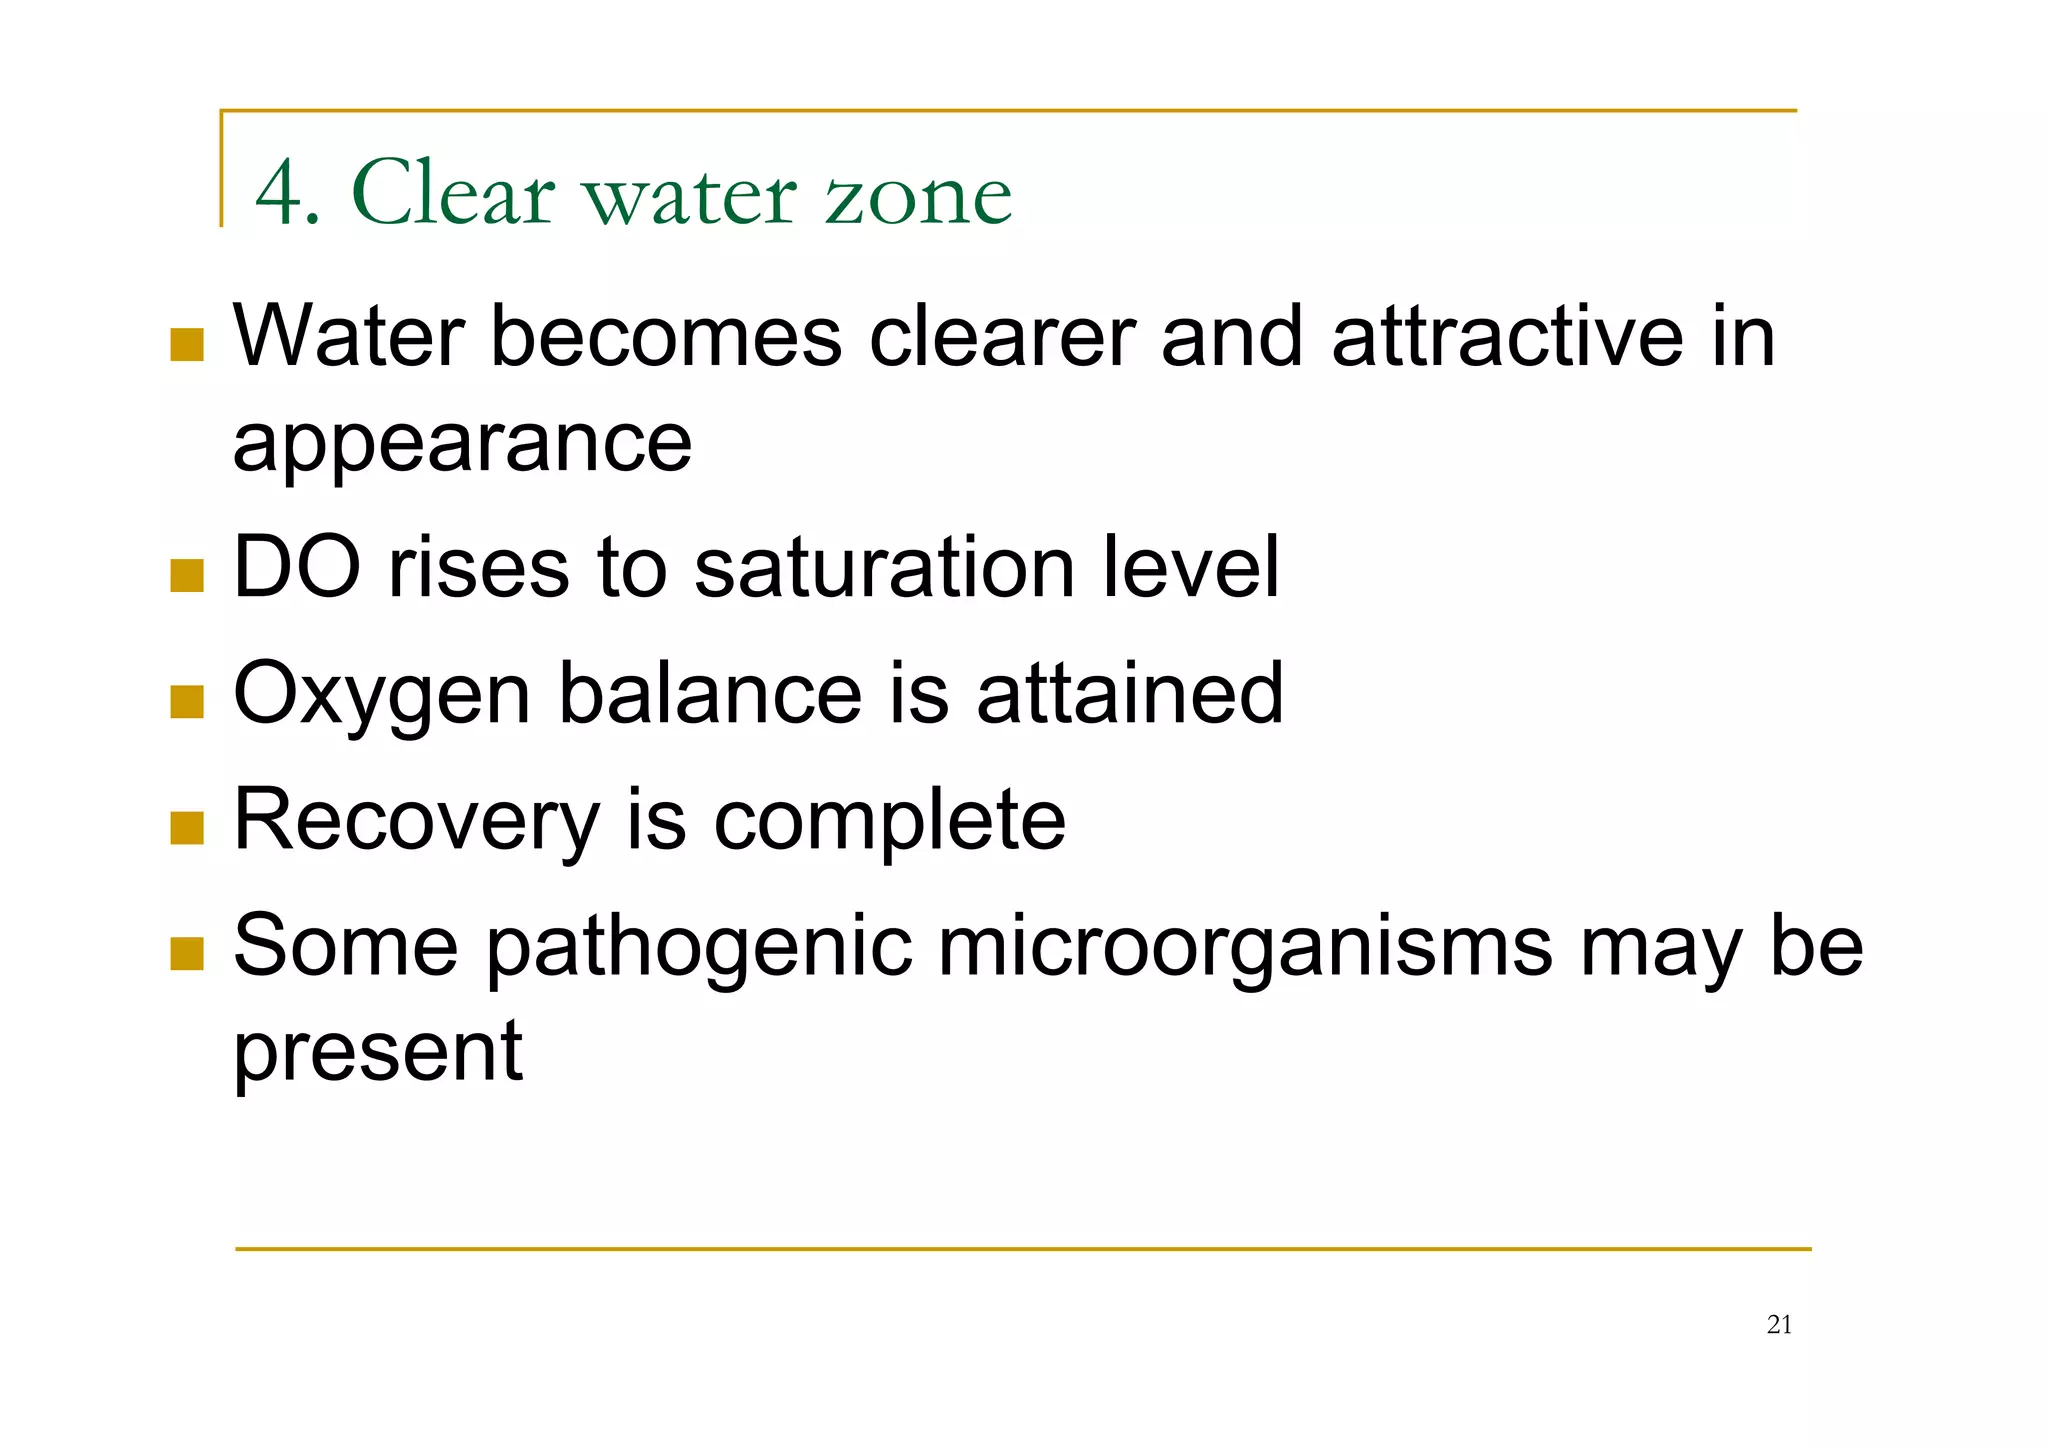
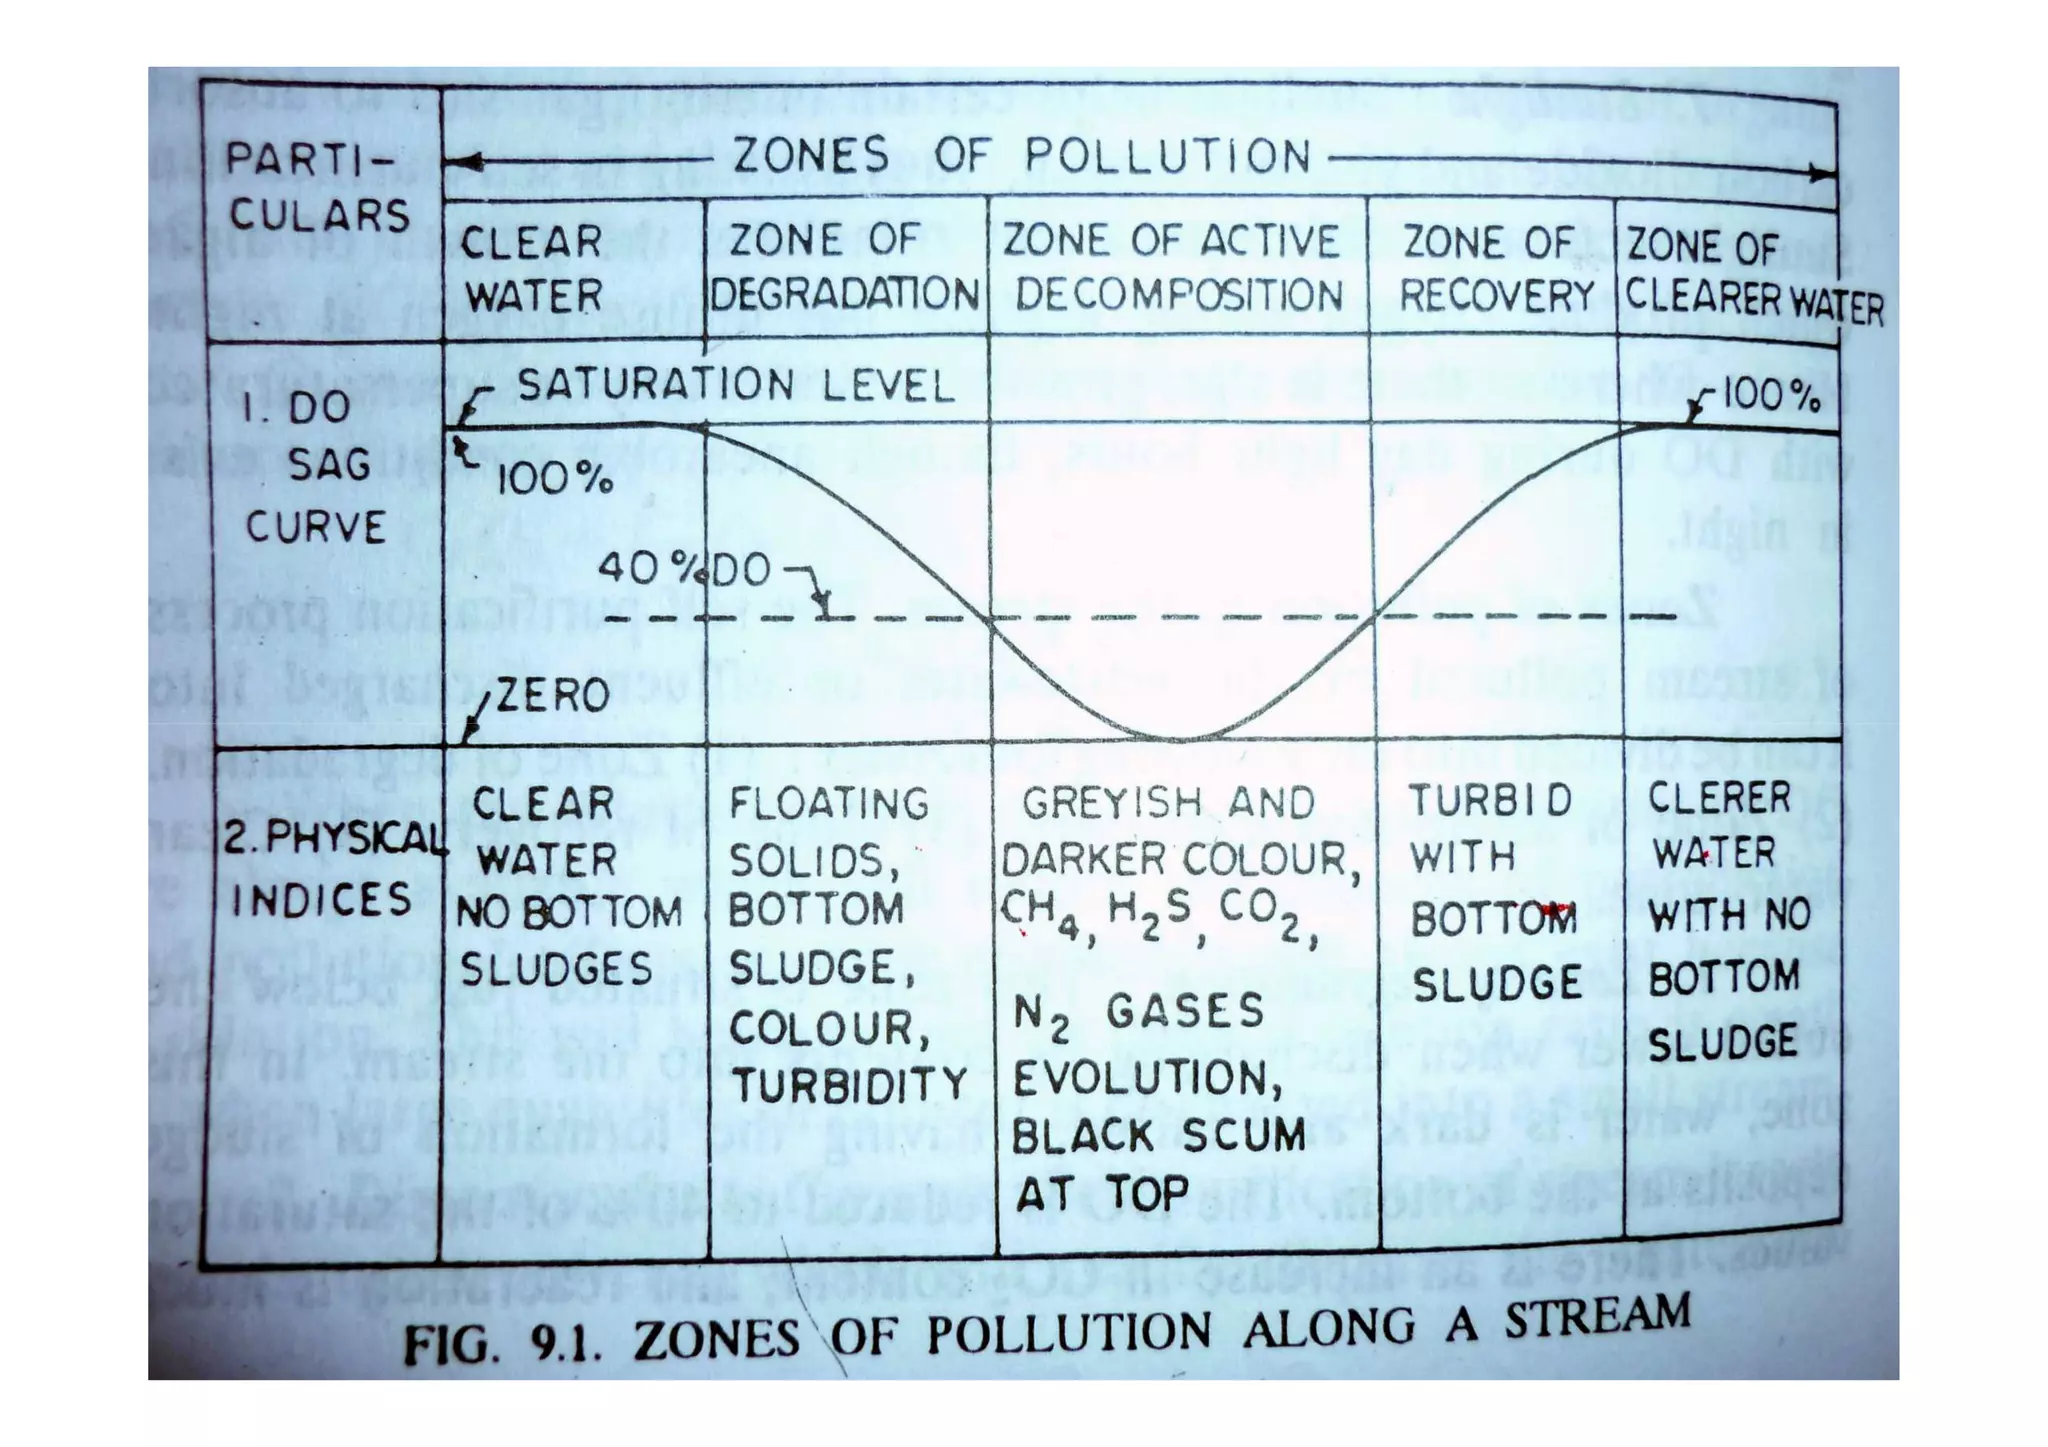


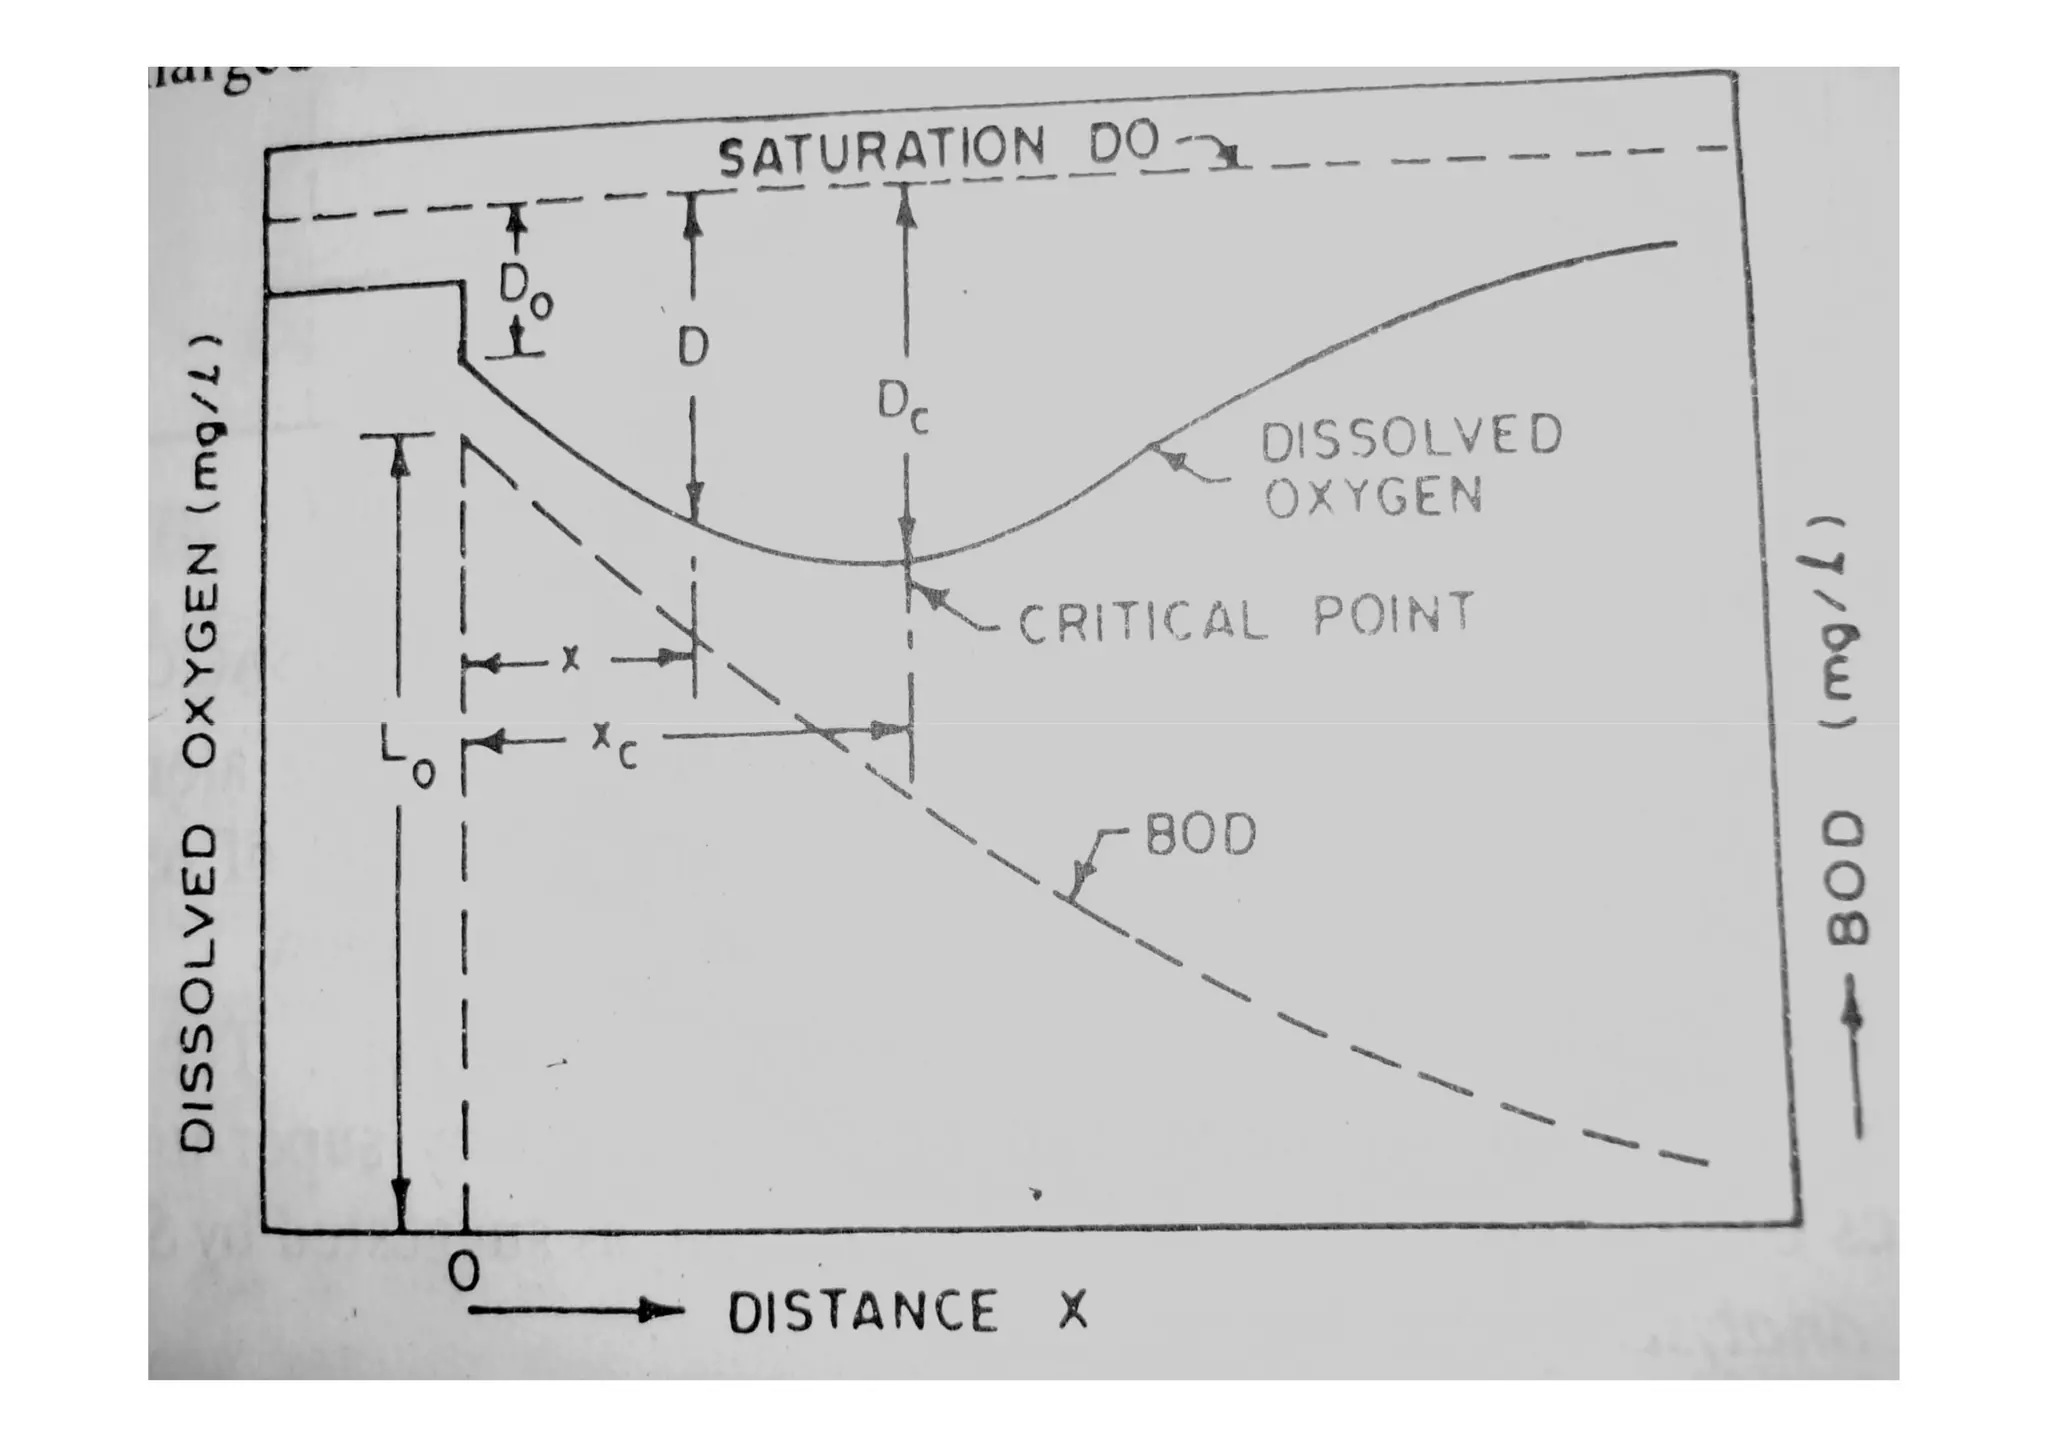
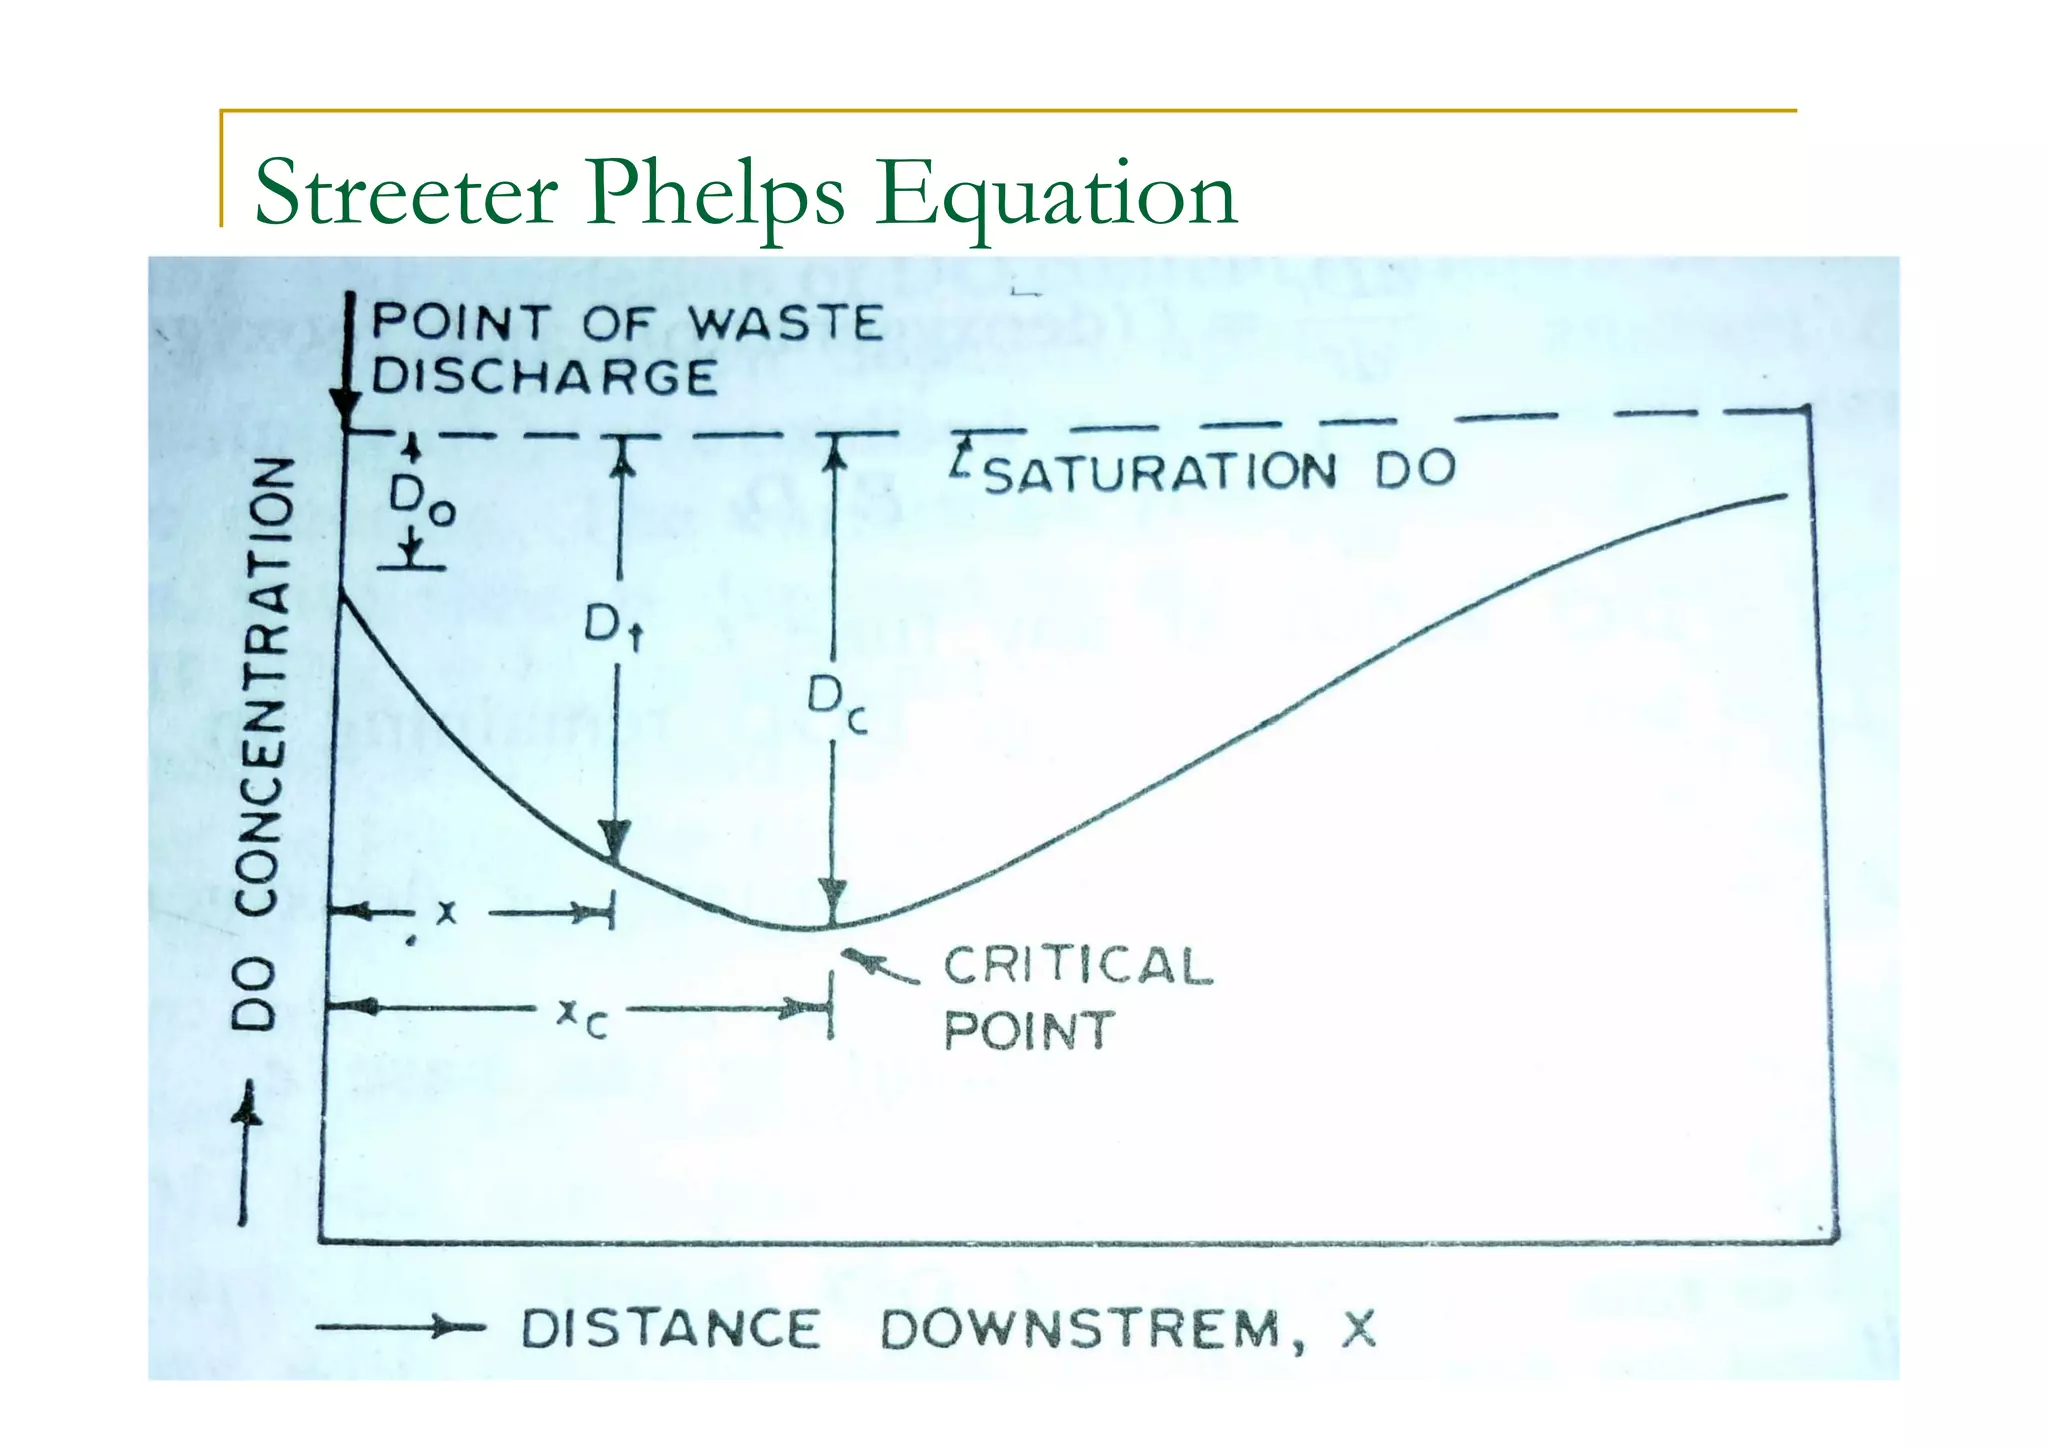

The document discusses the self-purification process of rivers and streams, detailing how wastewater discharged into these water bodies experiences a reduction in biochemical oxygen demand (BOD) and increases in dissolved oxygen (DO) over time. It outlines the various factors that influence this process, such as dilution, sedimentation, and the role of temperature and sunlight, and describes the zones of pollution within the stream. Additionally, it introduces the concepts of deoxygenation and reoxygenation, represented graphically by the DO sag curve, and addresses related equations and key questions on the topic.


![L 17 do sag [compatibility mode]](https://cdn.slidesharecdn.com/ss_thumbnails/l-17dosagcompatibilitymode-150311205622-conversion-gate01-thumbnail.jpg?width=640&height=640&fit=bounds)