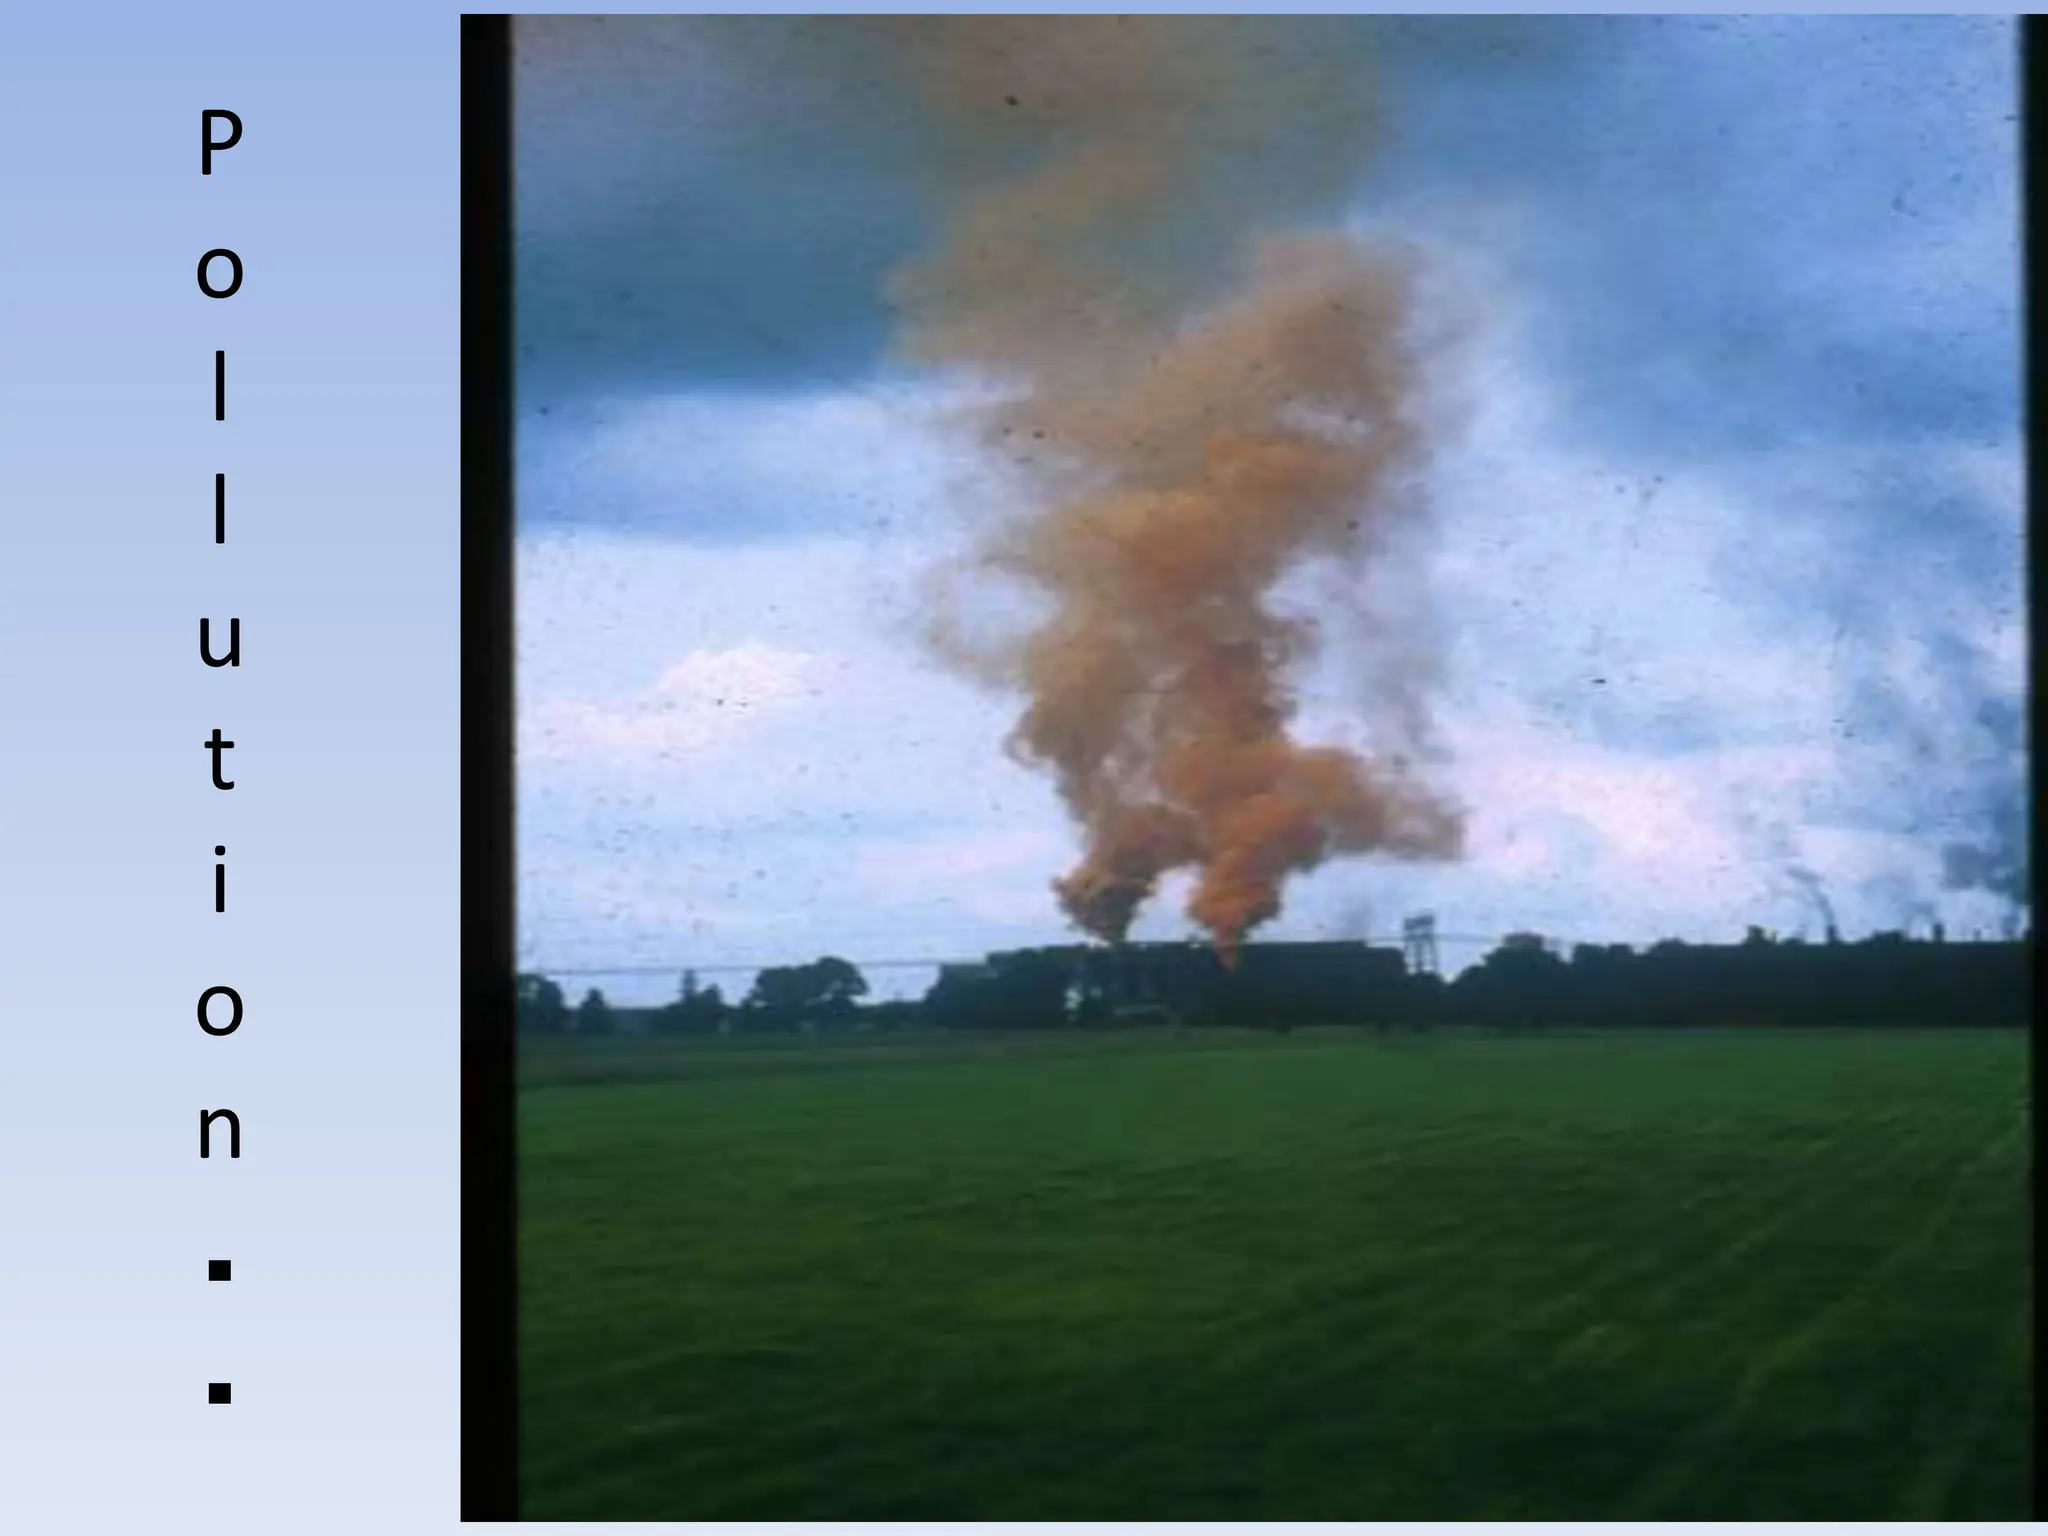
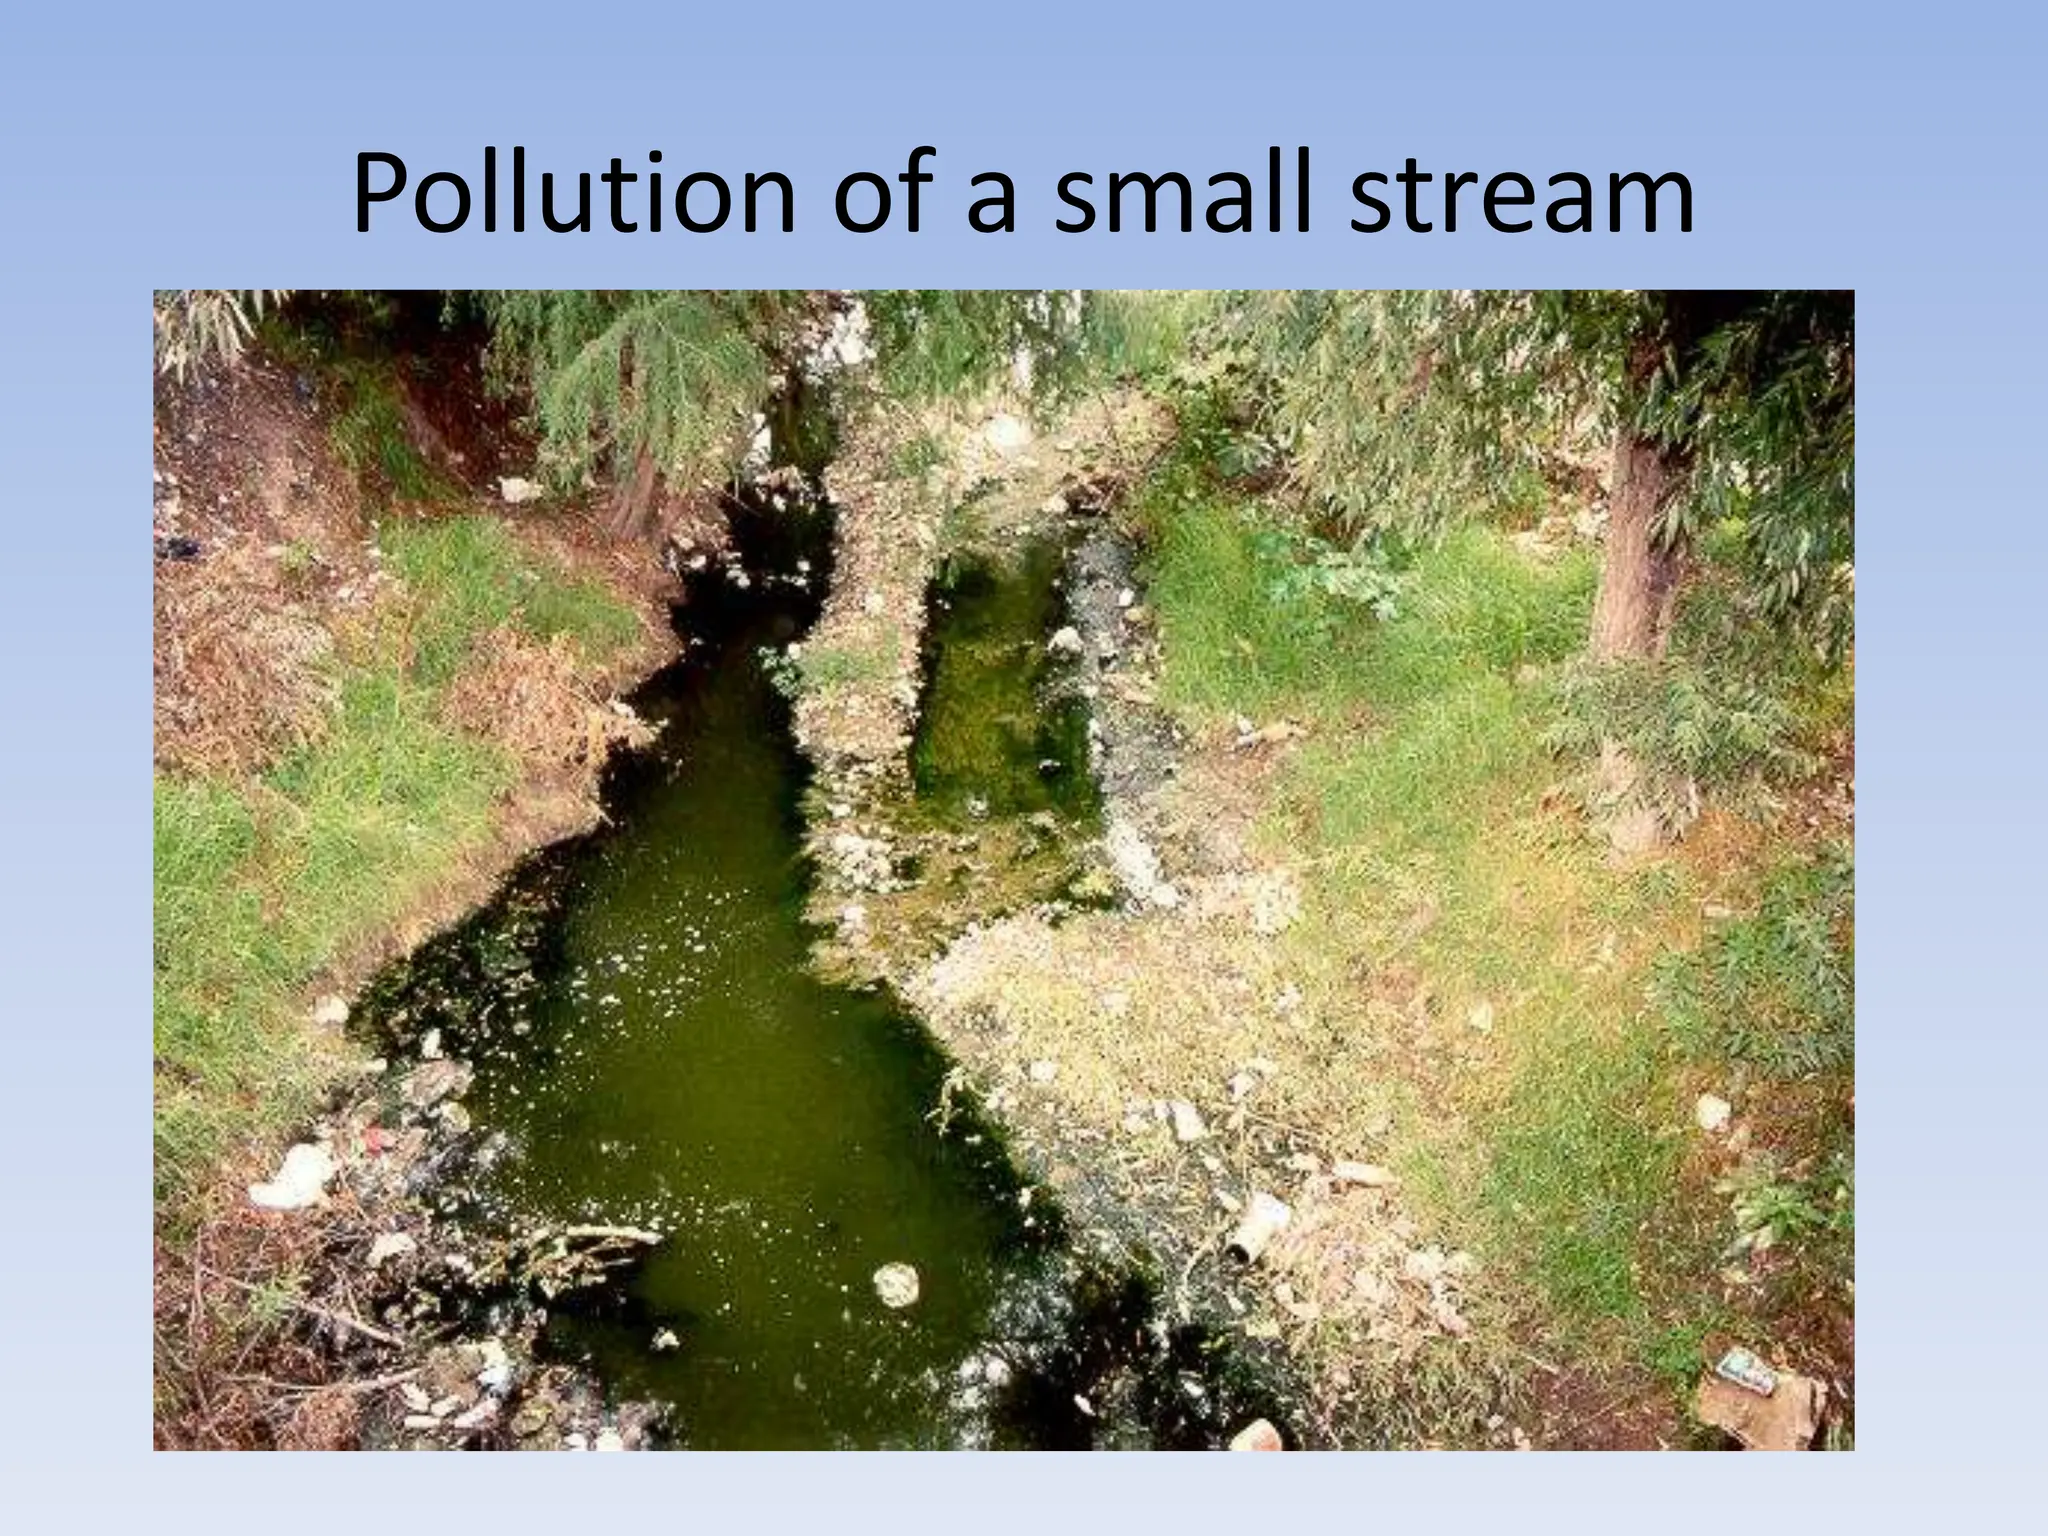
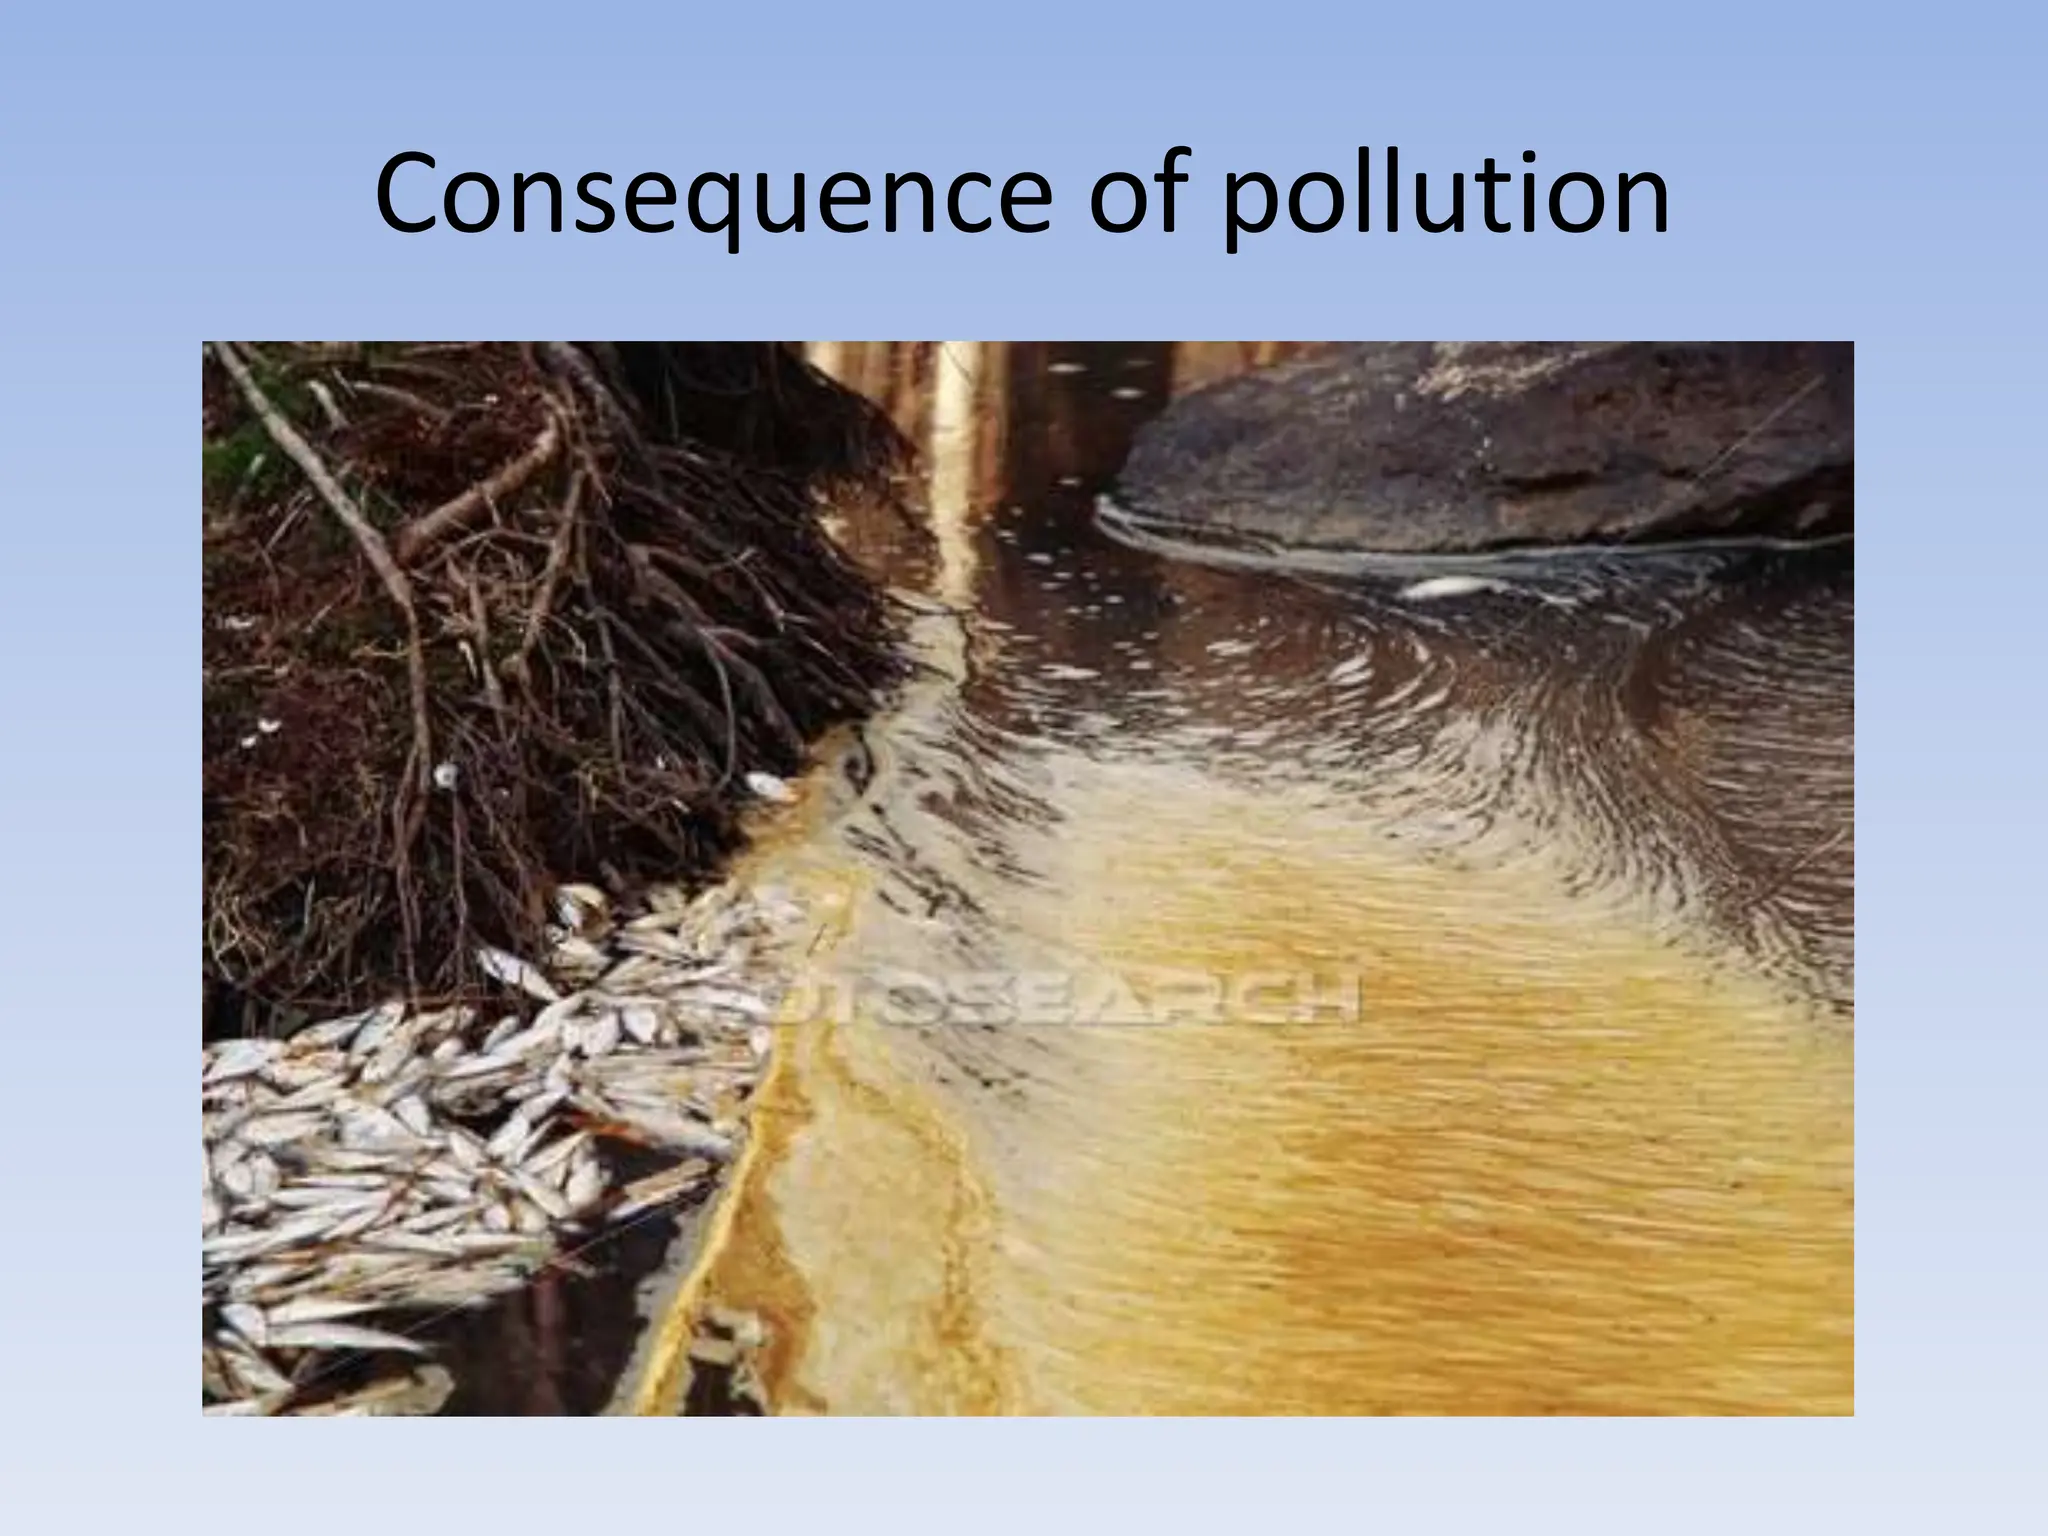
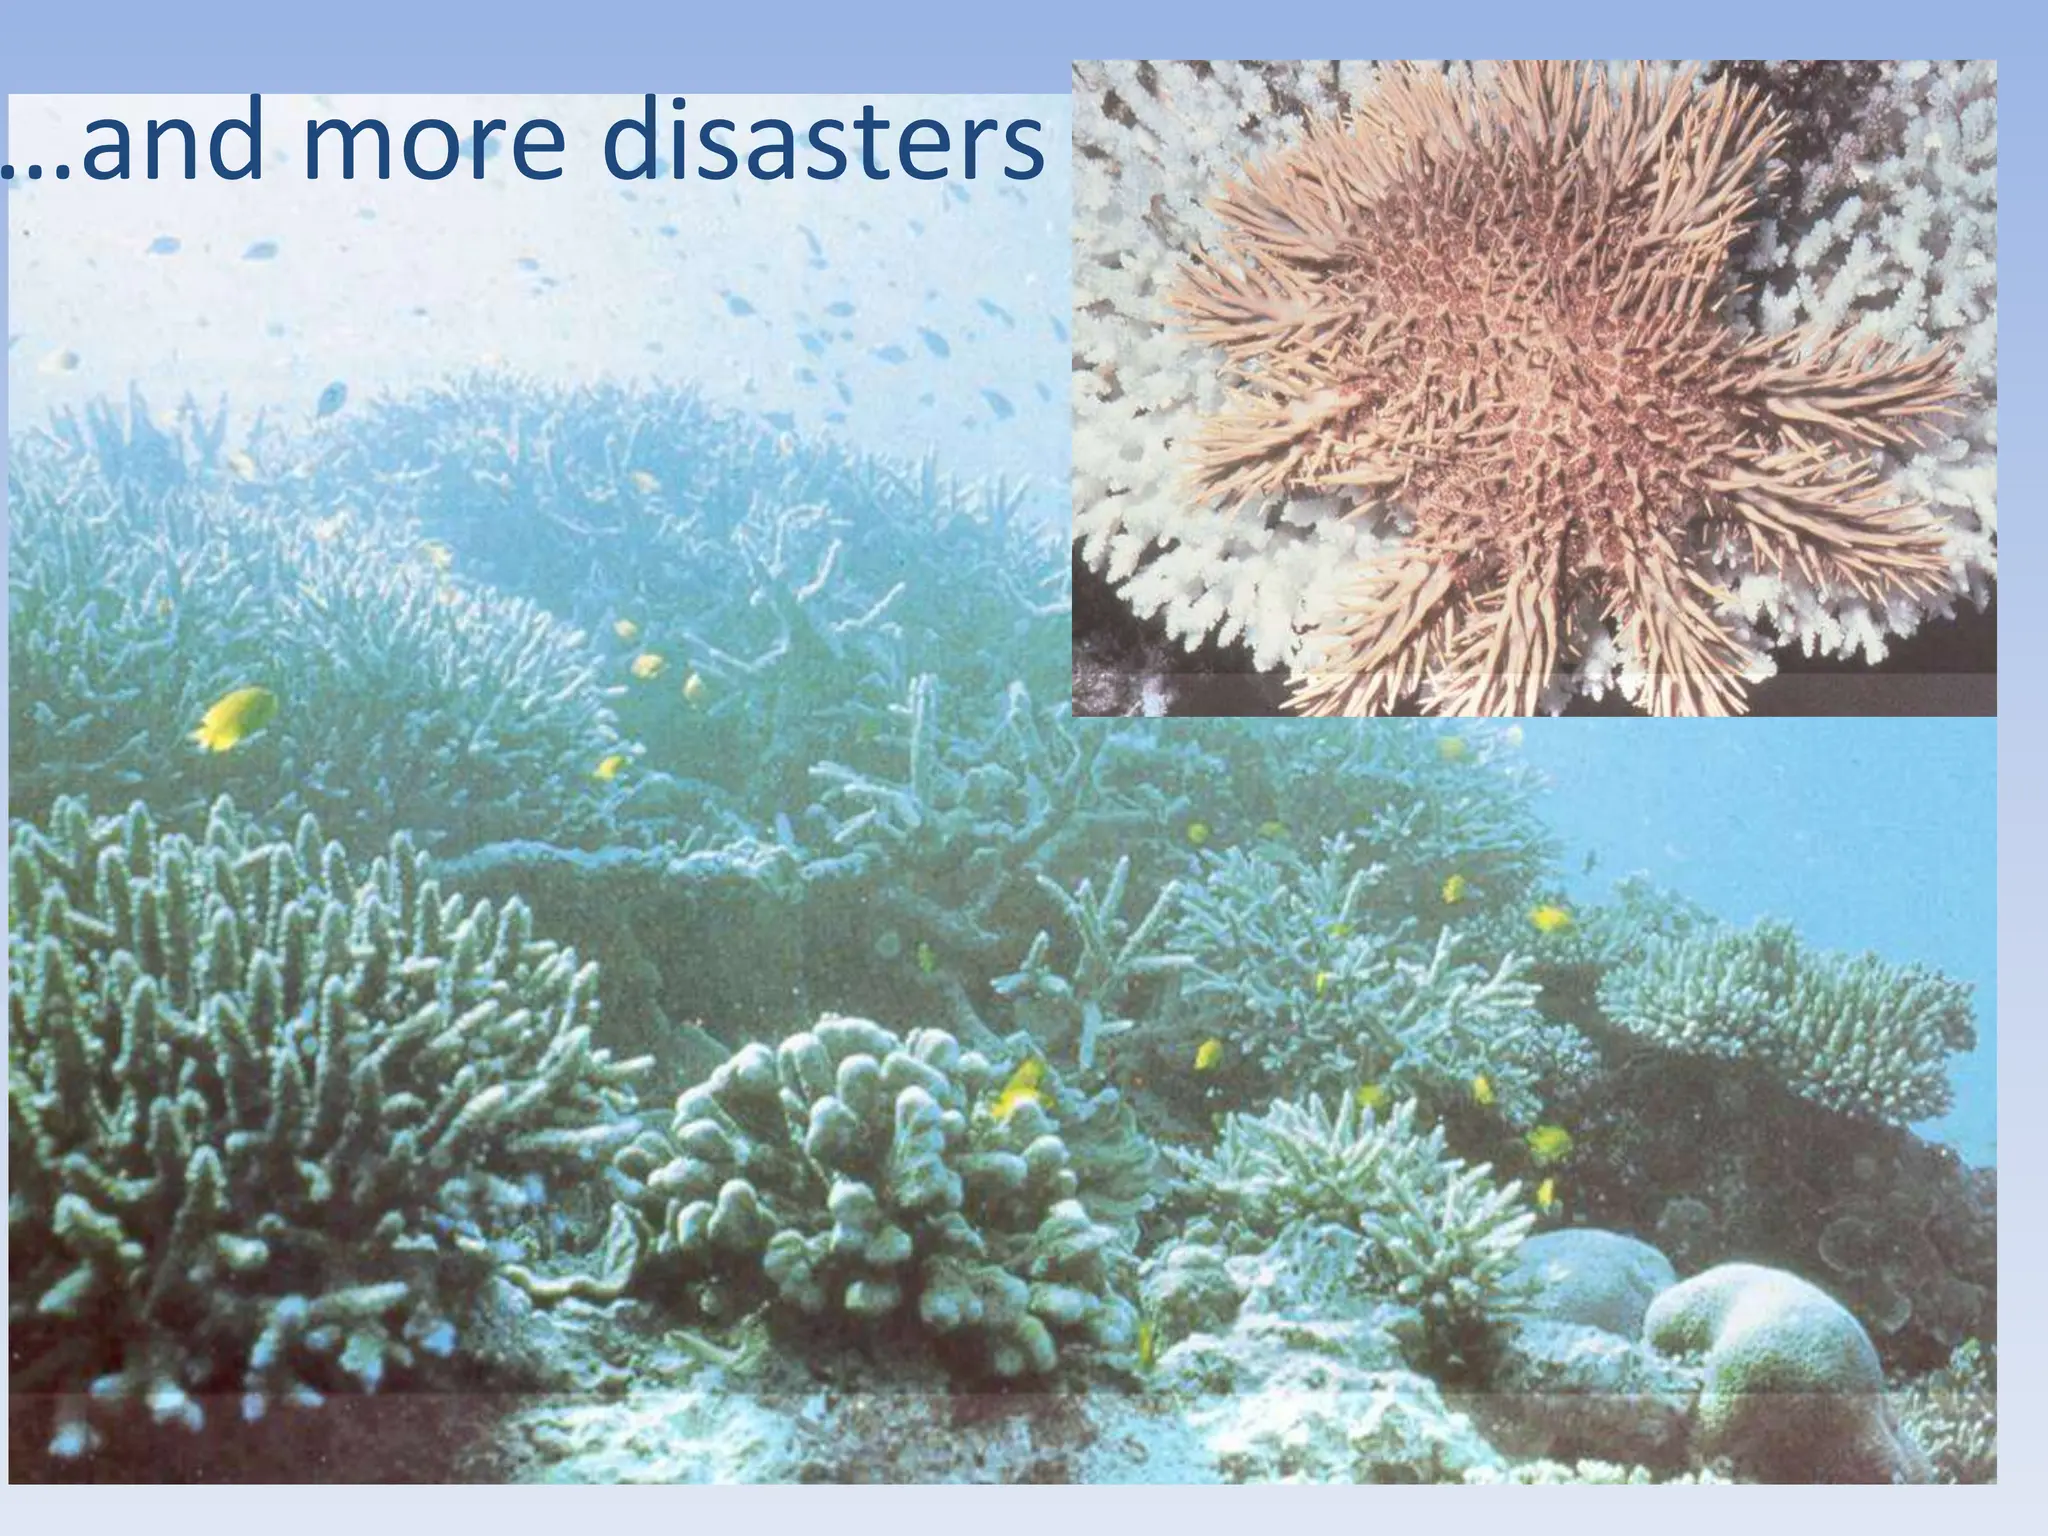
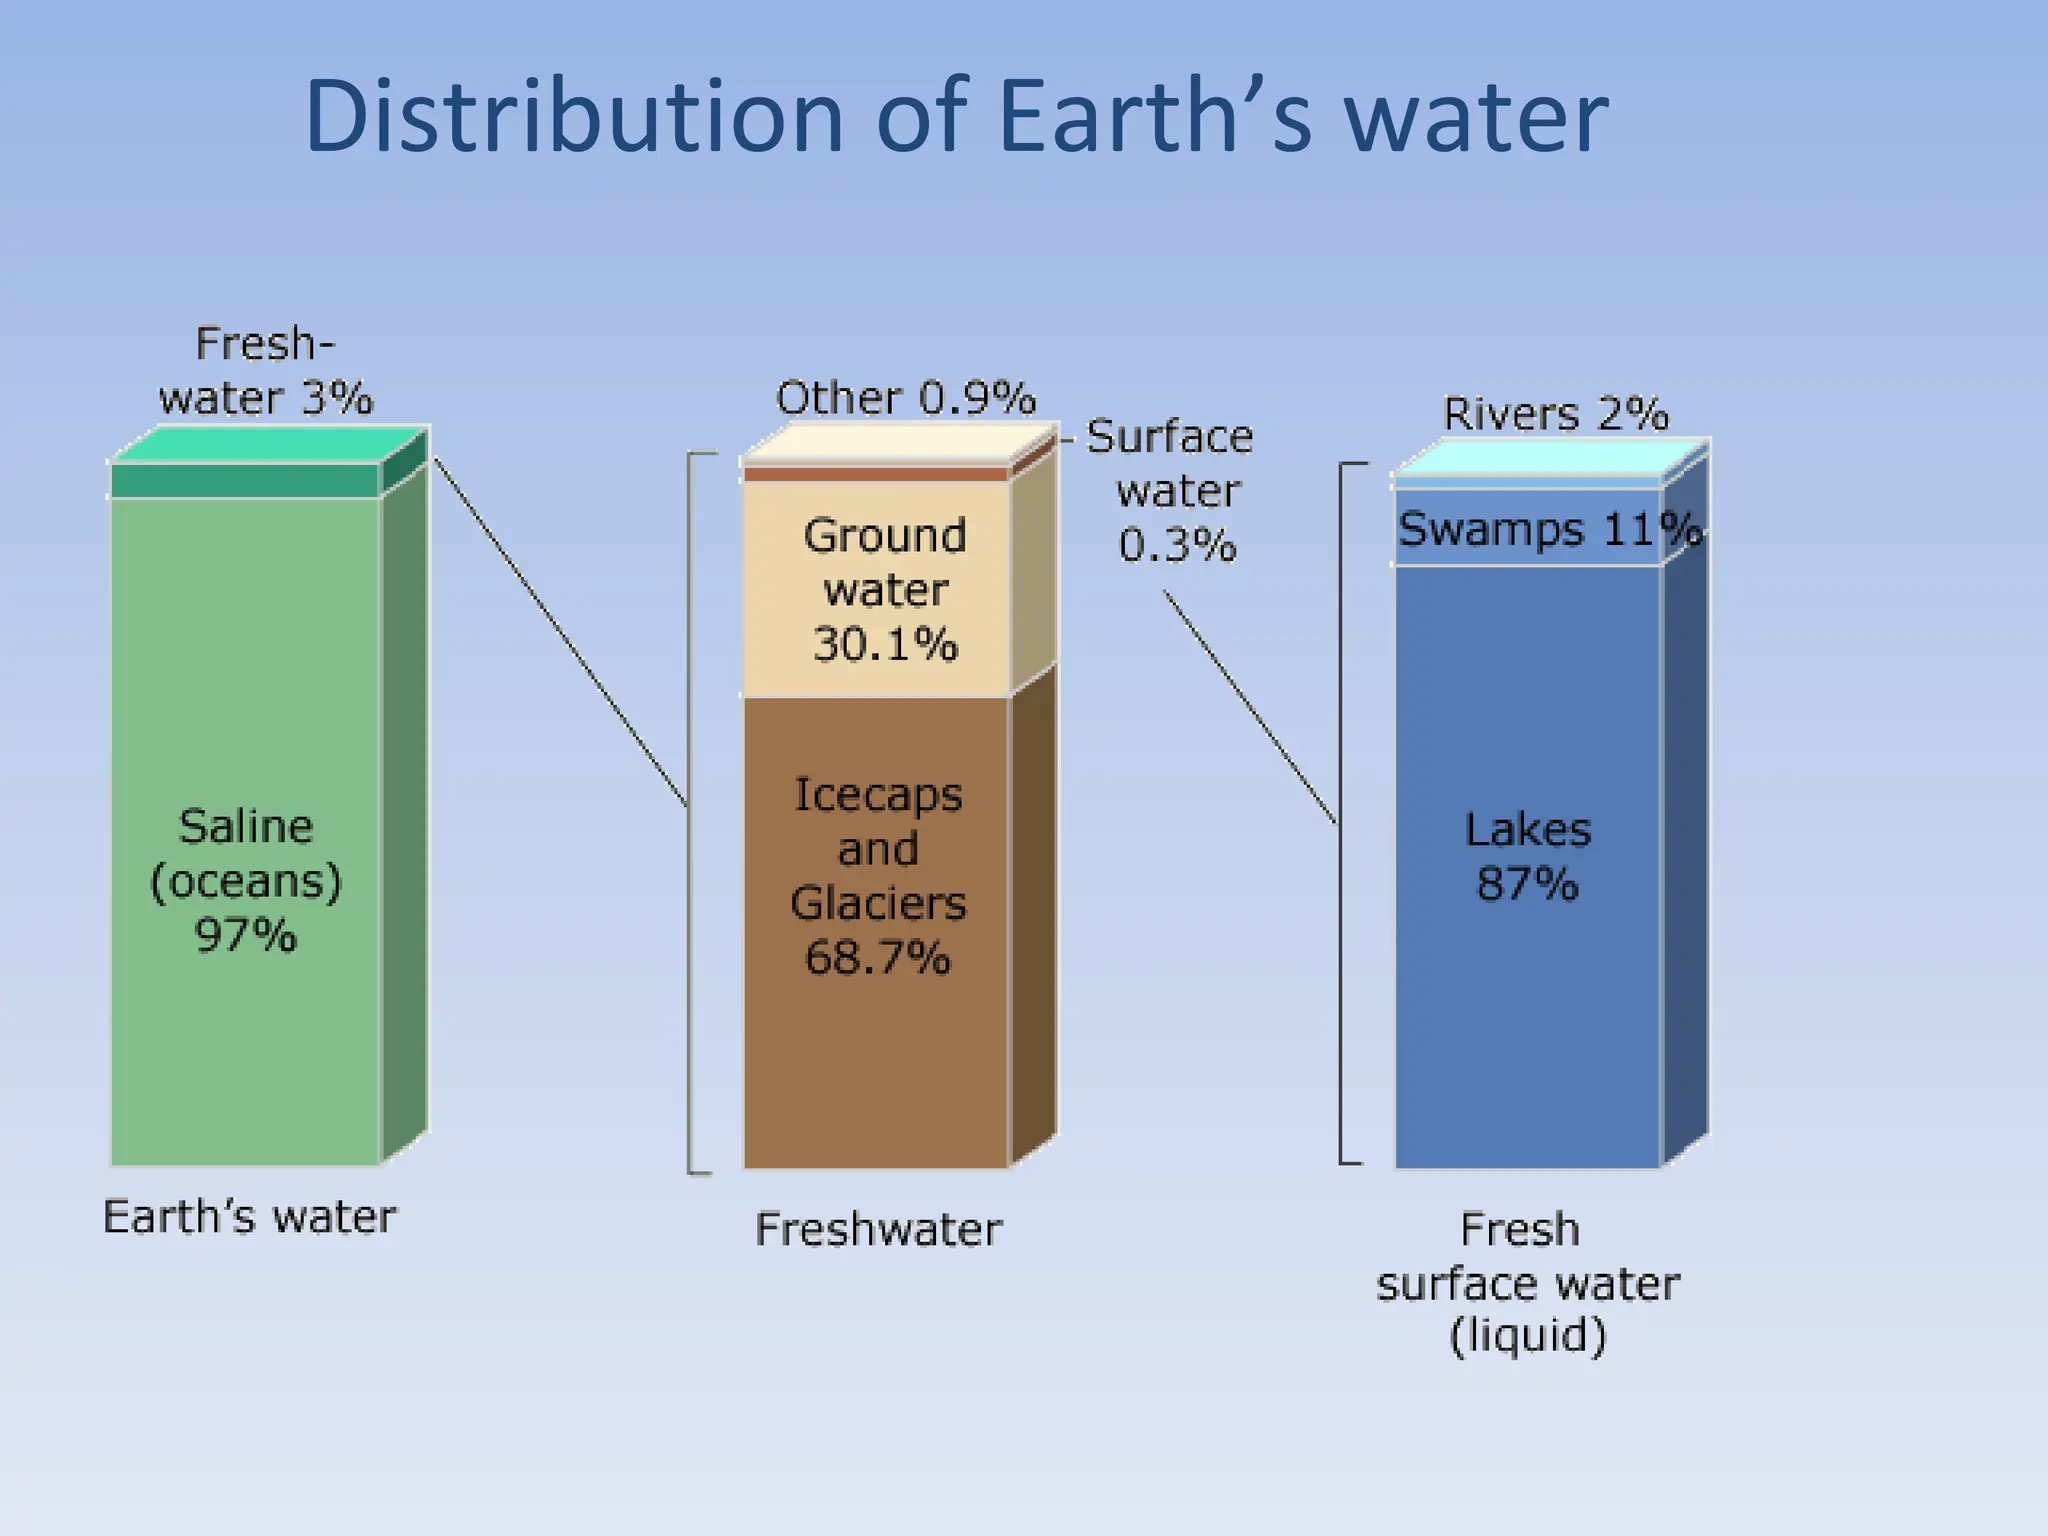
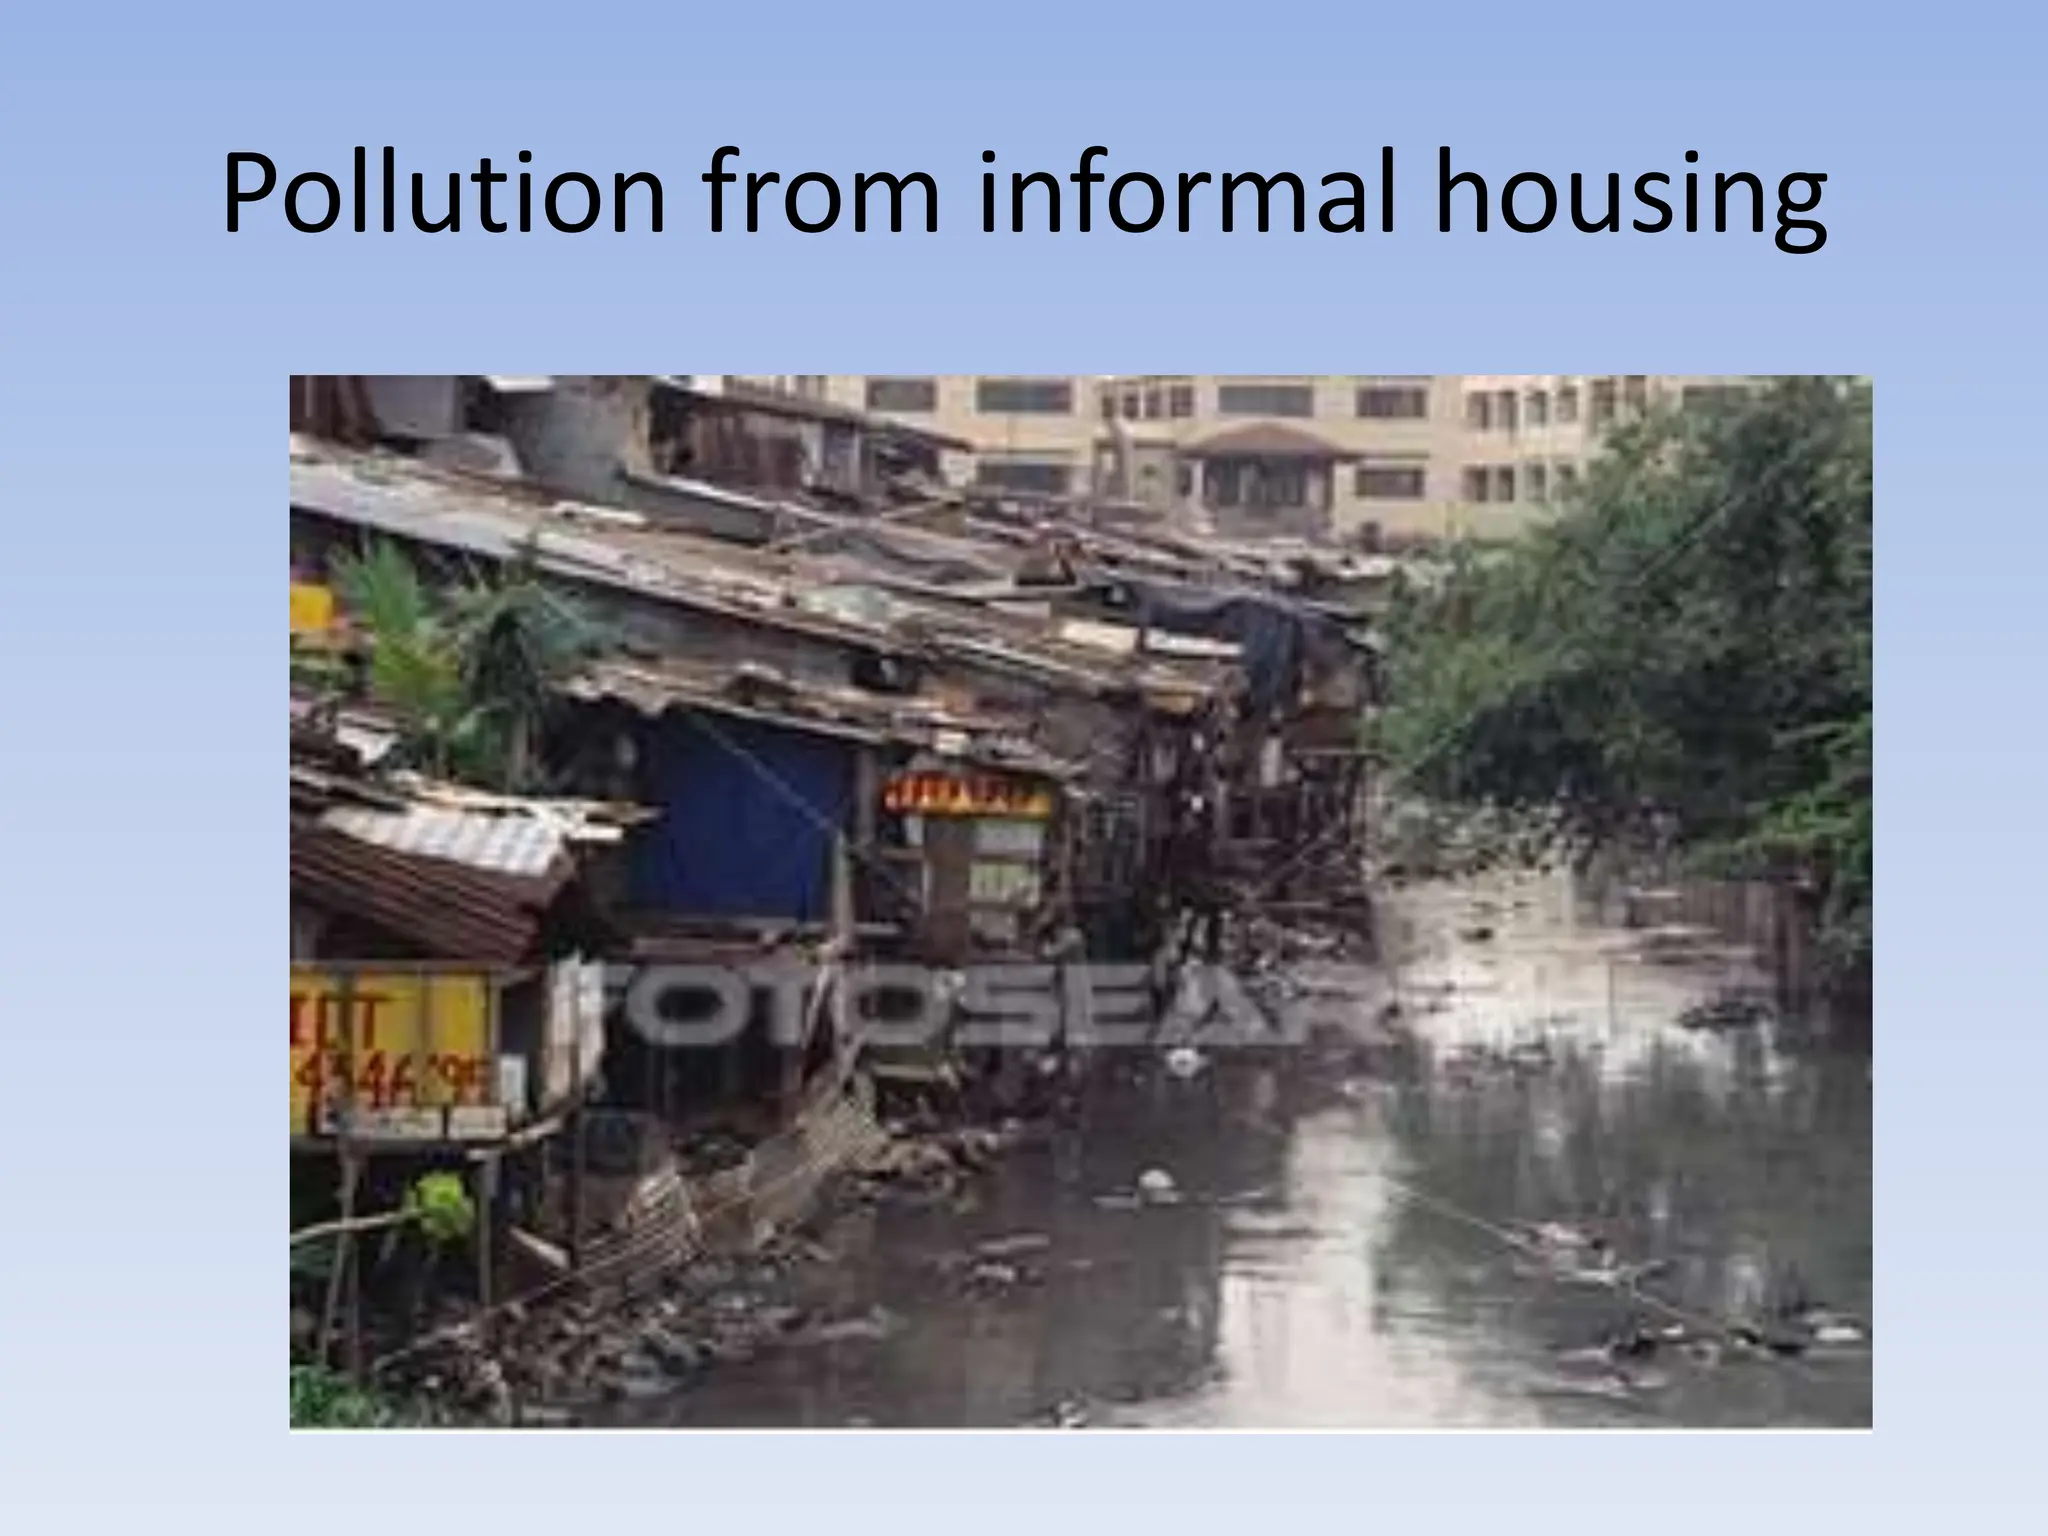
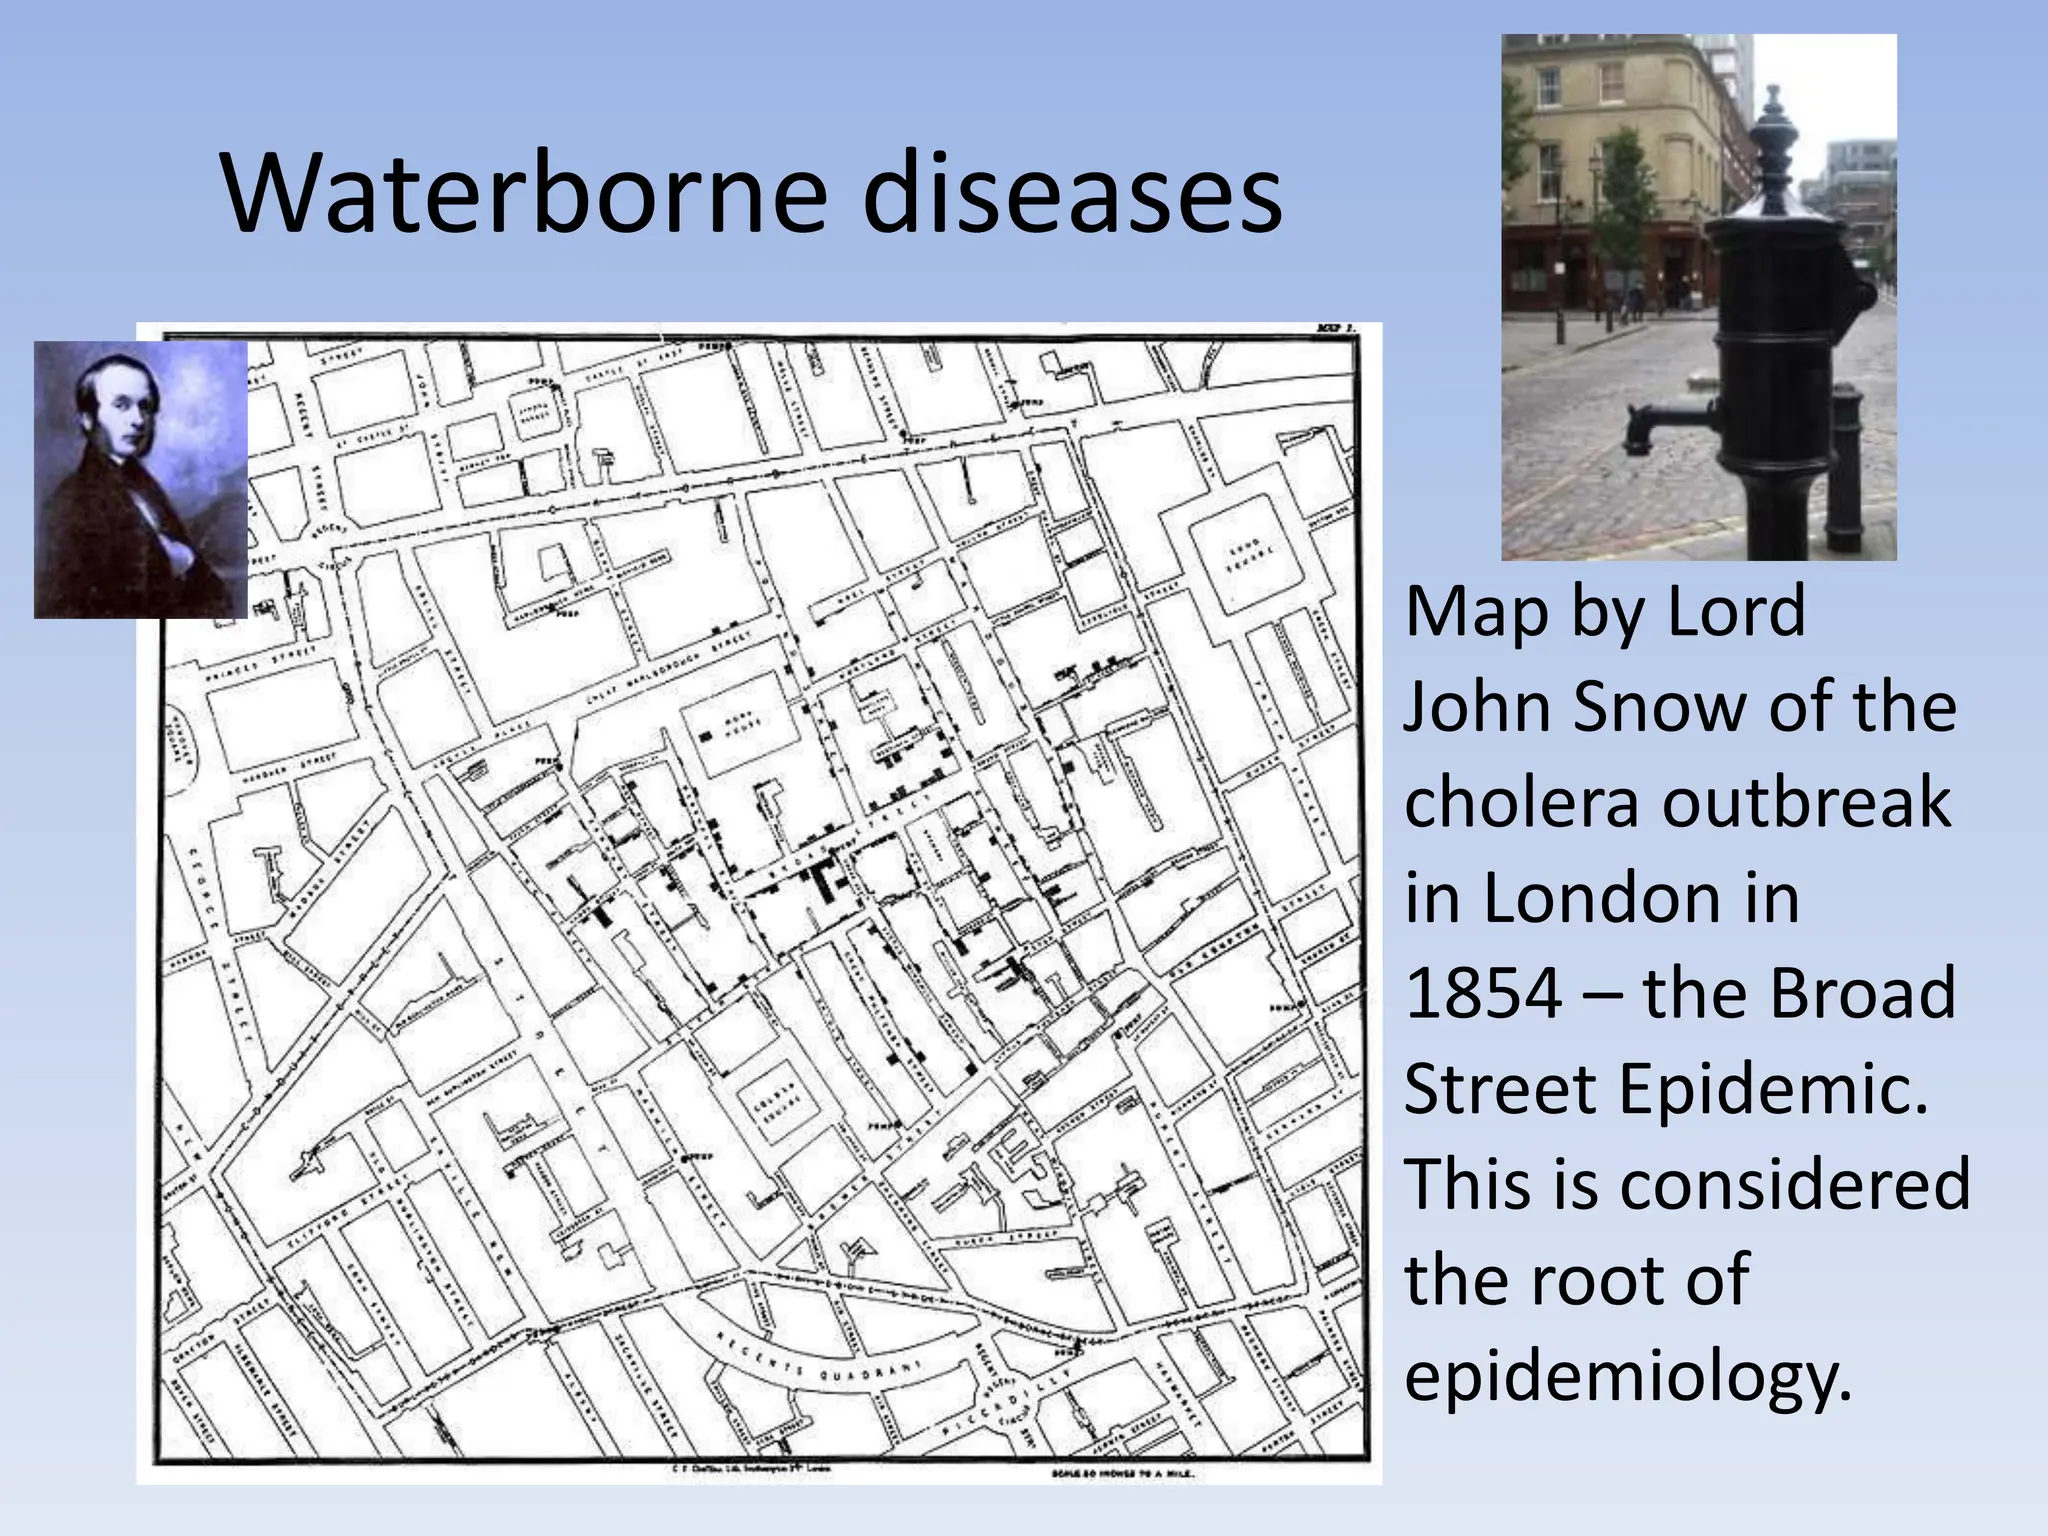
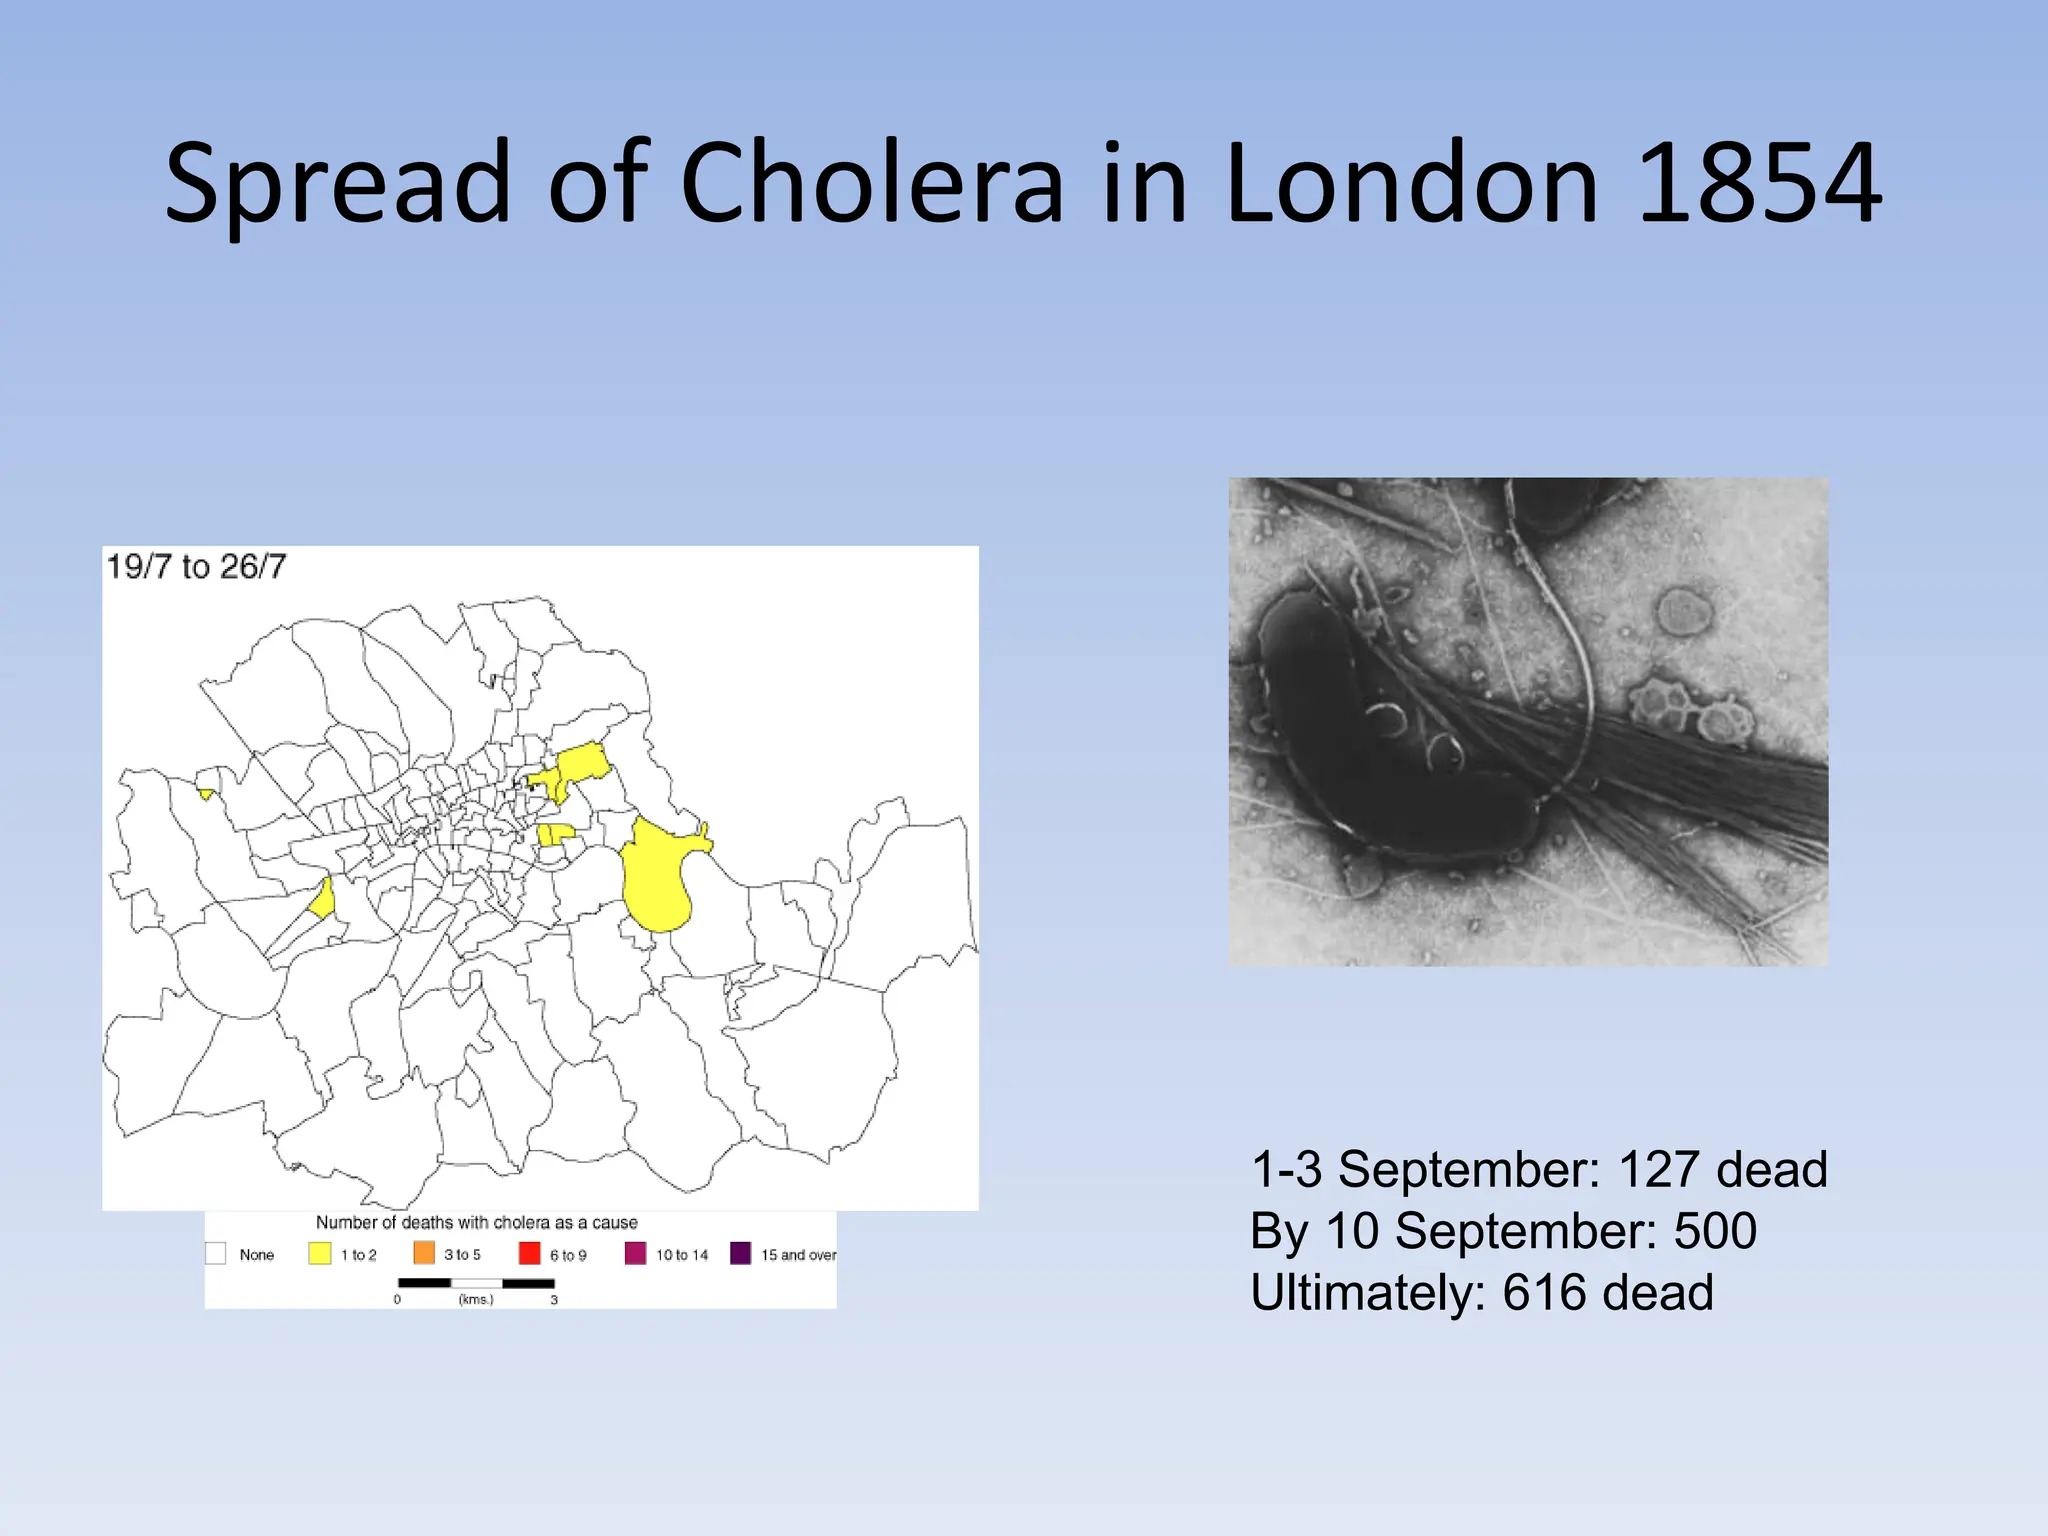
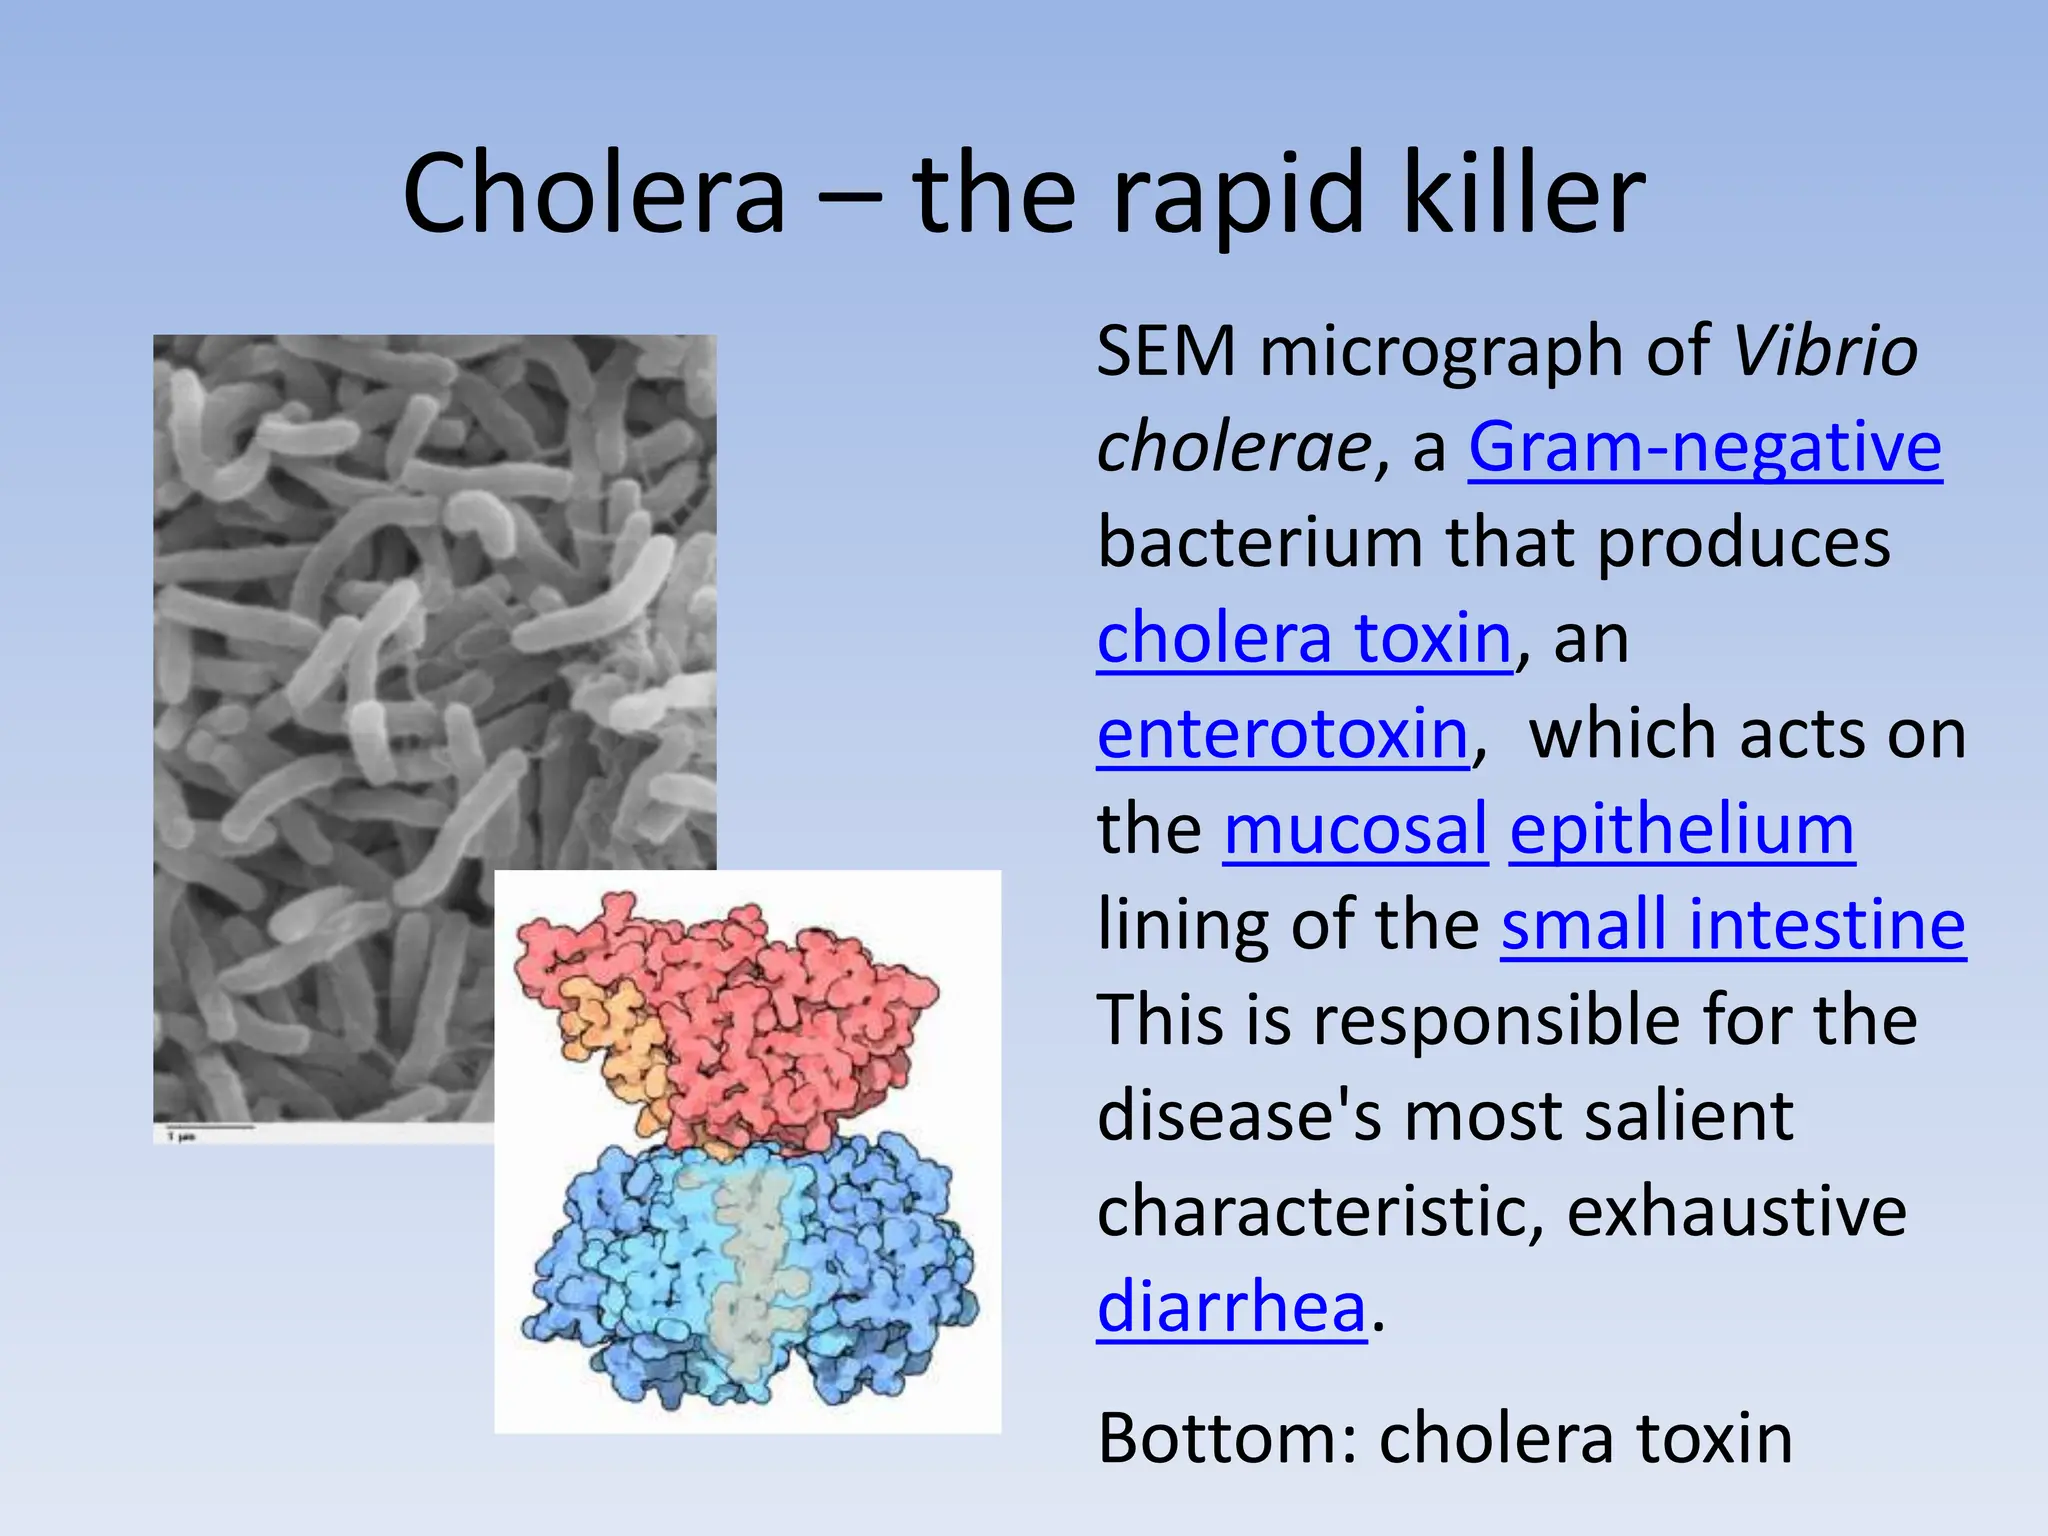
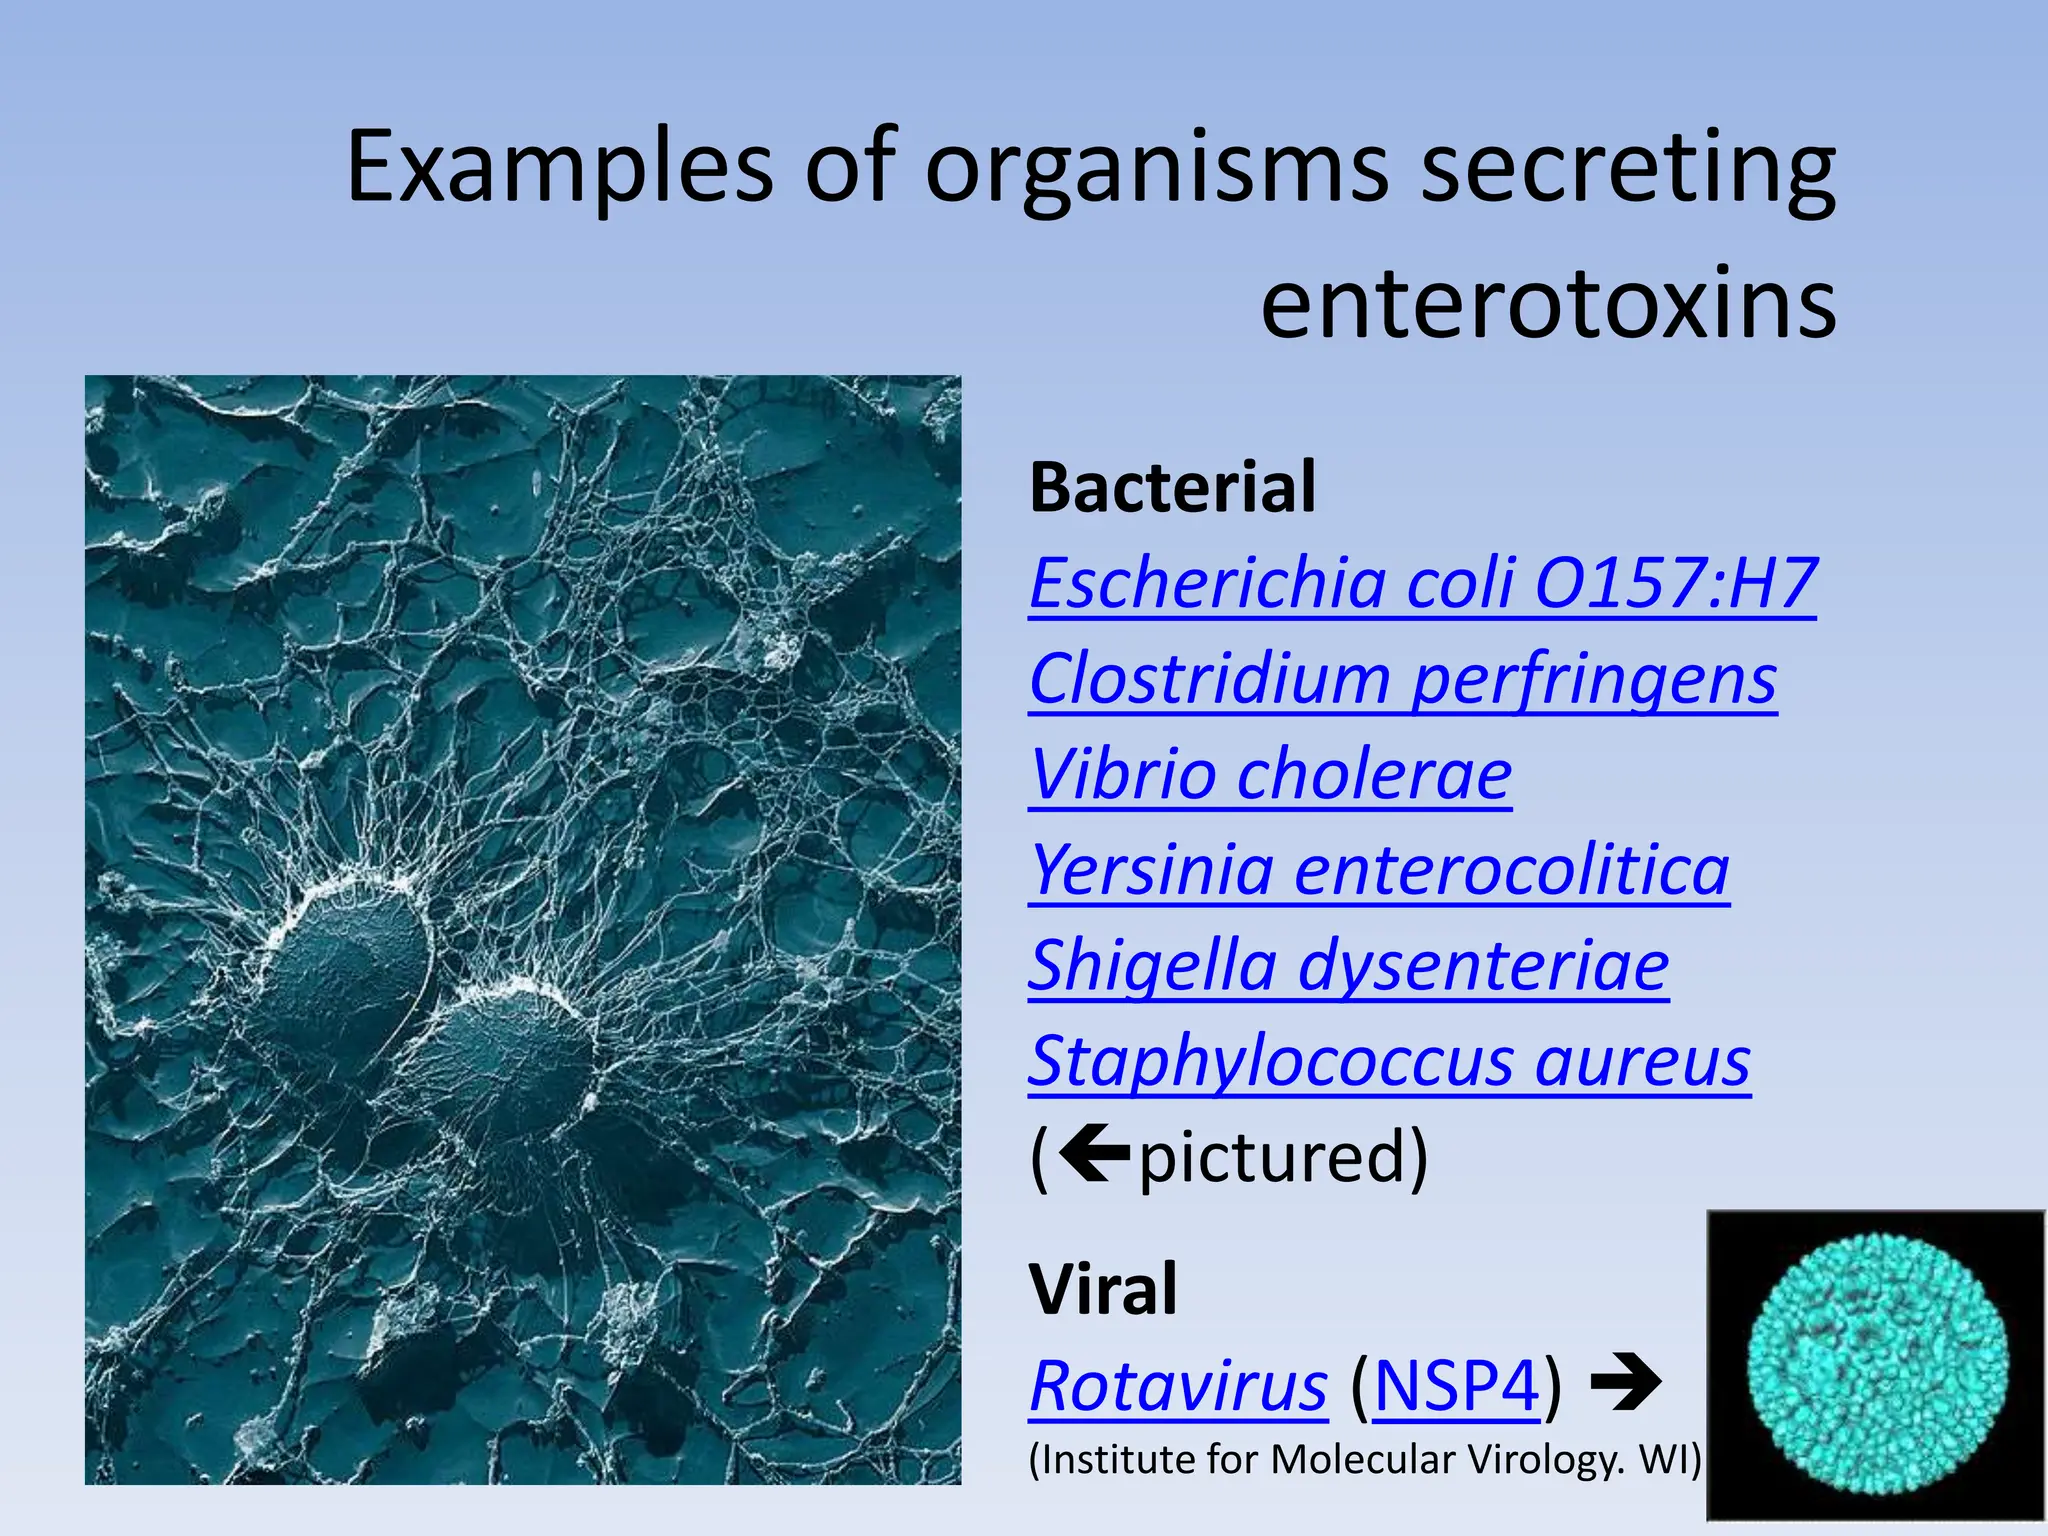
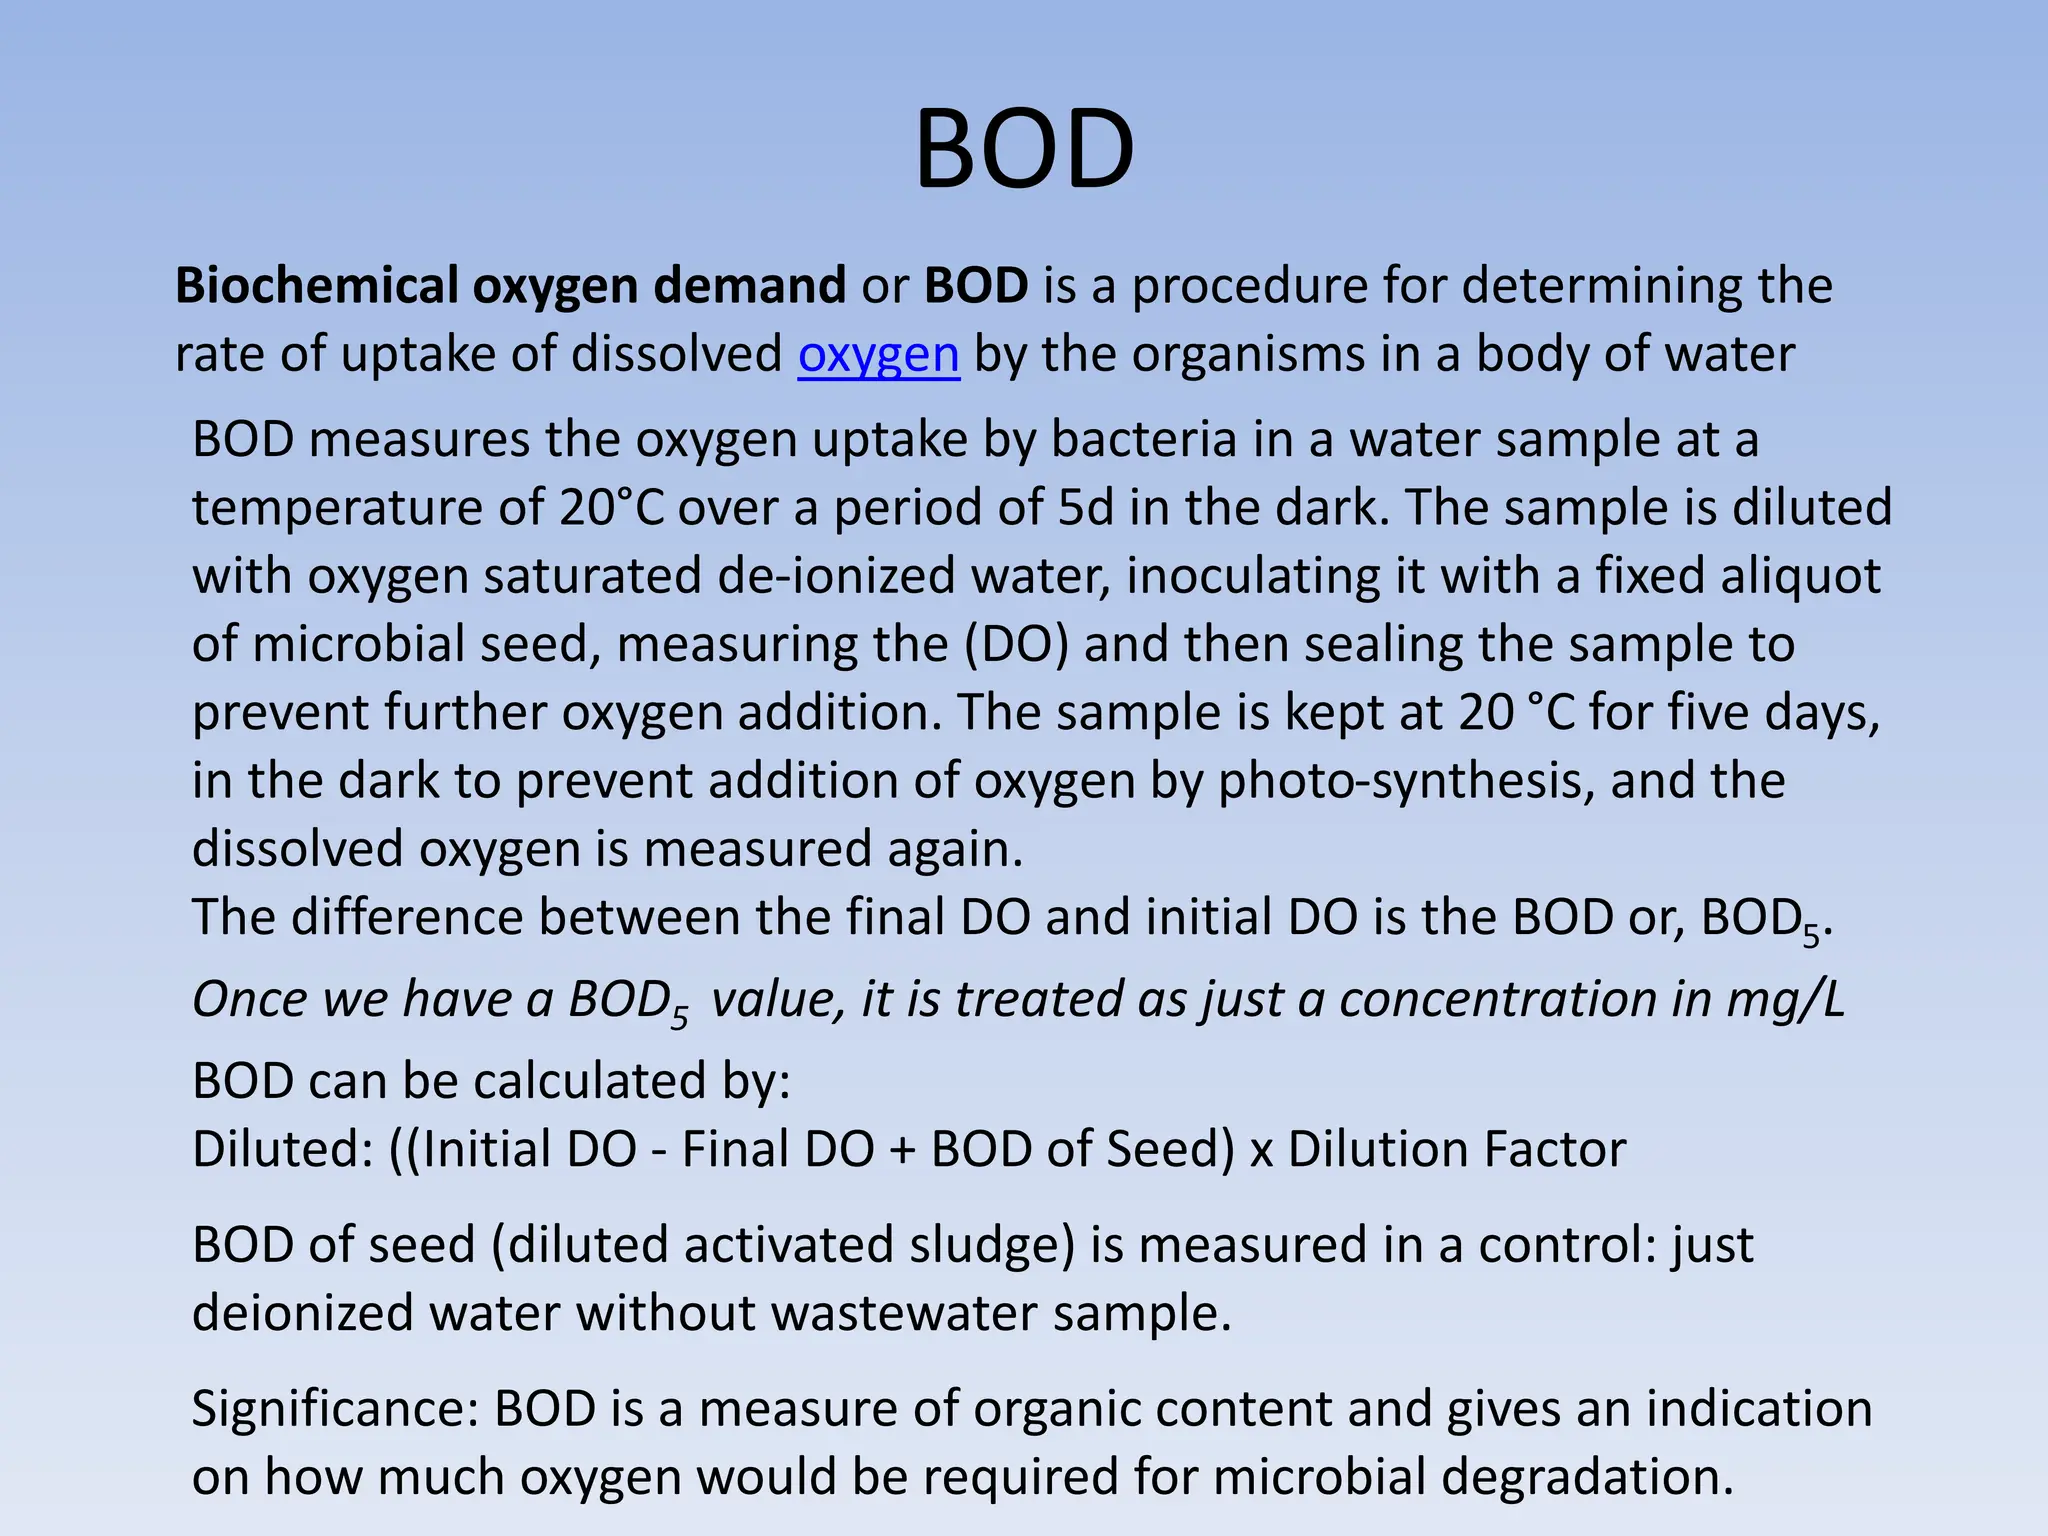
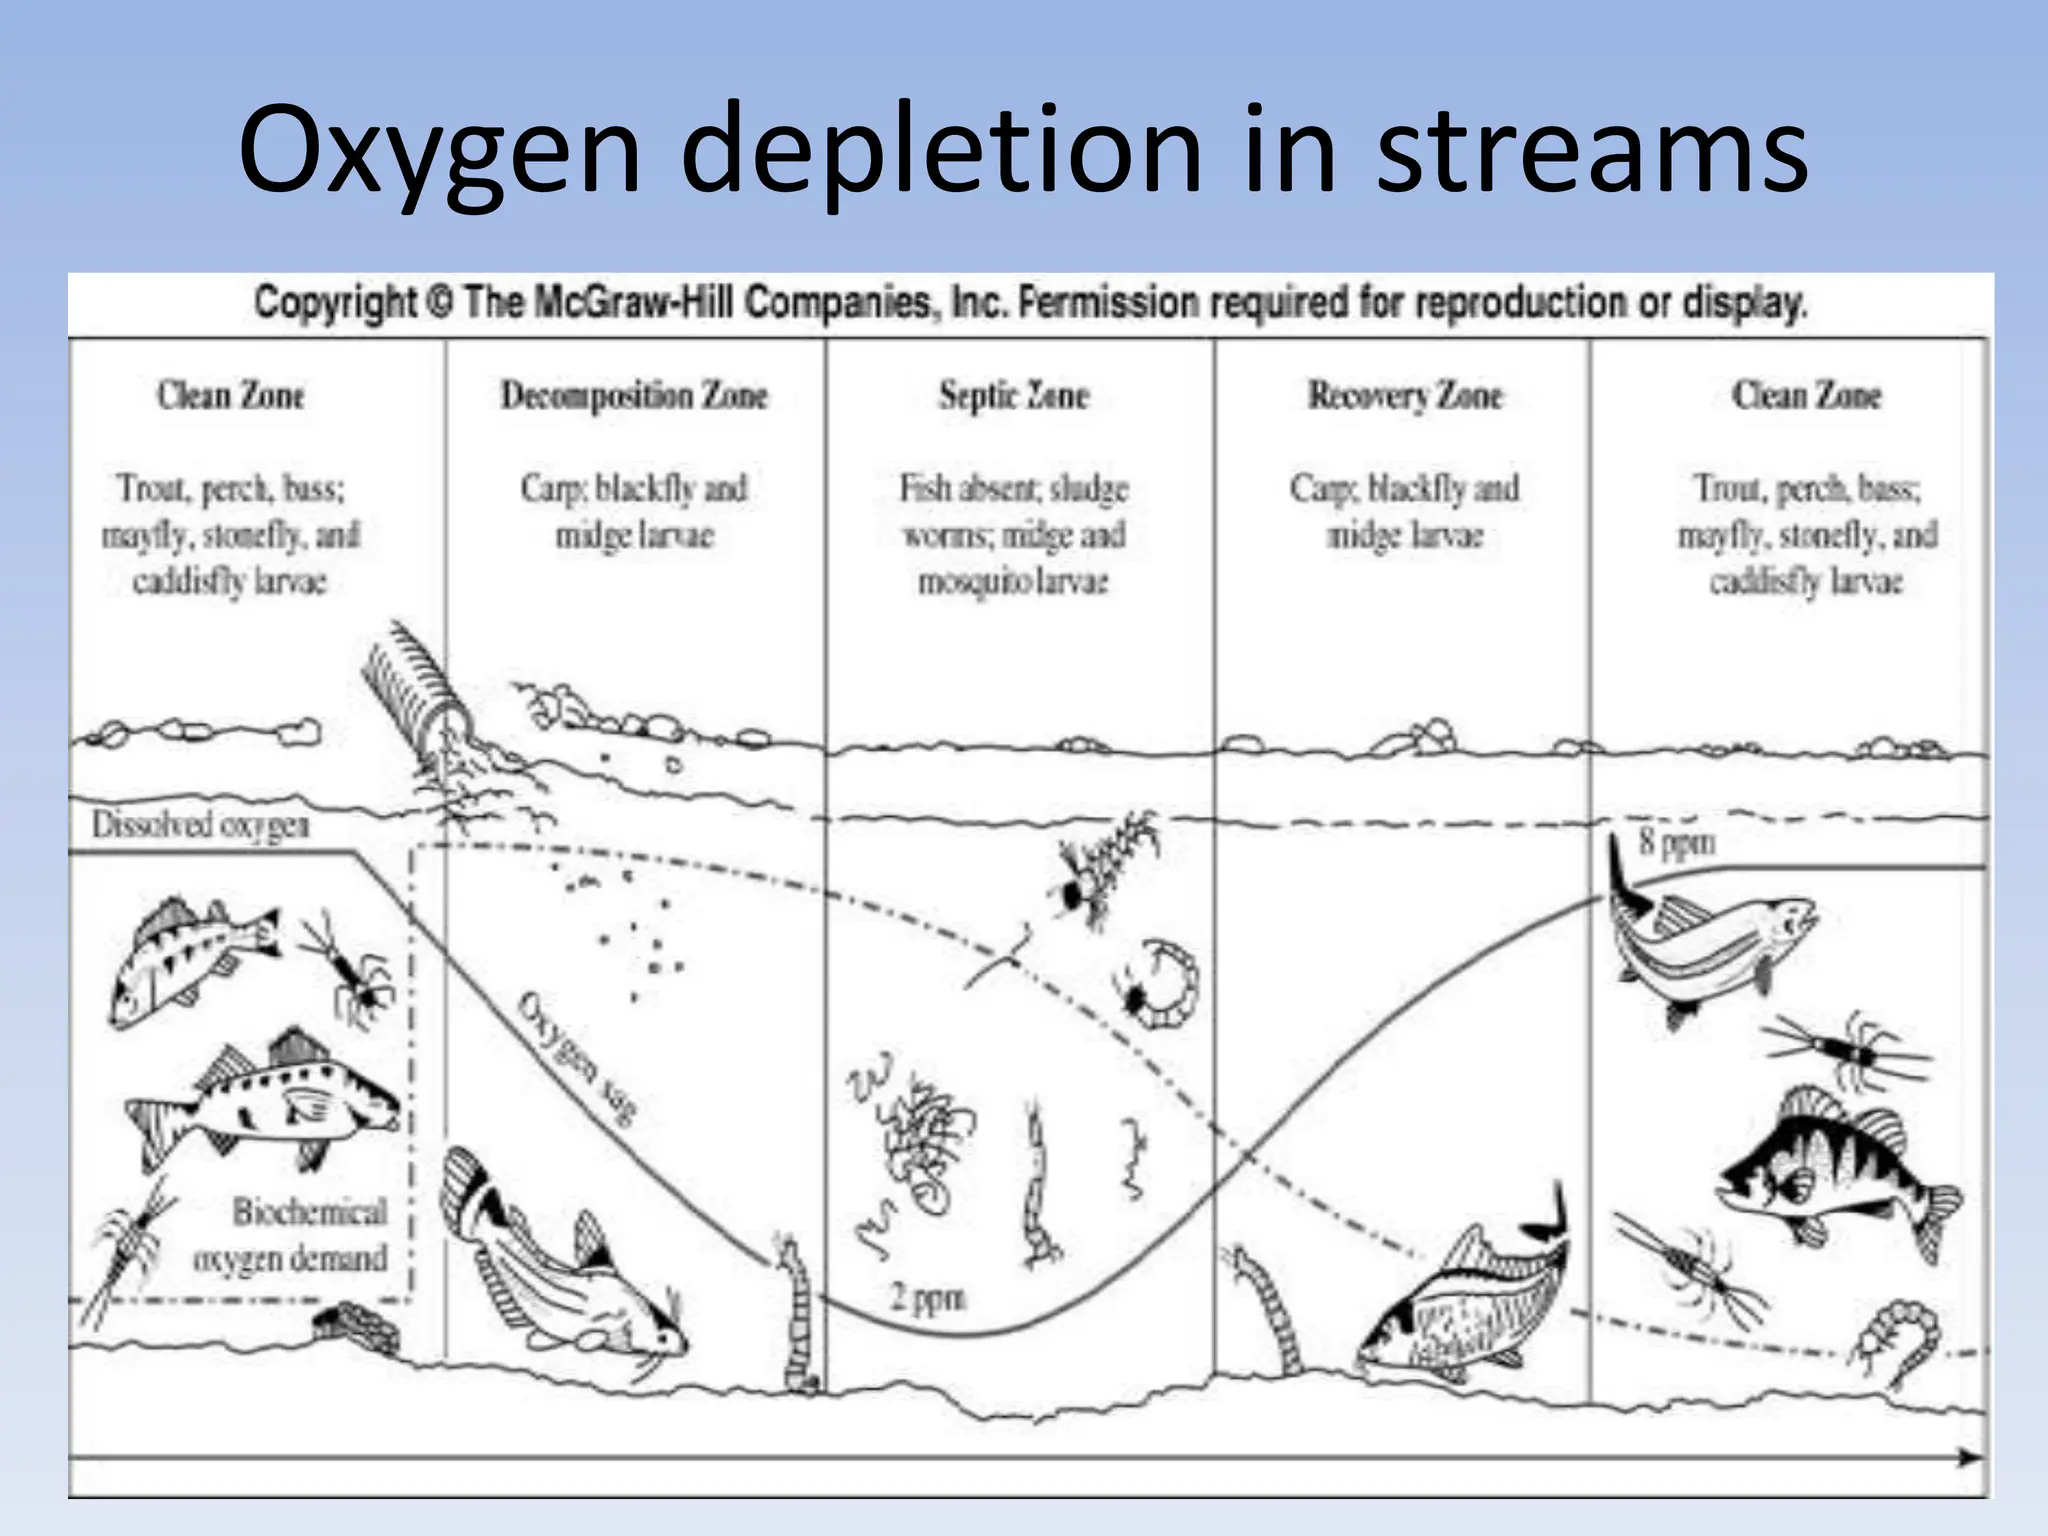
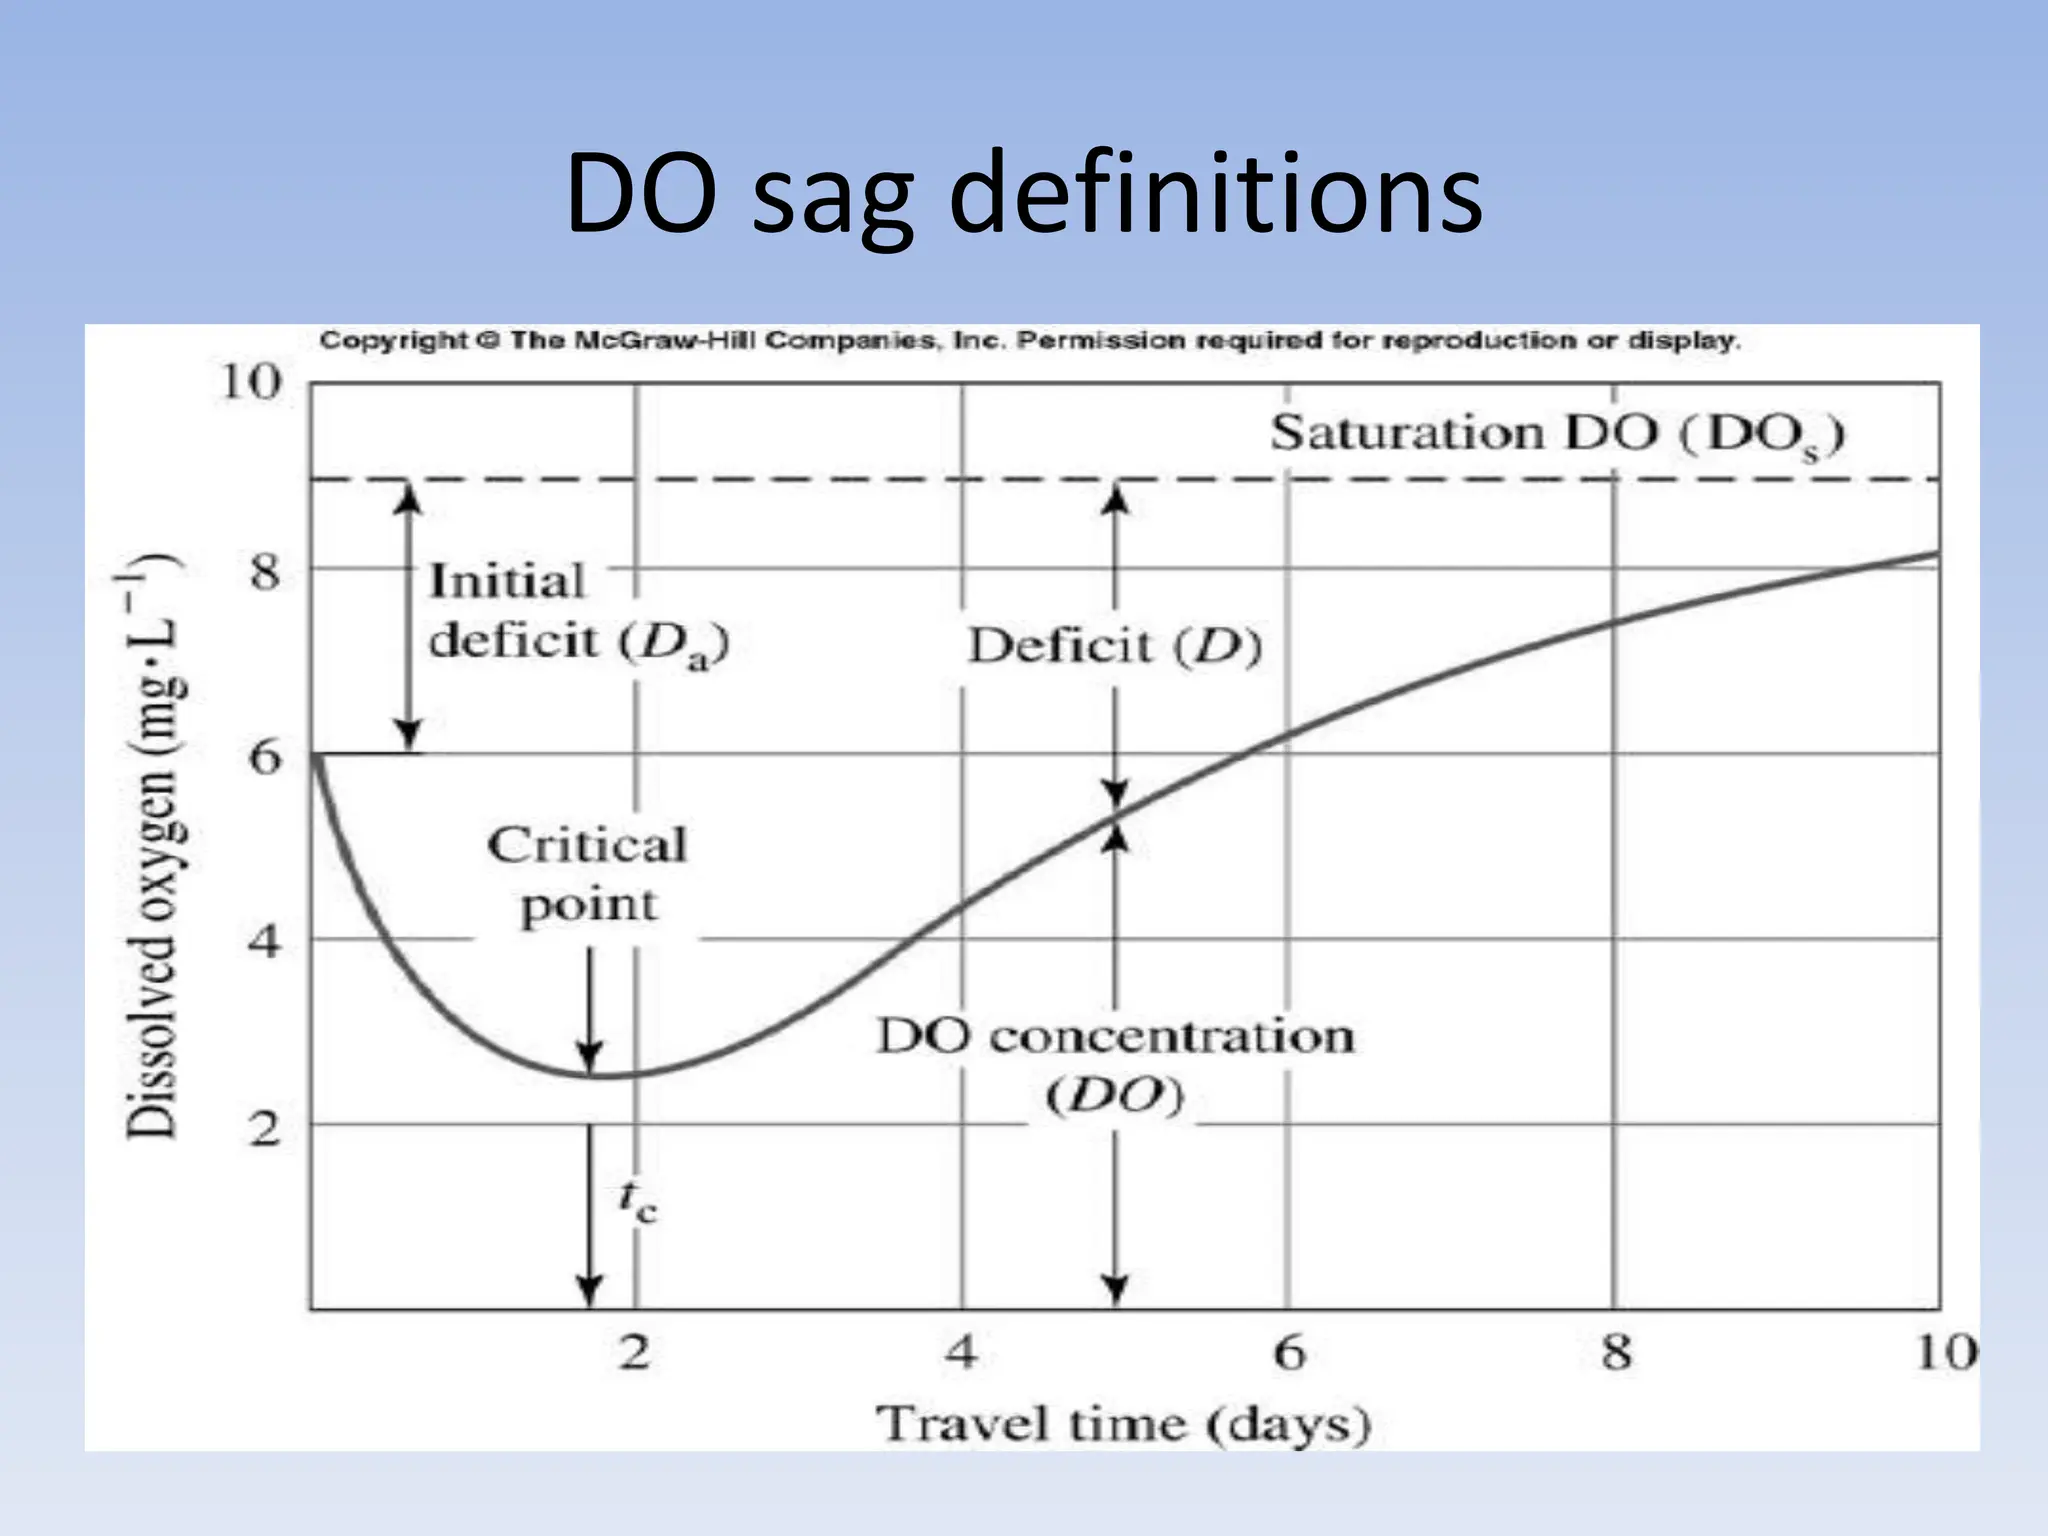
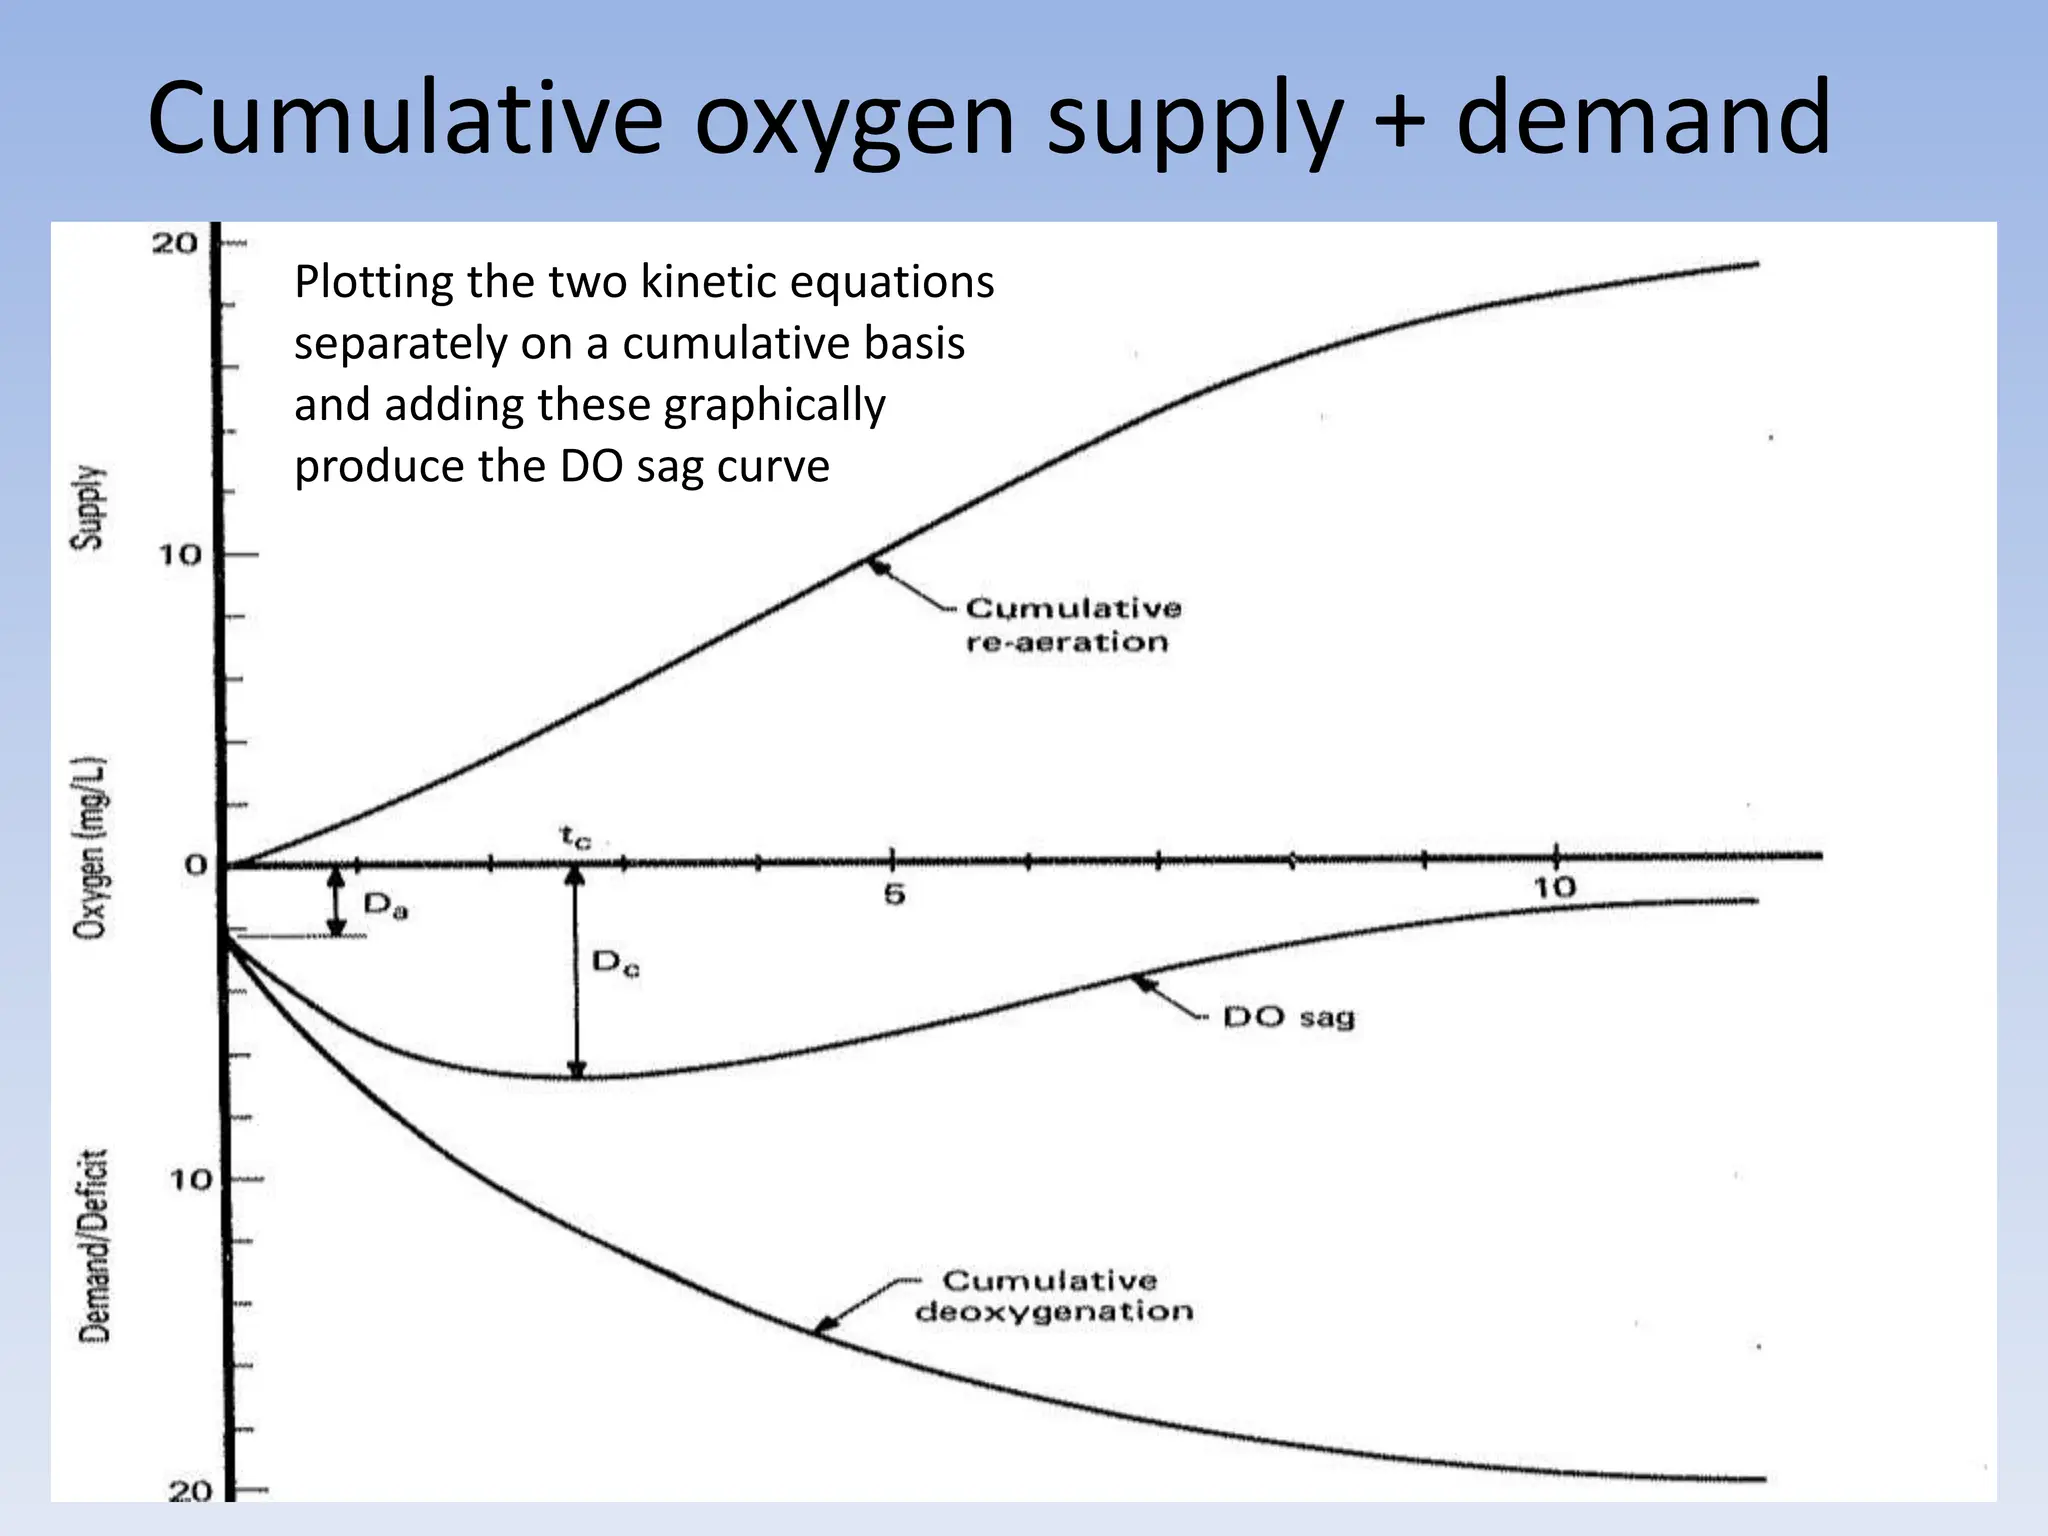
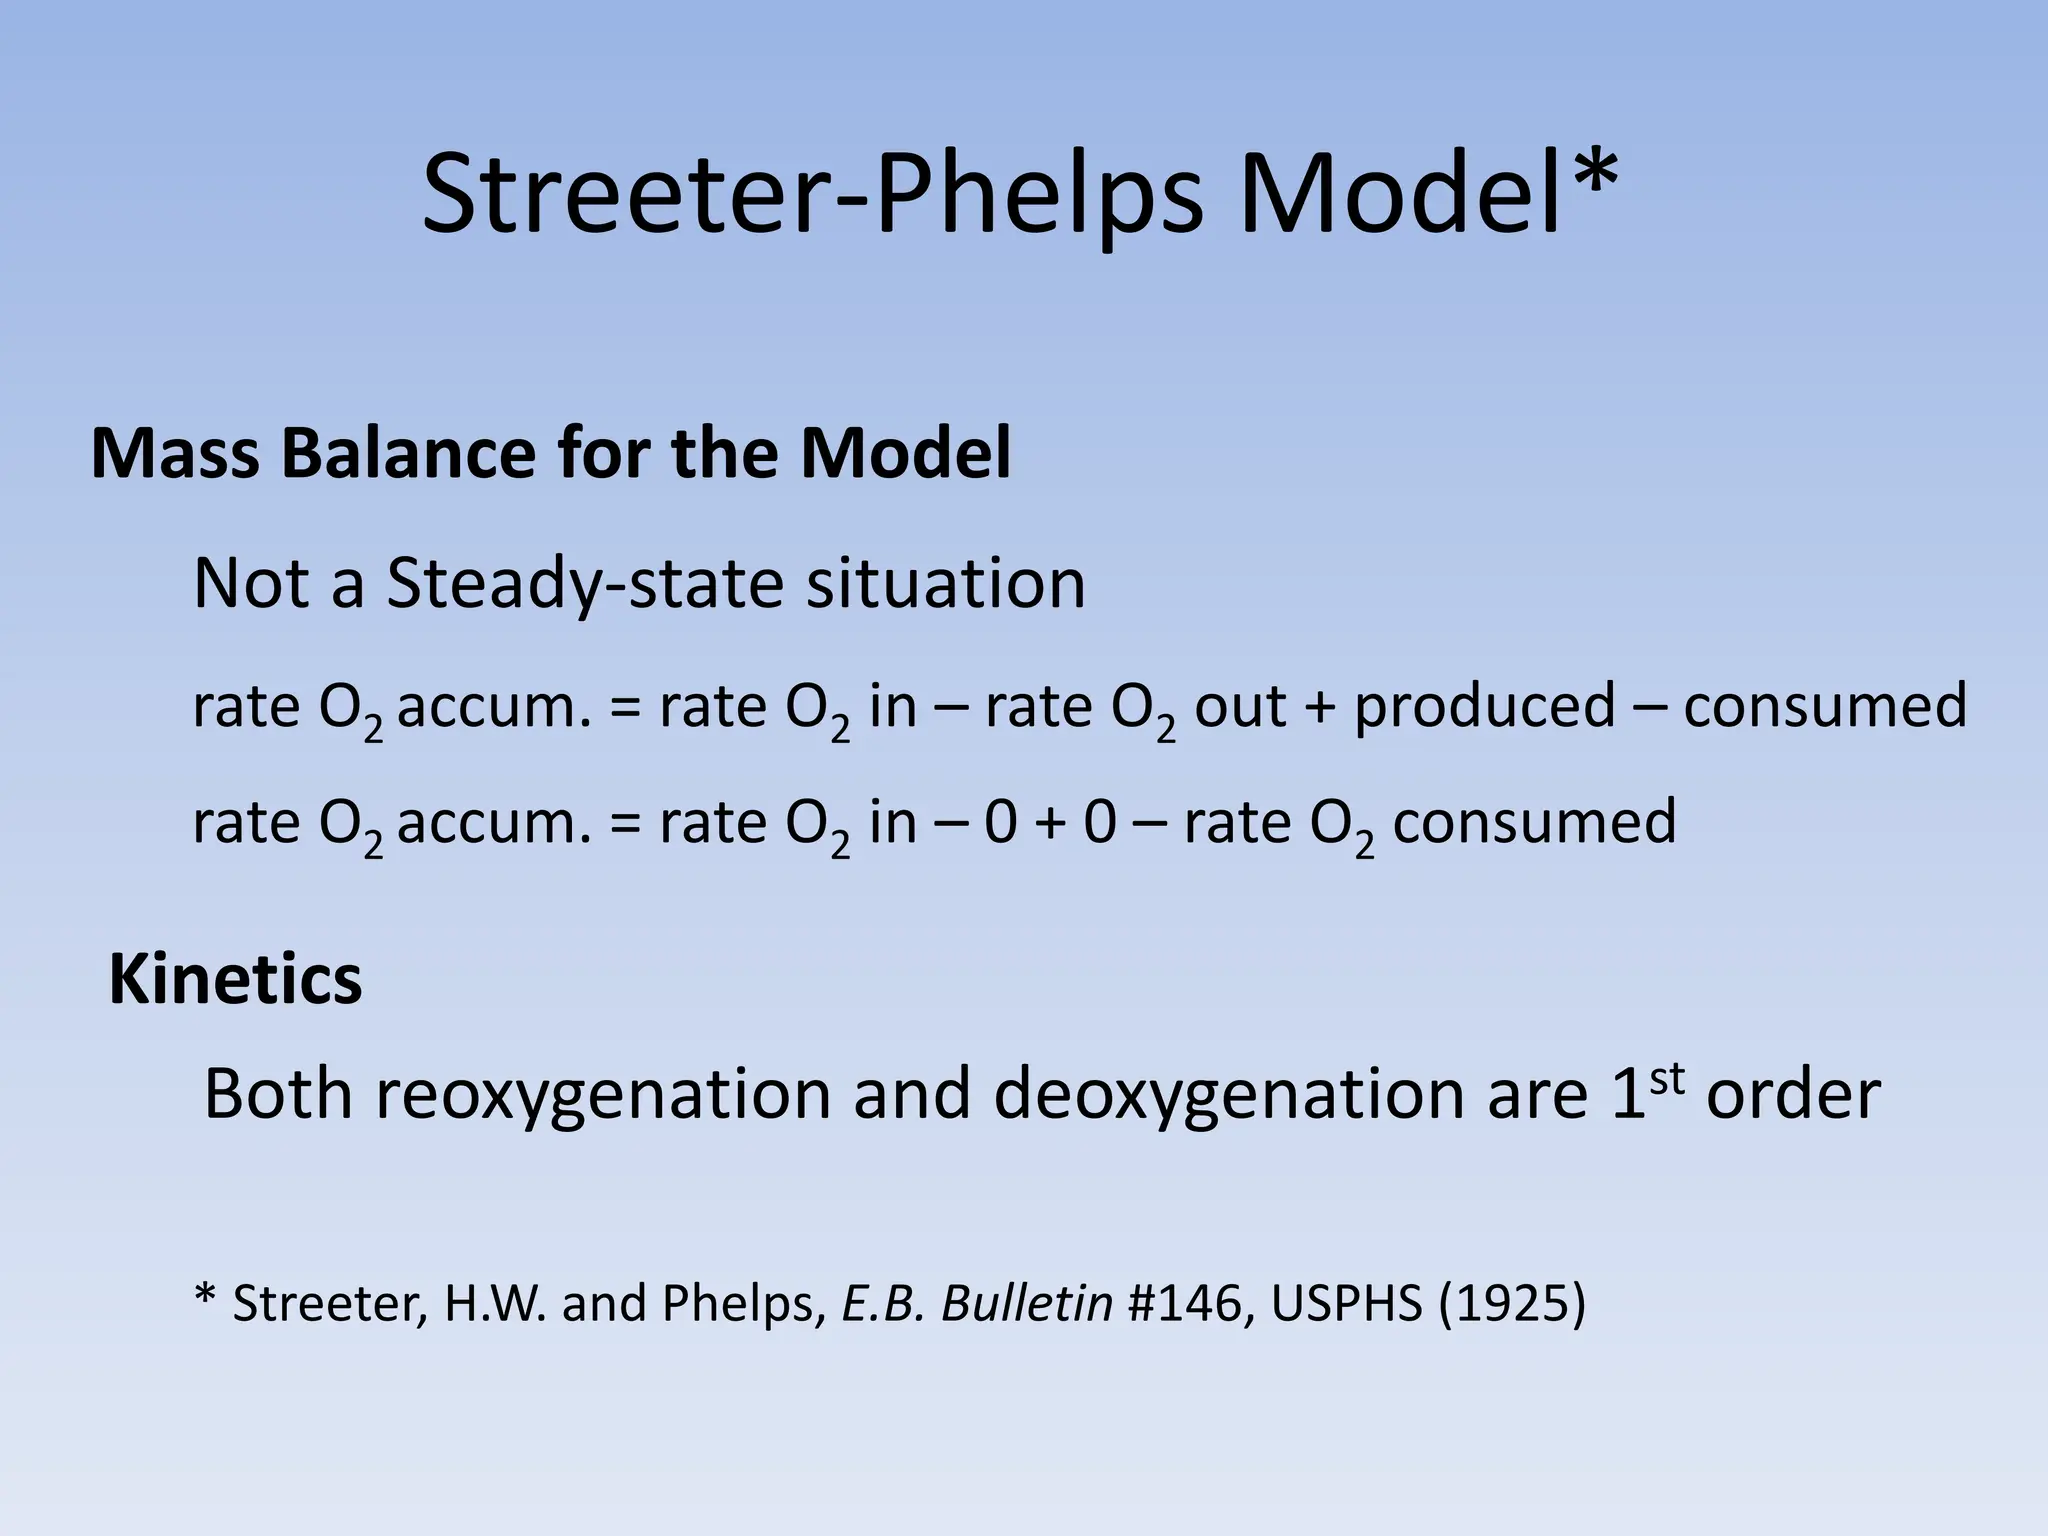
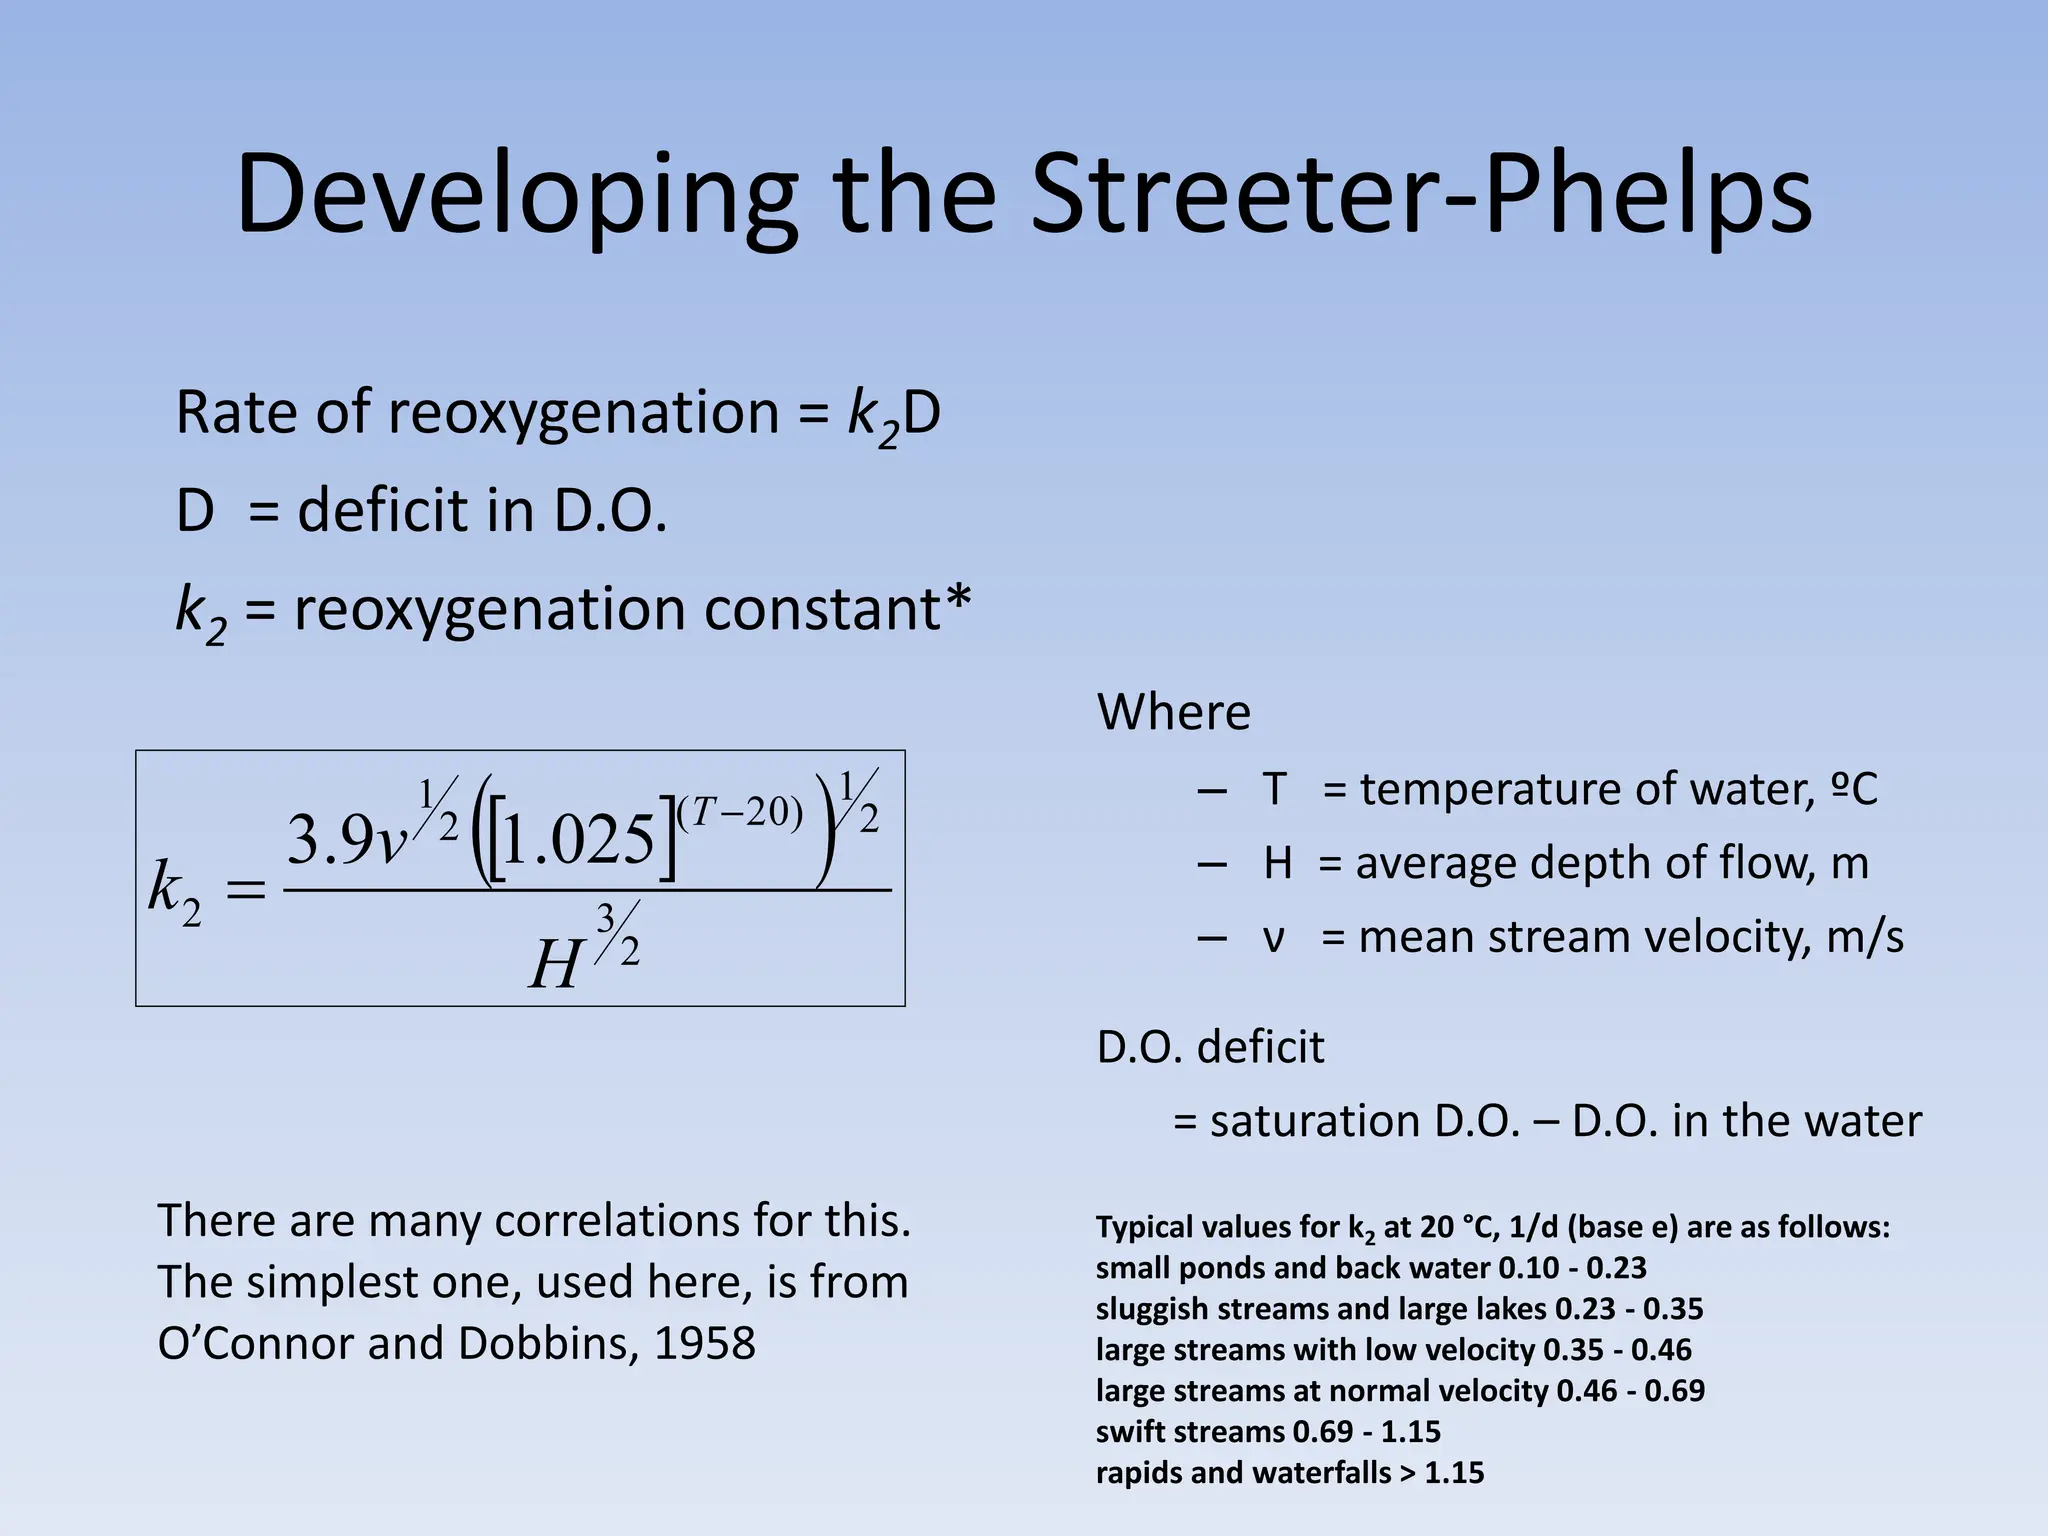
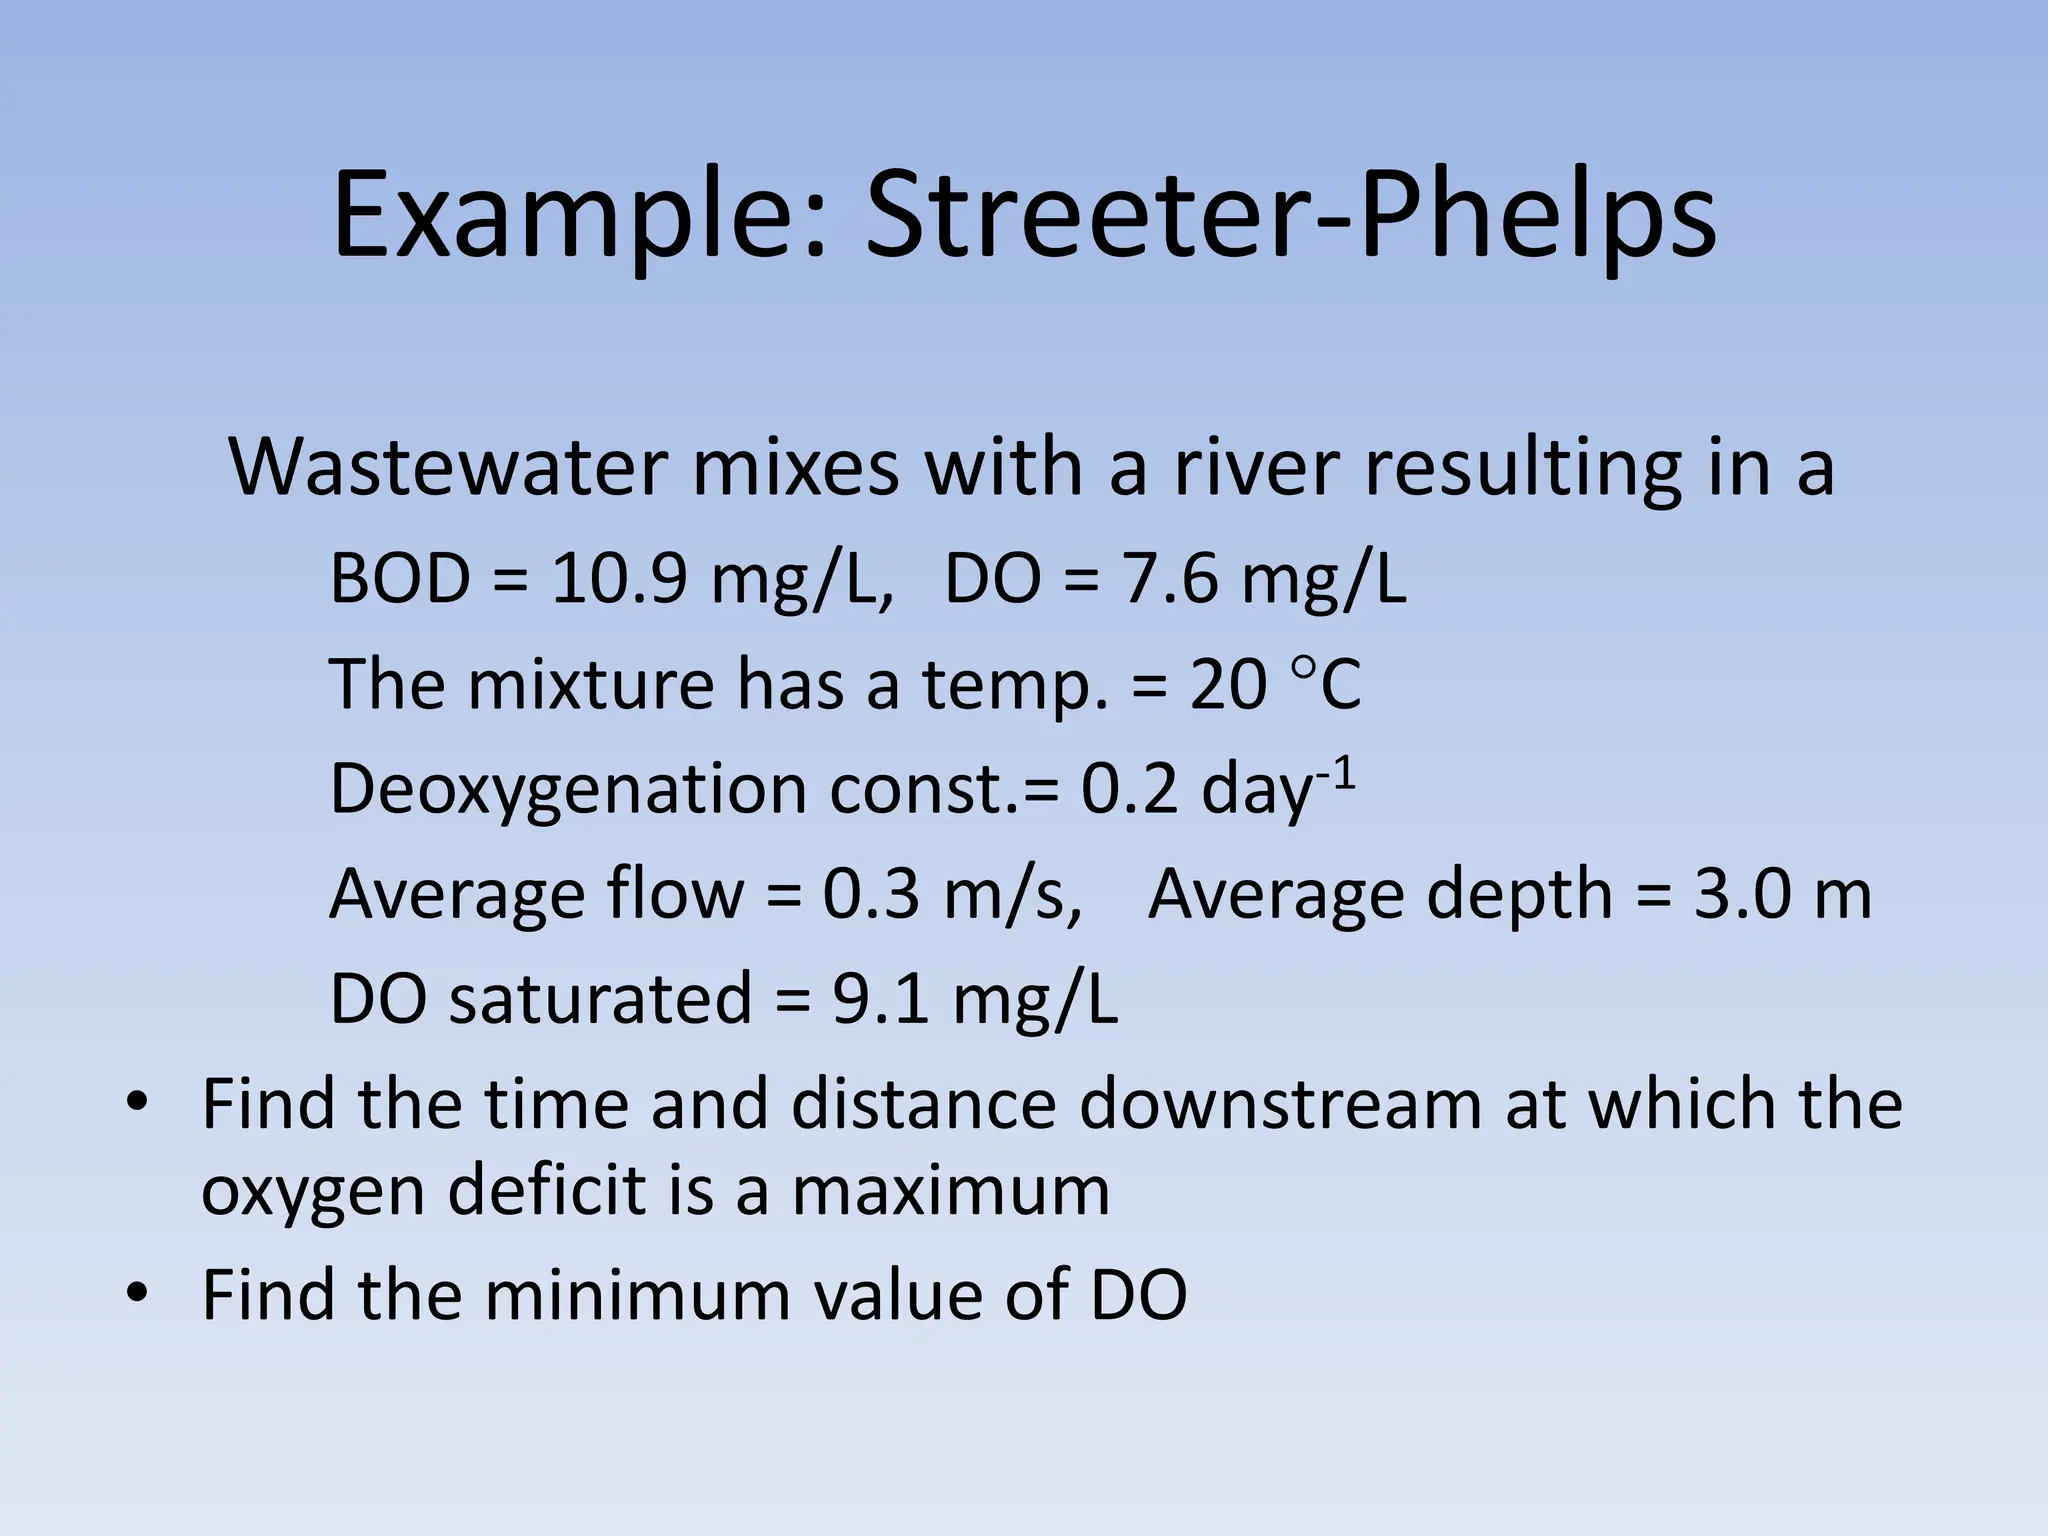
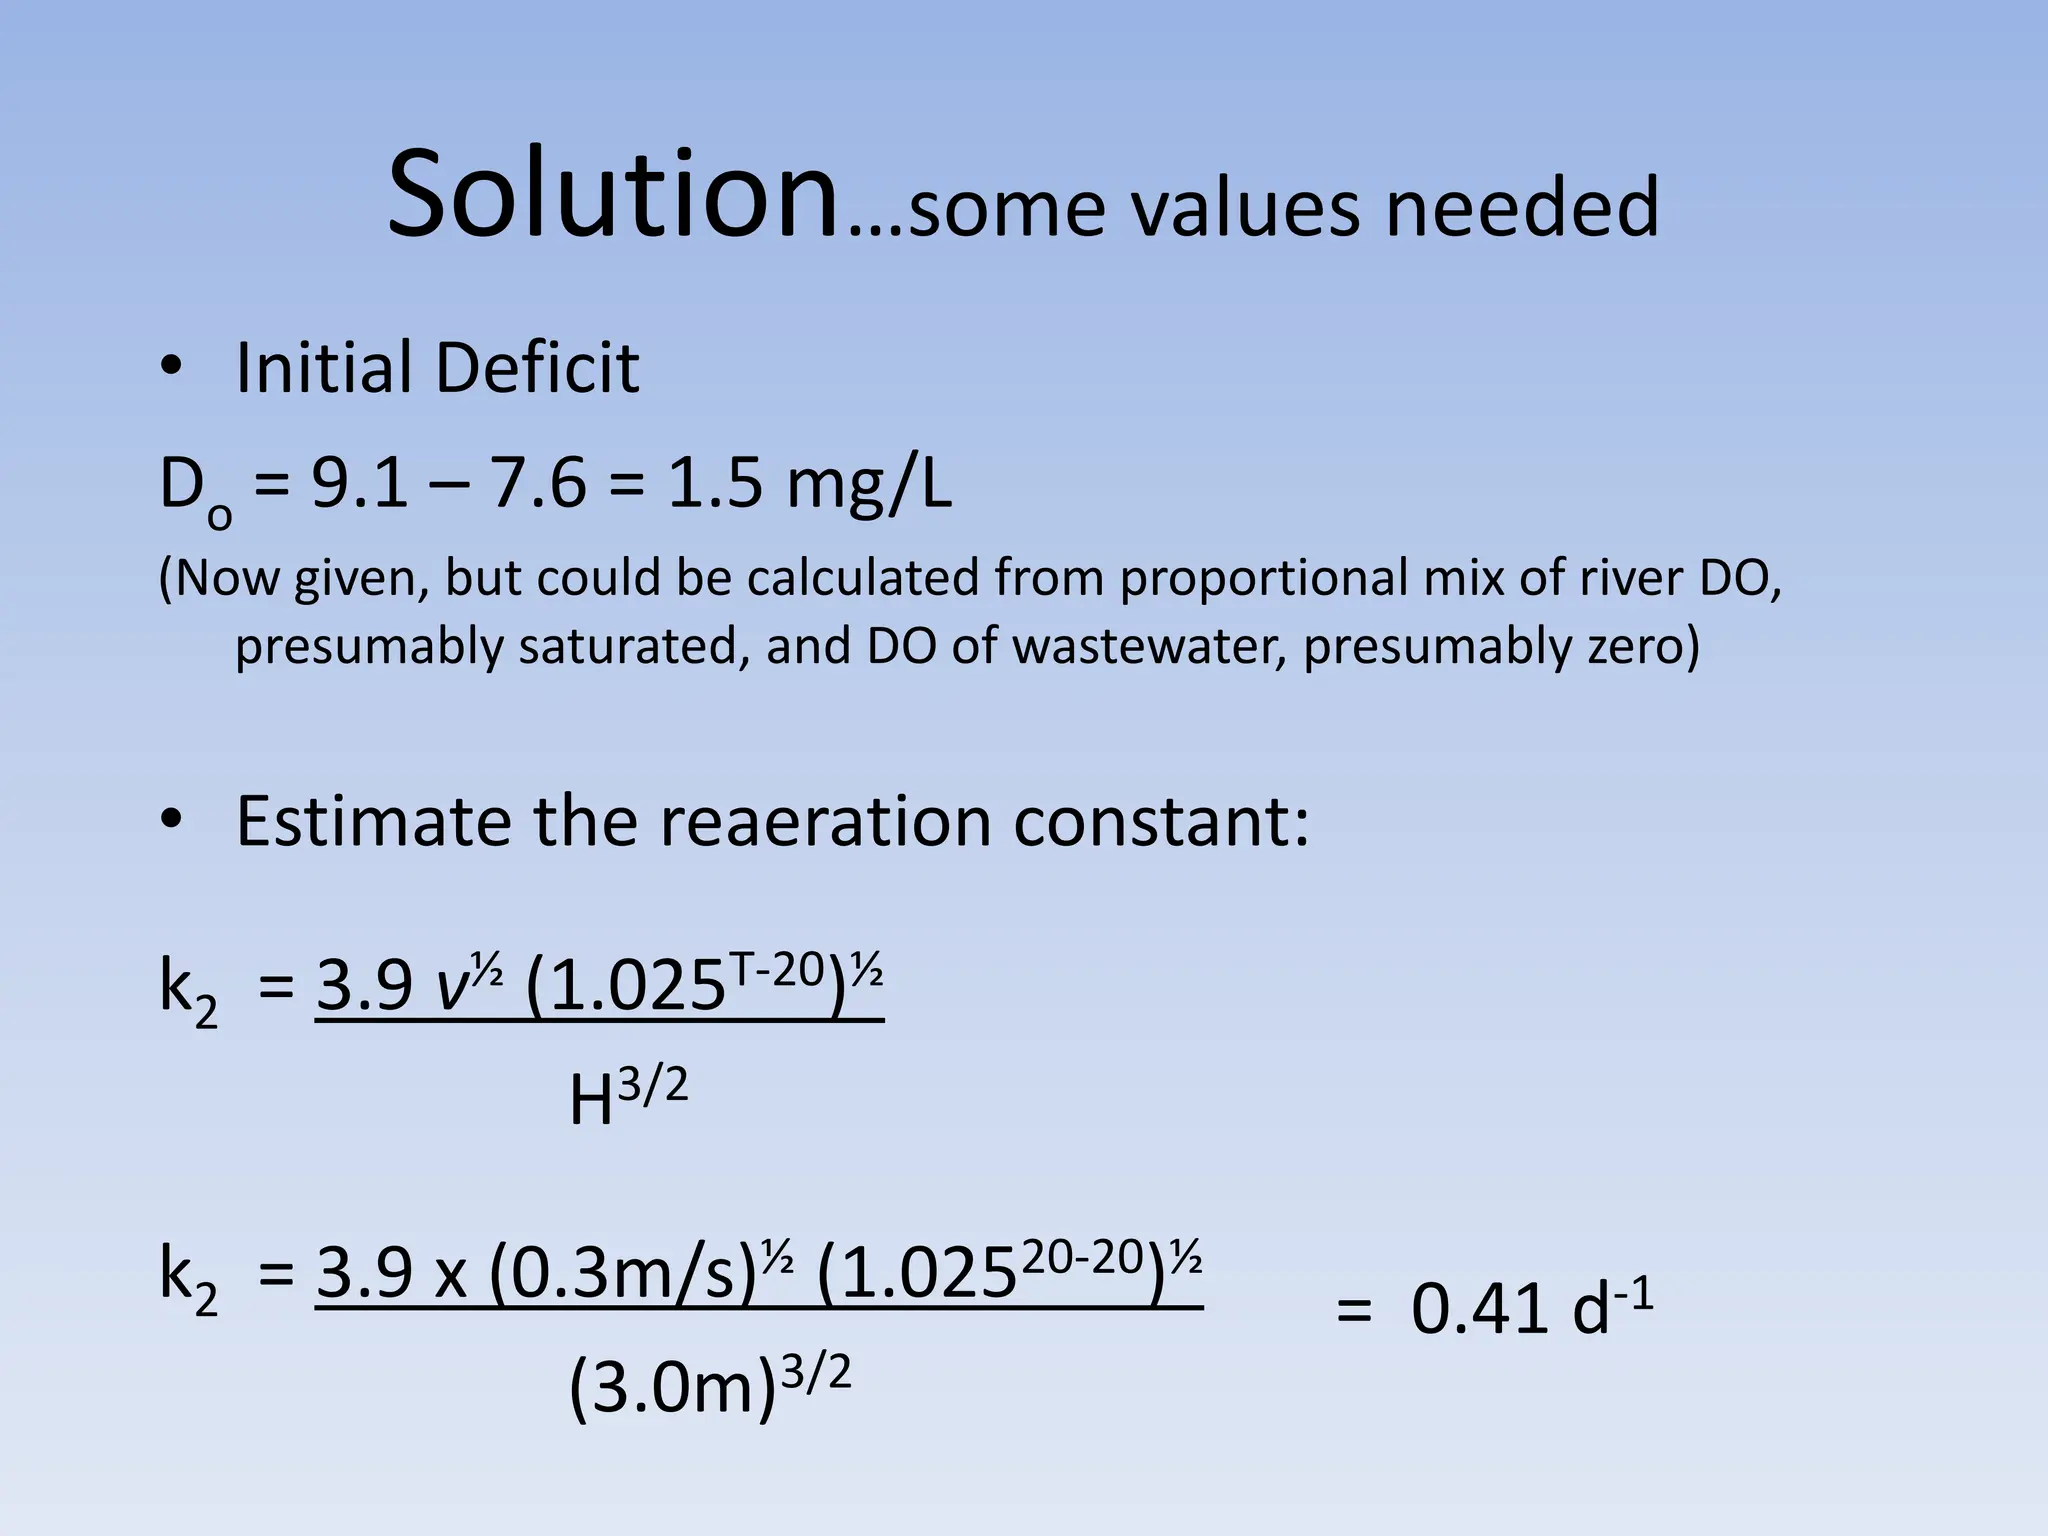
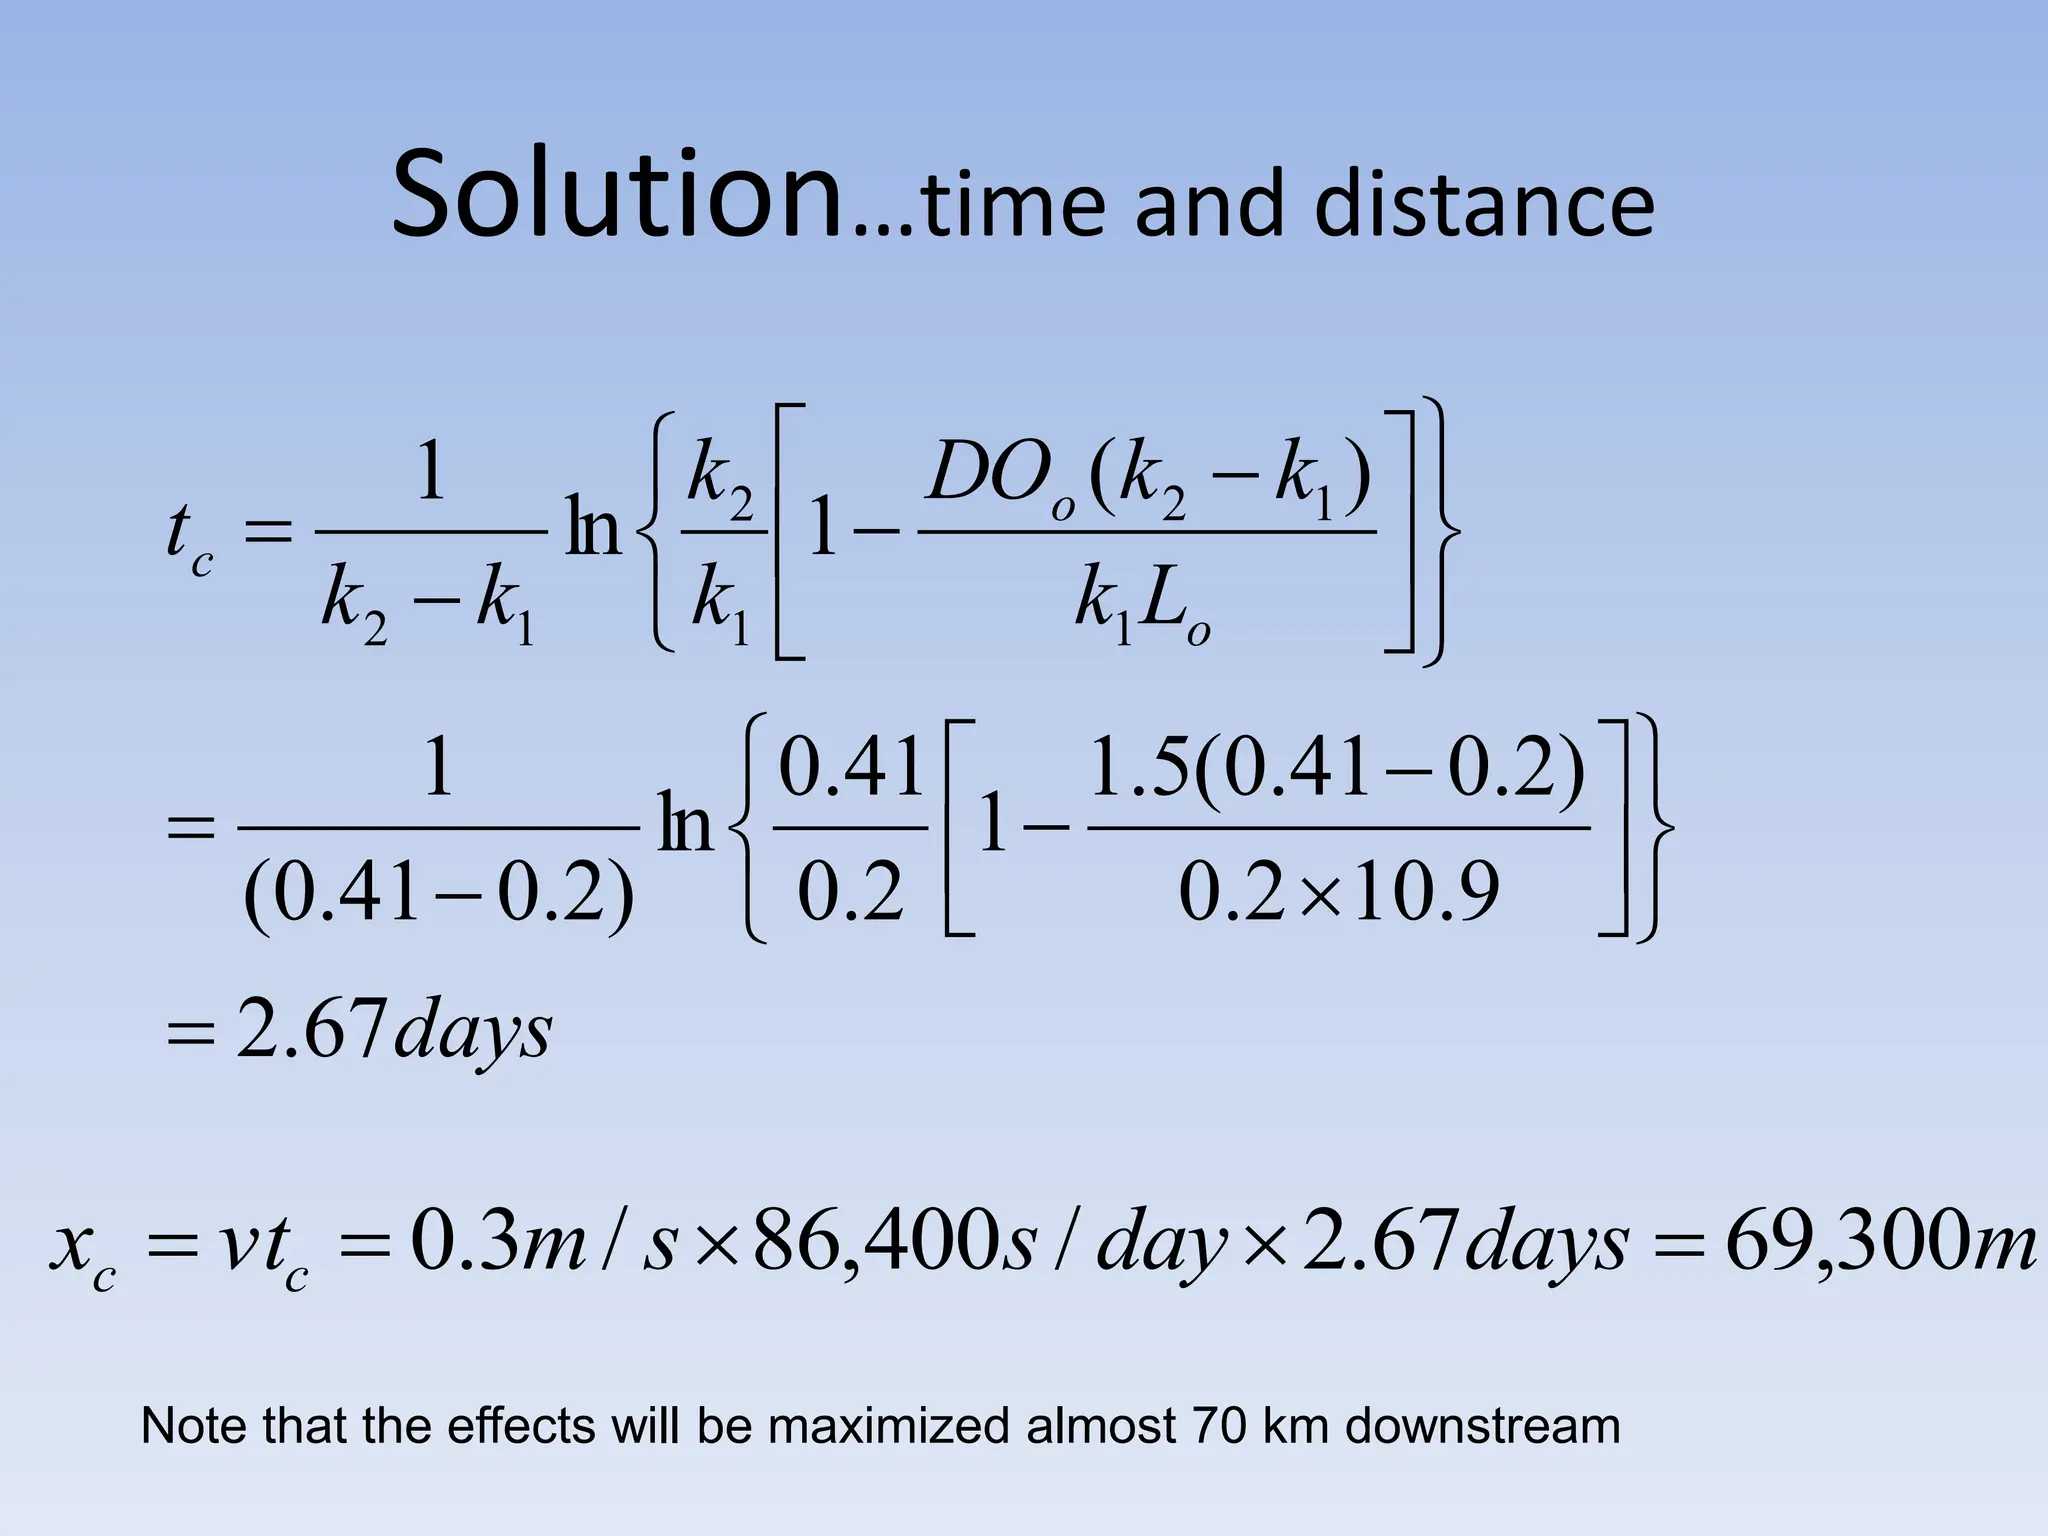
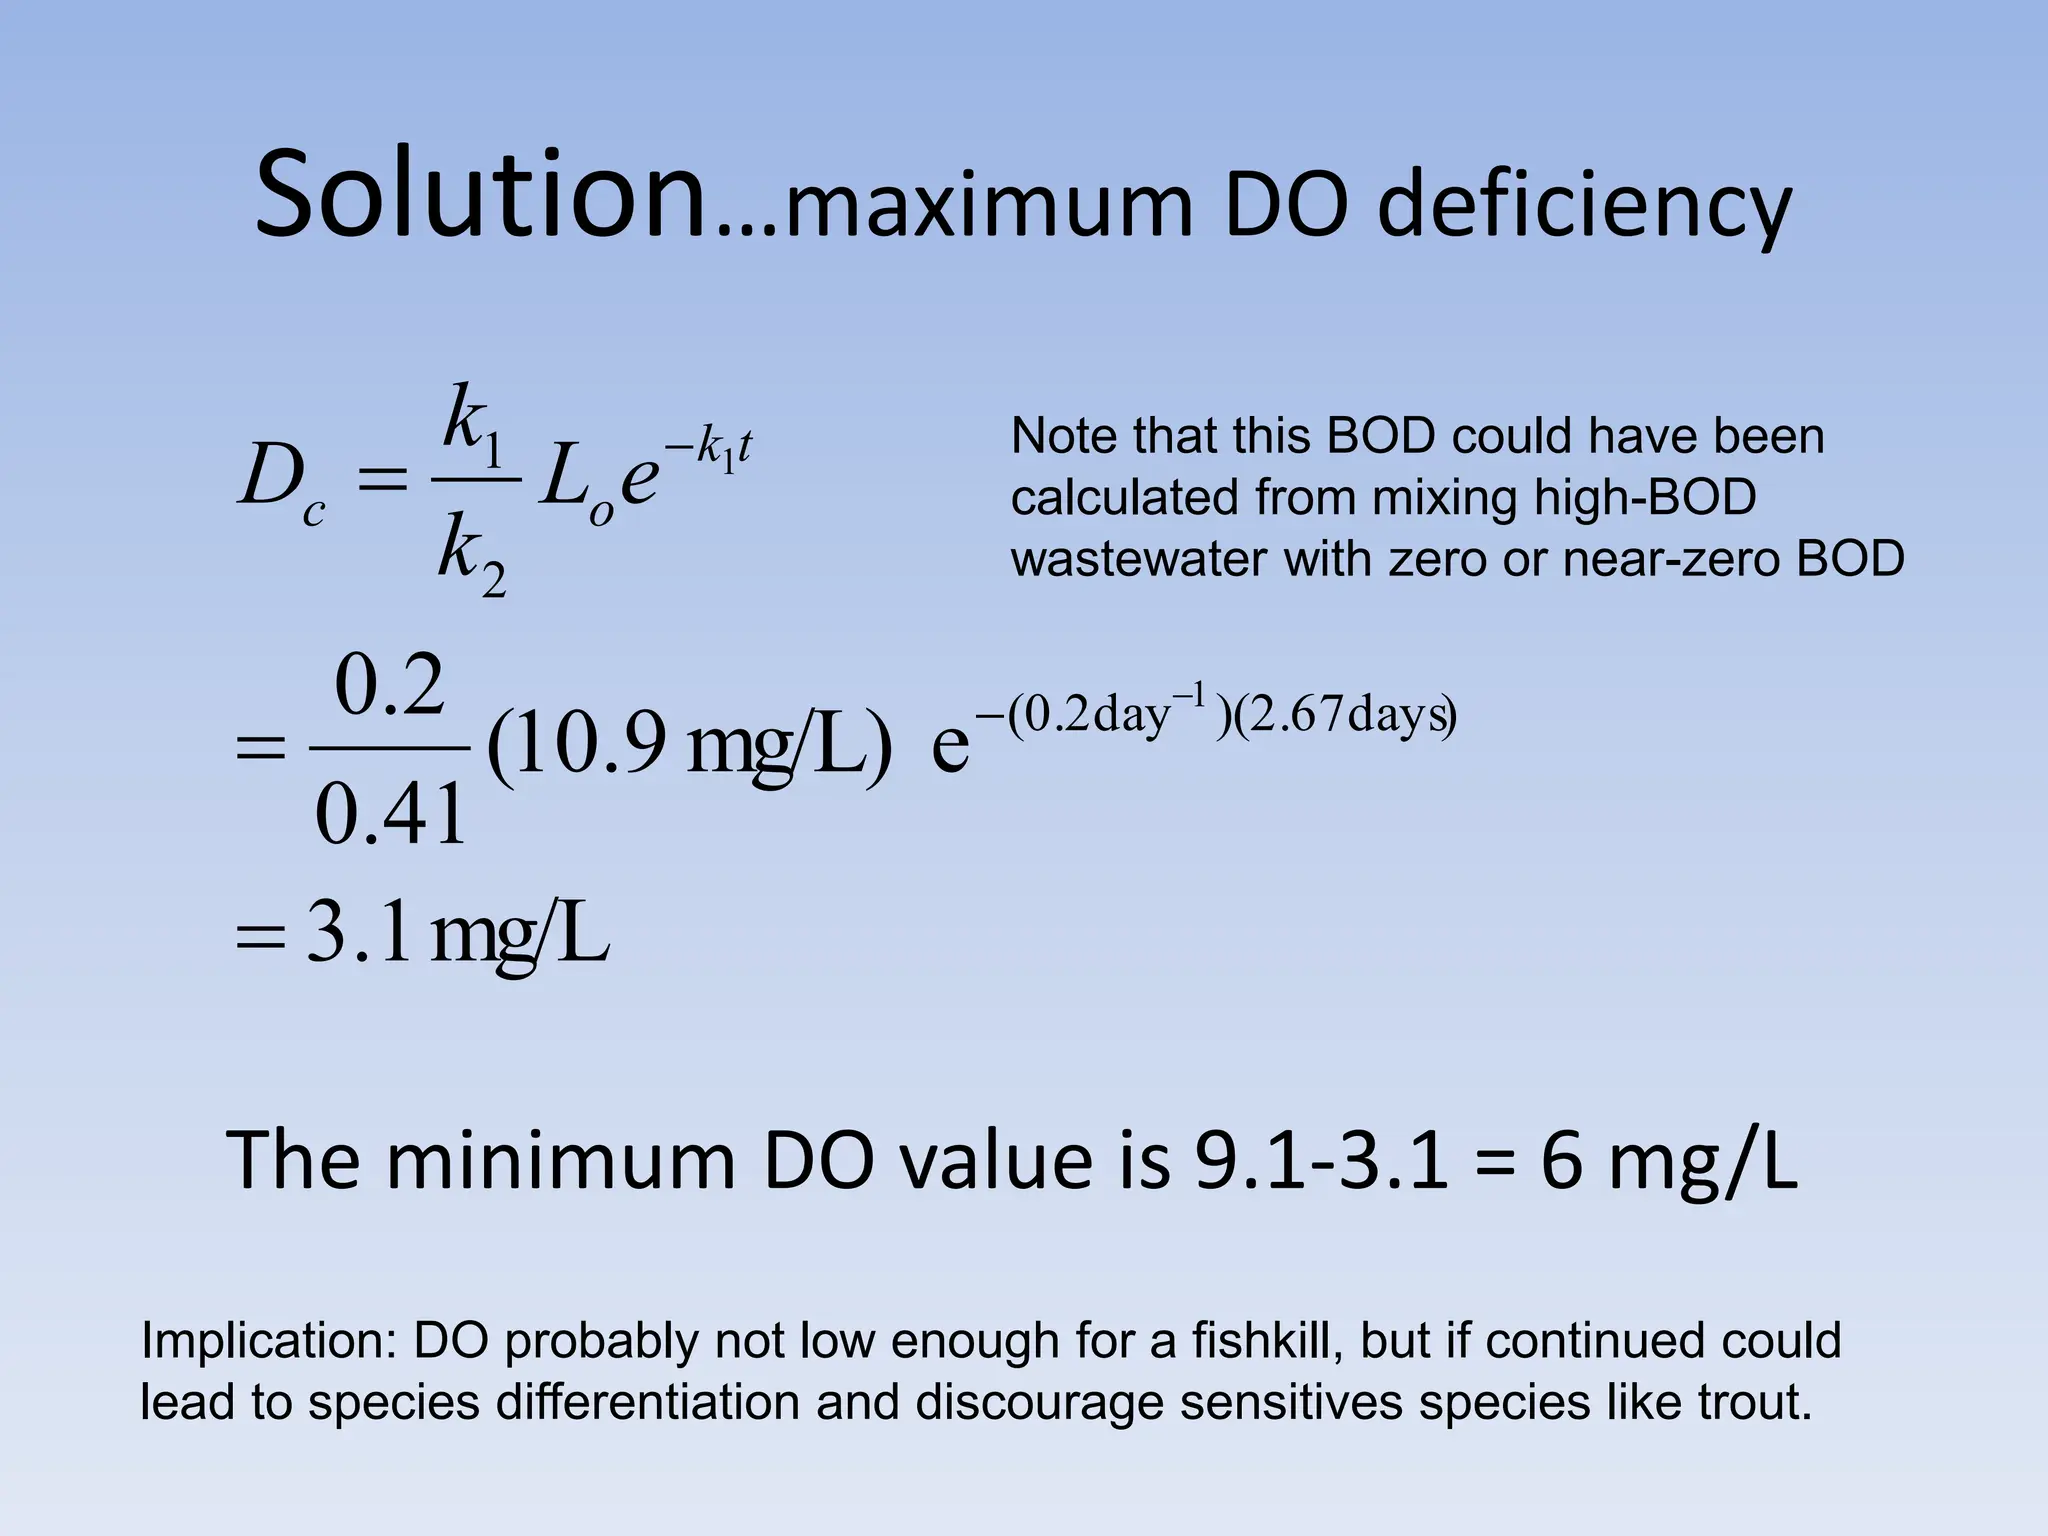
The document discusses the course BIOE 411/AE/CE/BRT 511, focusing on bioengineering principles, particularly in environmental contexts like wastewater treatment. It covers key topics such as dissolved oxygen measurement, biochemical oxygen demand (BOD) analysis, and the Streeter-Phelps model for understanding oxygen dynamics in water systems. The implications of oxygen depletion, pollution, and historical examples of disease outbreaks like cholera are also addressed to highlight the significance of these environmental factors.

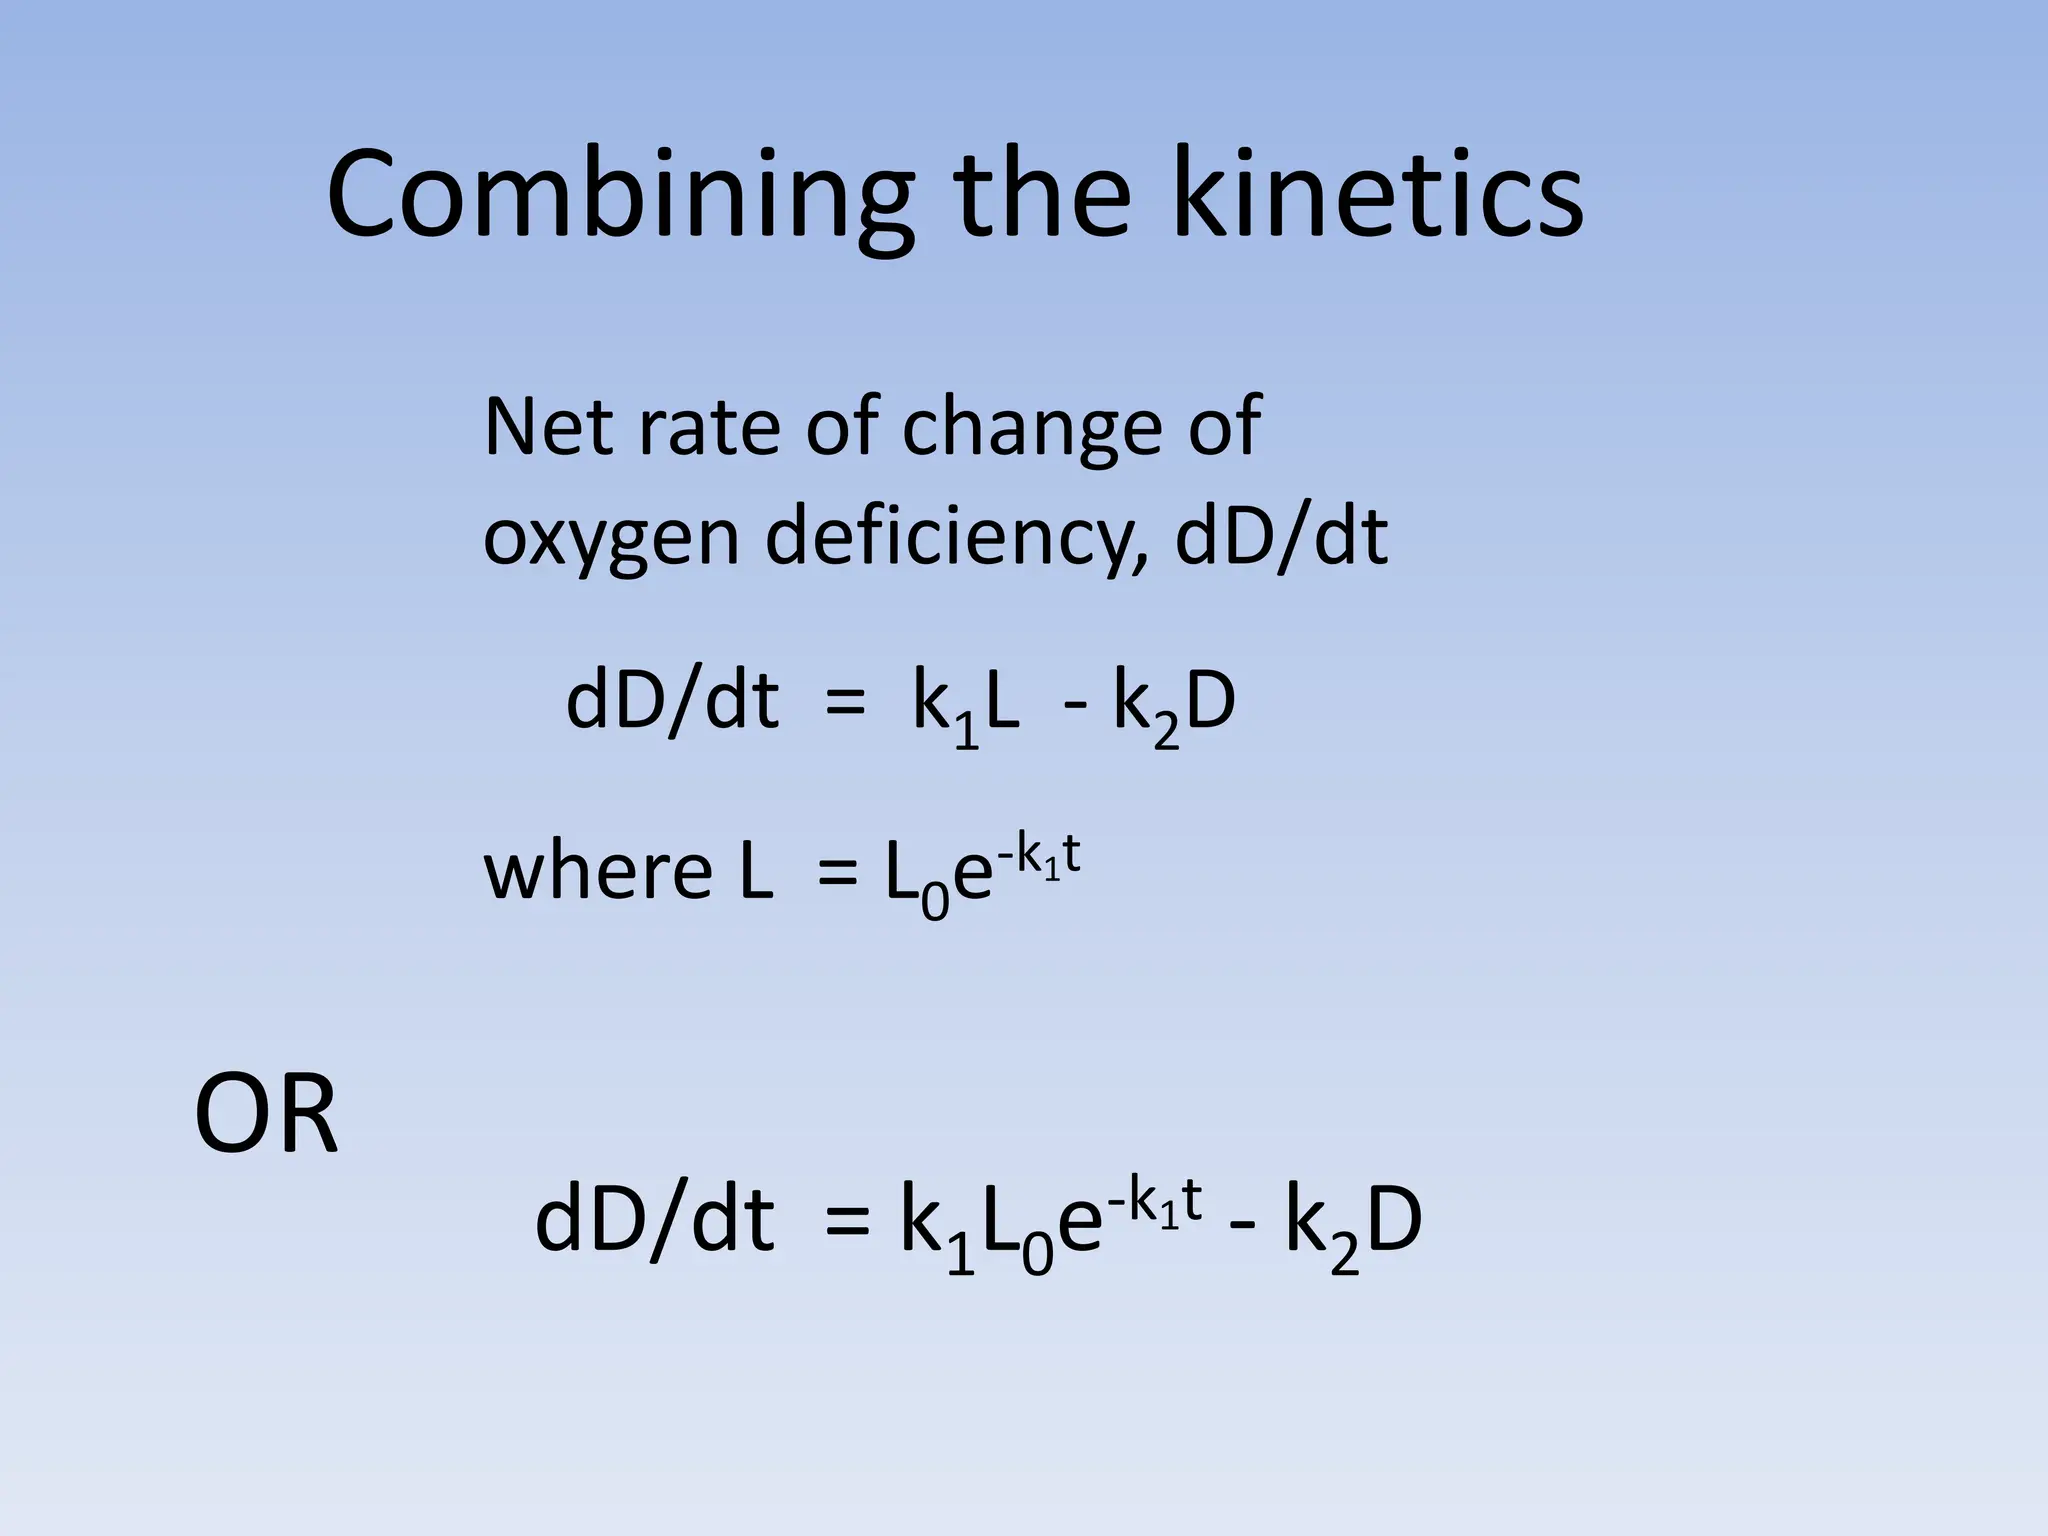
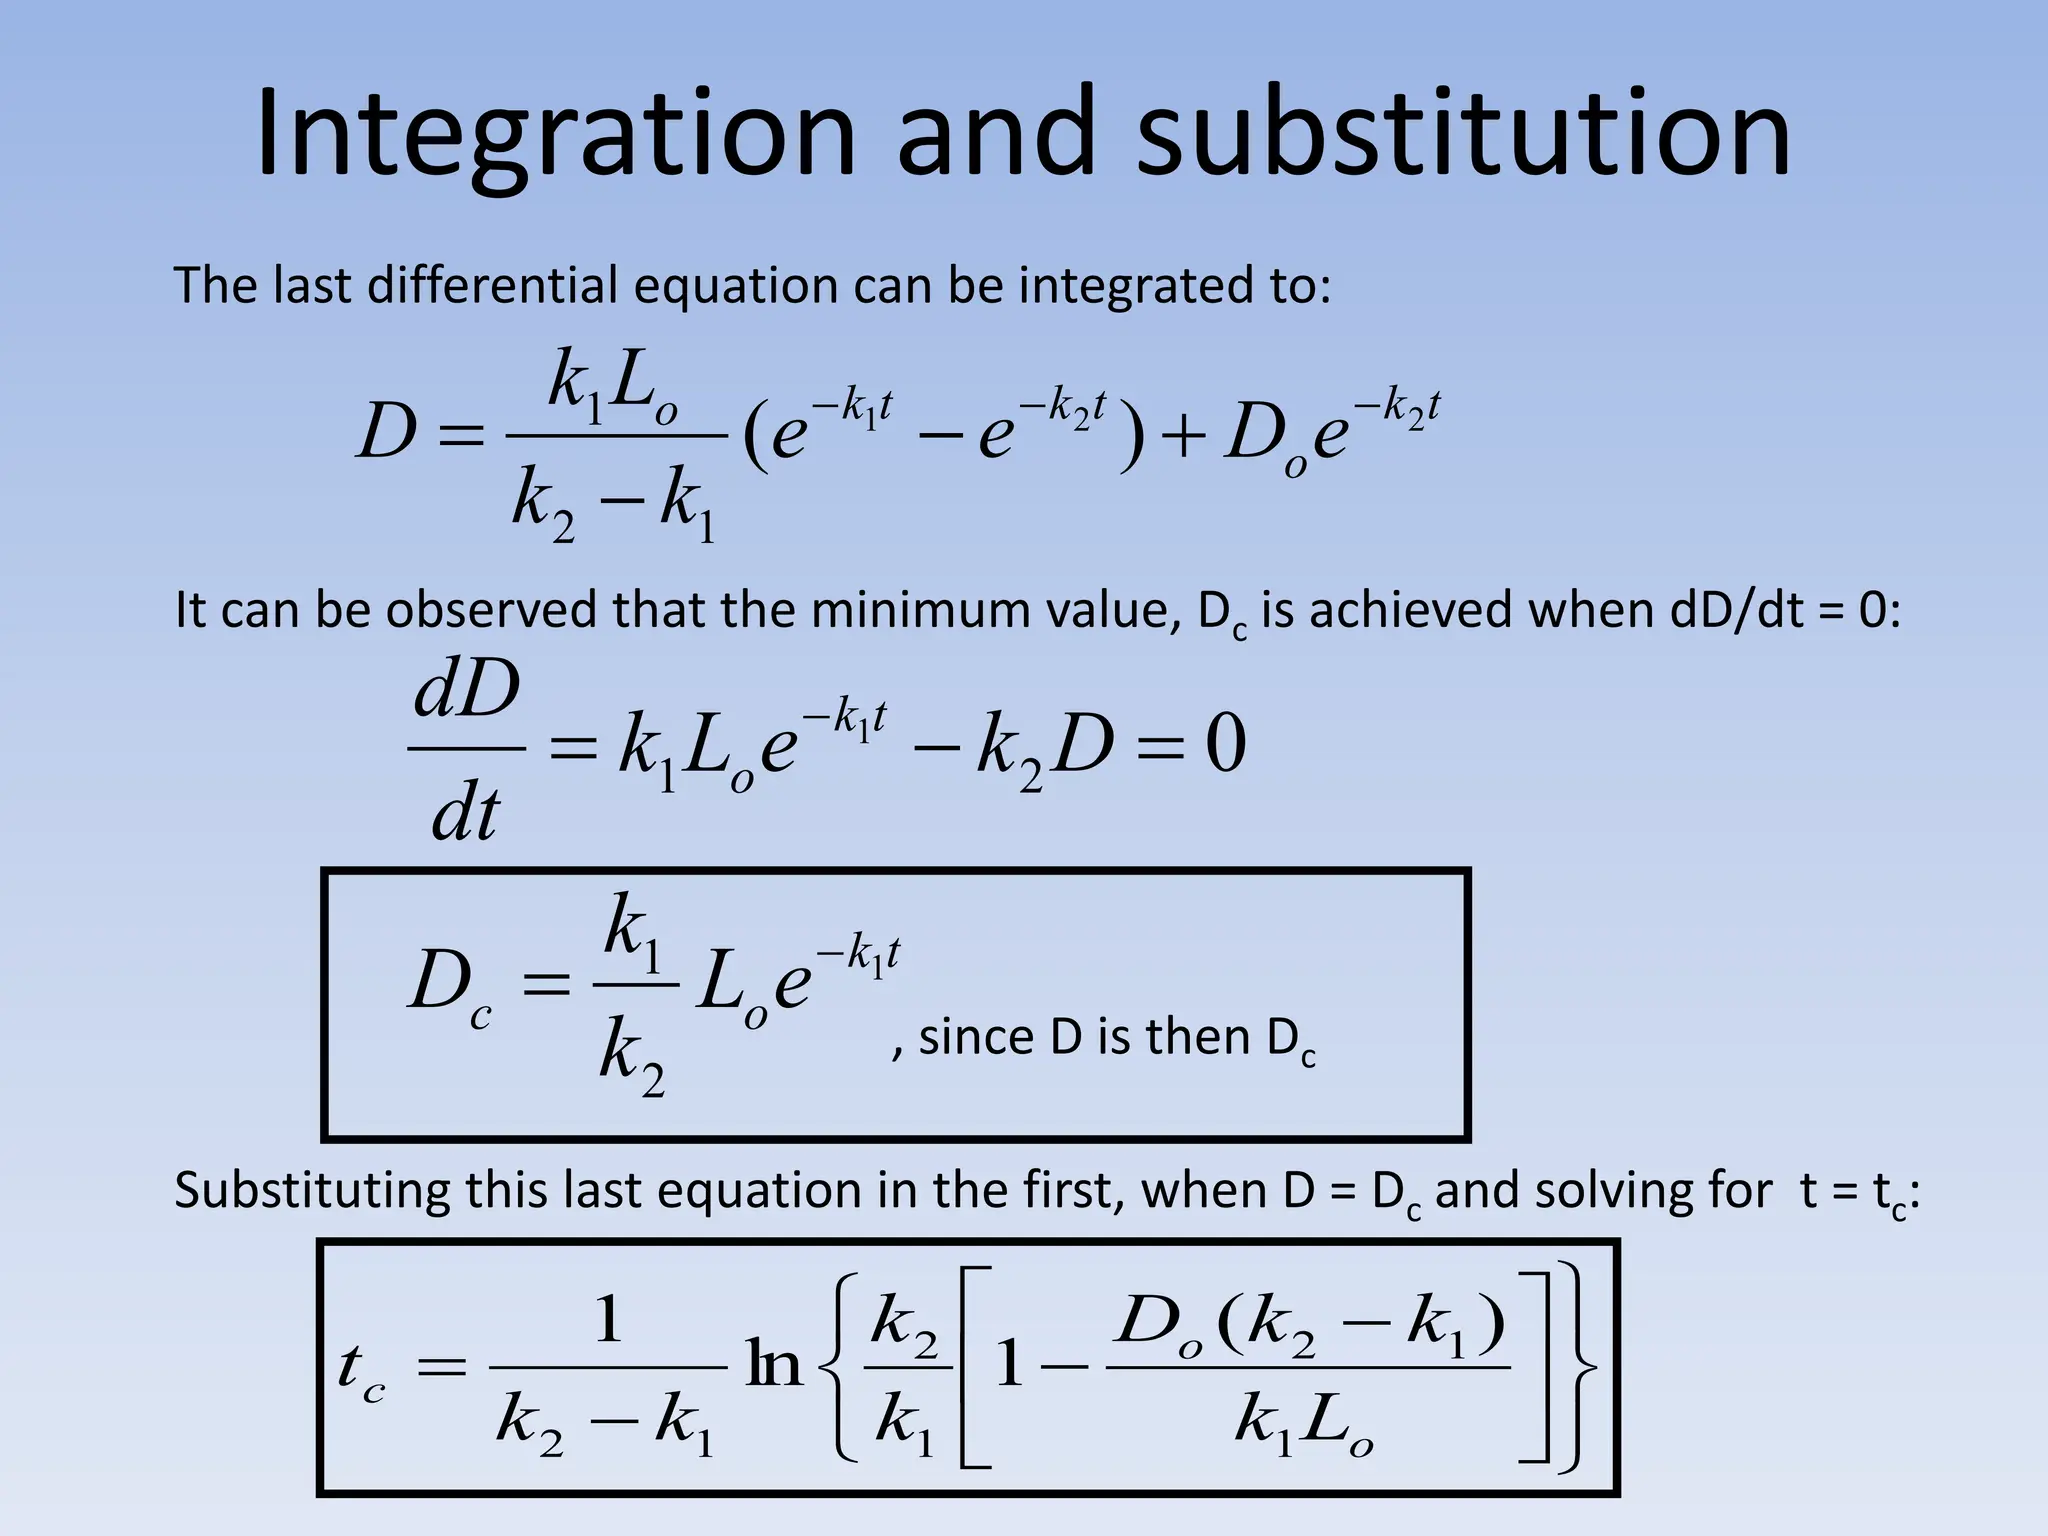
![Kinetics* for Streeter-Phelps Model
• Deoxygenation
L = BOD remaining at any time
dL/dt = Rate of deoxygenation equivalent to rate of BOD removal
dL/dt = -k1L for a first order reaction
k1 = deoxygenation constant, f’n of waste type and temp.
*See Kinetics presentation if unfamiliar with the mathematical processing
kL
dt
L
d
]
[
C
C
t
dt
k
L
dL
0 0
kt
kt
e
L
L
e
L
L
or
kt
L
L
0
0
0
ln](https://image.slidesharecdn.com/introductiontobioengineering-240114045211-ec24d0d3/75/INTRODUCTION-TO-one-of-the-BIOENGINEERING-ppt-27-2048.jpg)


![Waste_Water_testing[1].pdf](https://cdn.slidesharecdn.com/ss_thumbnails/wastewatertesting1-221102090004-f6e34f0a-thumbnail.jpg?width=640&height=640&fit=bounds)


