The document discusses the self-purification processes of natural streams and factors affecting dissolved oxygen (DO) levels, such as dilution, current, temperature, and sunlight. It presents the oxygen sag analysis using the Streeter-Phelps equation to describe the changes in oxygen deficit over time and distance due to the introduction of wastewater. Additionally, the document provides mathematical models and examples for calculating DO deficits, reoxygenation rates, and critical points in water bodies impacted by waste discharge.
![Module 12, Lecture Number- 15 M.M. Ghangrekar, IIT Kharagpur
4
….(2)
or ….(3)
This is first order first degree differential equation and solution of this equation is as under
….(4)
Changing base of natural log to 10 the equation can be expressed as:
….(5)
Where, K = BOD reaction rate constant, to the base 10
R = Reoxygenation constant to the base 10
Do = Initial oxygen deficit at the point of waste discharge at time t = o
t = time of travel in the stream from the point of discharge = x/u
x = distance along the stream
u = stream velocity
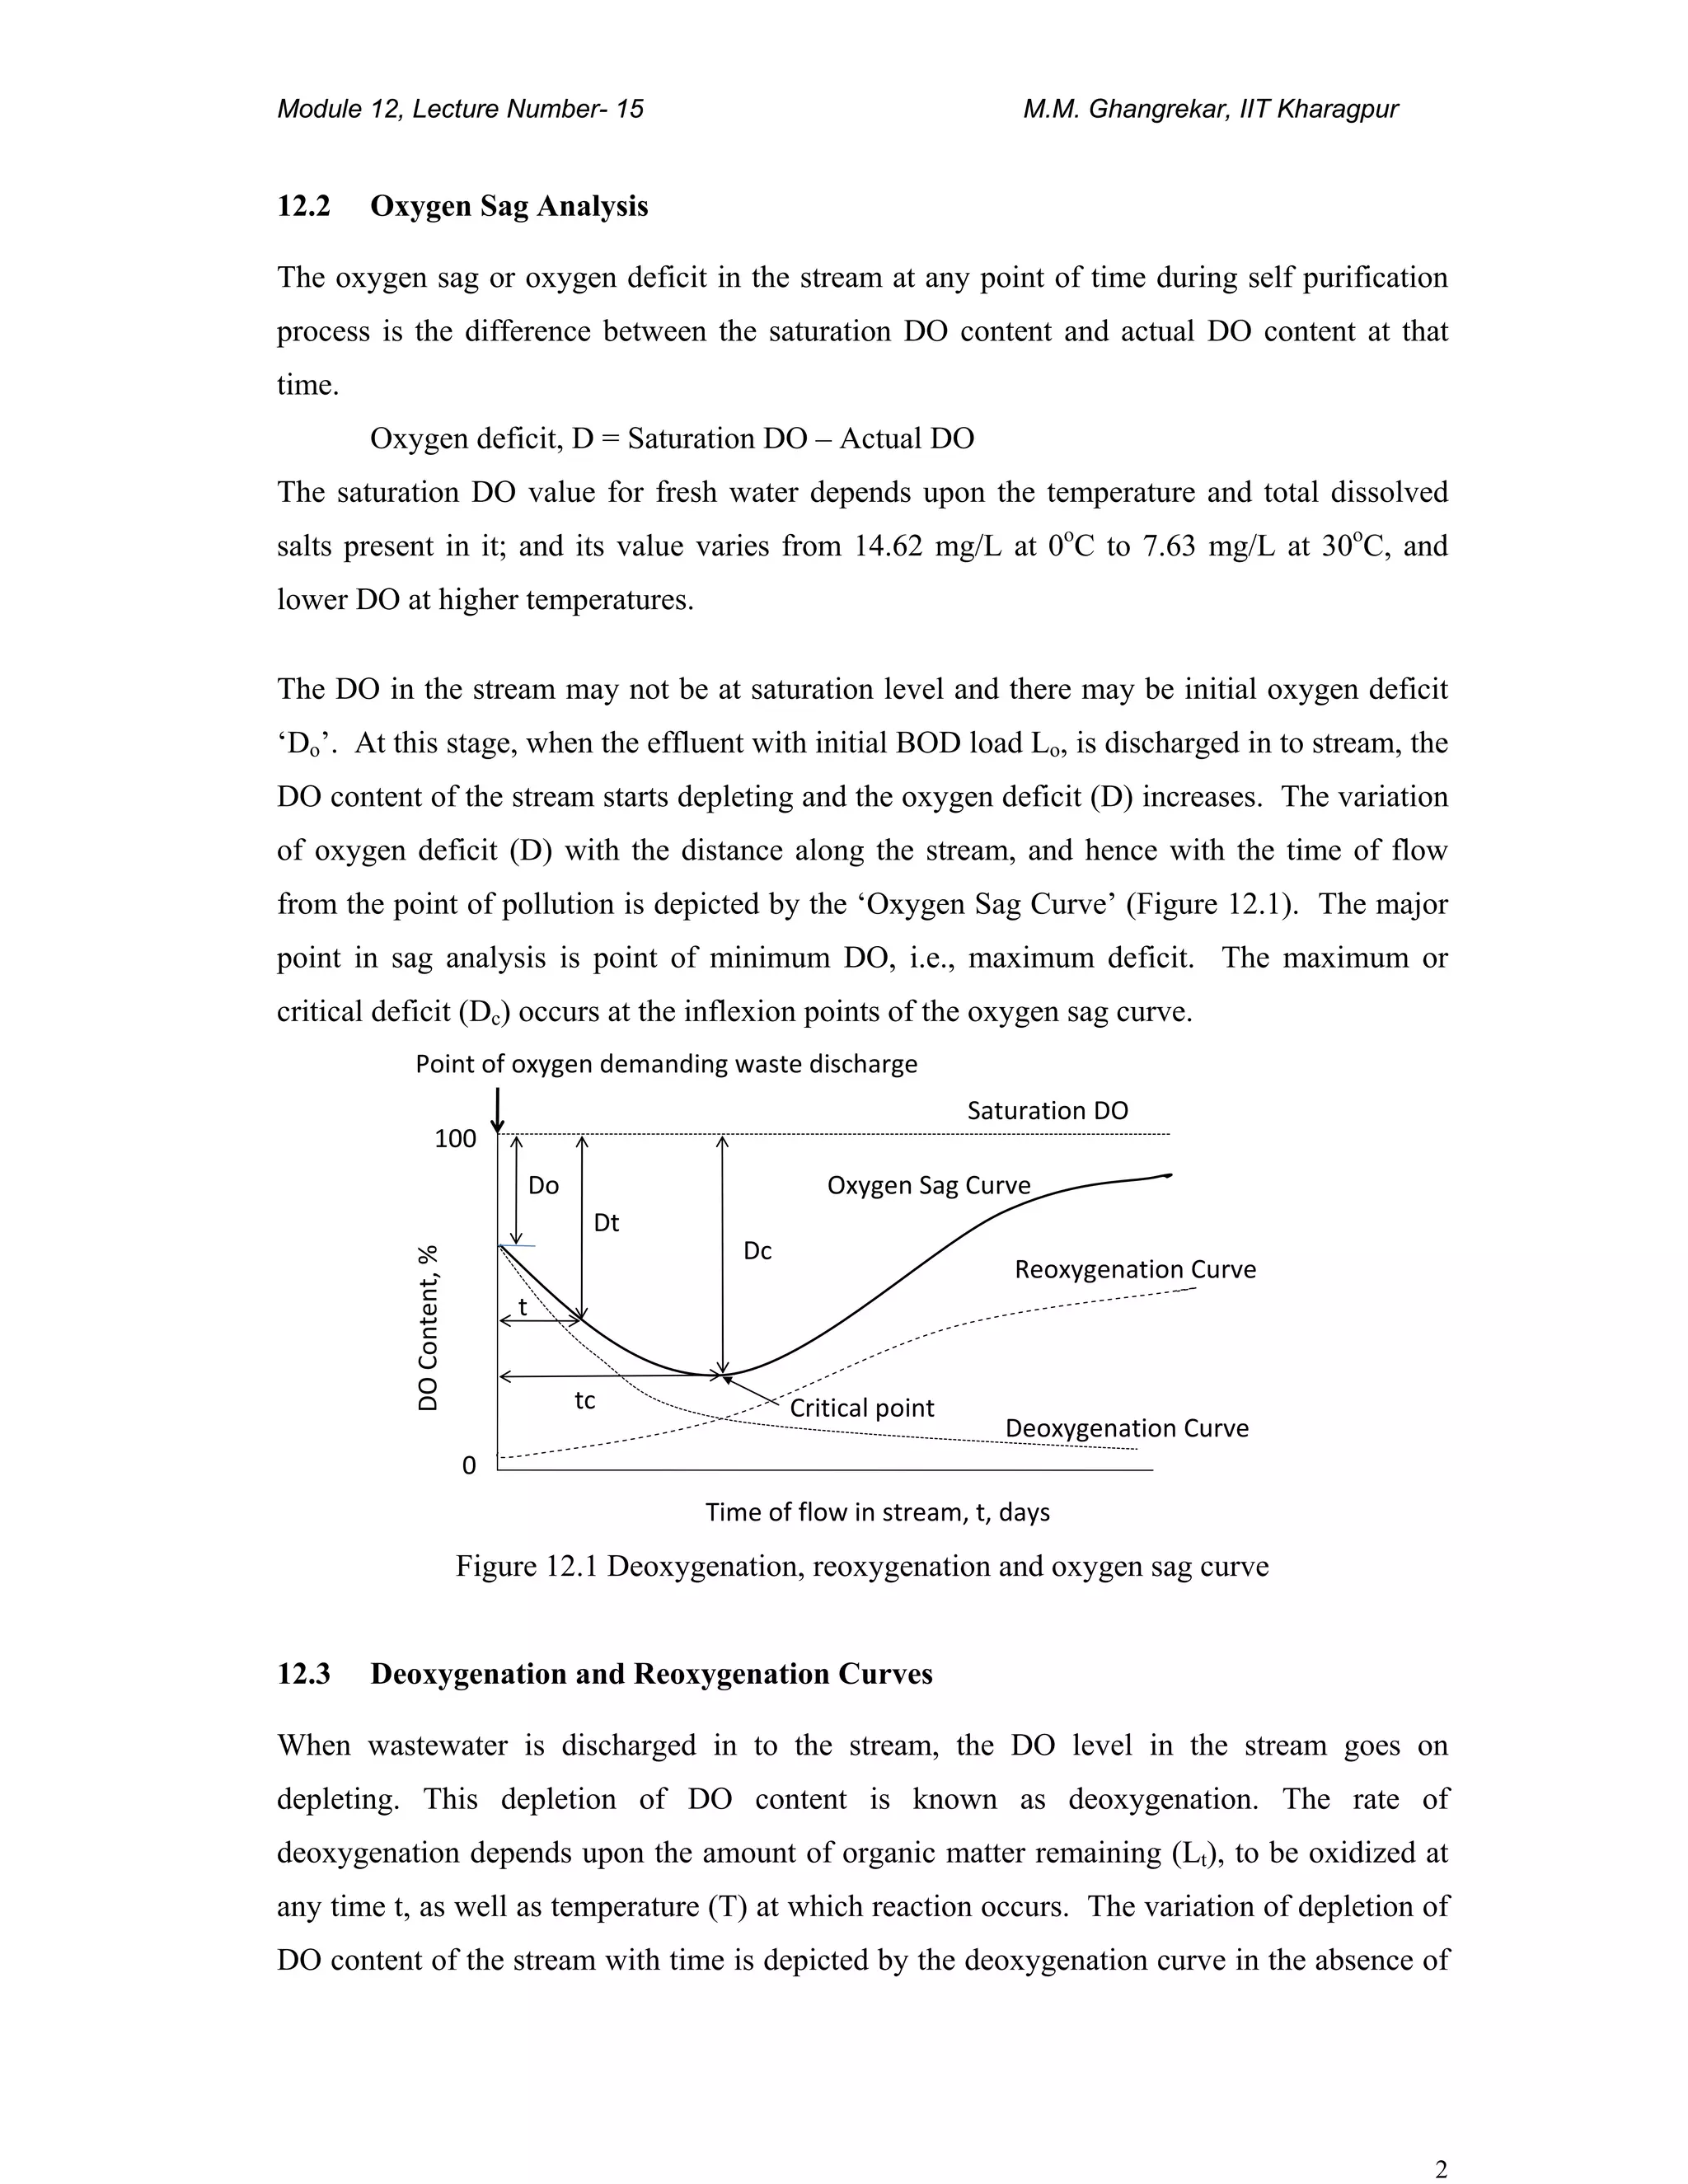
This is Streeter-Phelps oxygen sag equation. The graphical representation of this equation is
shown in Figure 12.2.
Figure 12.2 Oxygen sag curve of Streeter-Phelps equation
Note: Deoxygenation and reoxygenation occurs simultaneously. After critical point, the rate
of re-aeration is greater than the deoxygenation and after some distance the DO will reach to
original level and stream will not have any effect due to addition of wastewater. At time t=0
at x = 0.
DtReLoK
dt
dDt tK
'.' '
−= −
tK
eLoKDtR
dt
dDt '
.'' −
=+
[ ] tRtRtK
eDoee
KR
LoK
Dt '''
.
''
' −−−
+−
−
=
[ ] tRtRtK
Do
KR
KLo
Dt ...
10.1010 −−−
+−
−
=
Distance downstream, X
DO Concentration
Point of waste discharge
Saturation DO
Dc
Dt
X
Xc
Do
Critical point](https://image.slidesharecdn.com/selfpurificationofstreams-150322050901-conversion-gate01/75/Self-purification-of-river-streams-4-2048.jpg)
![Wastewater Management
7
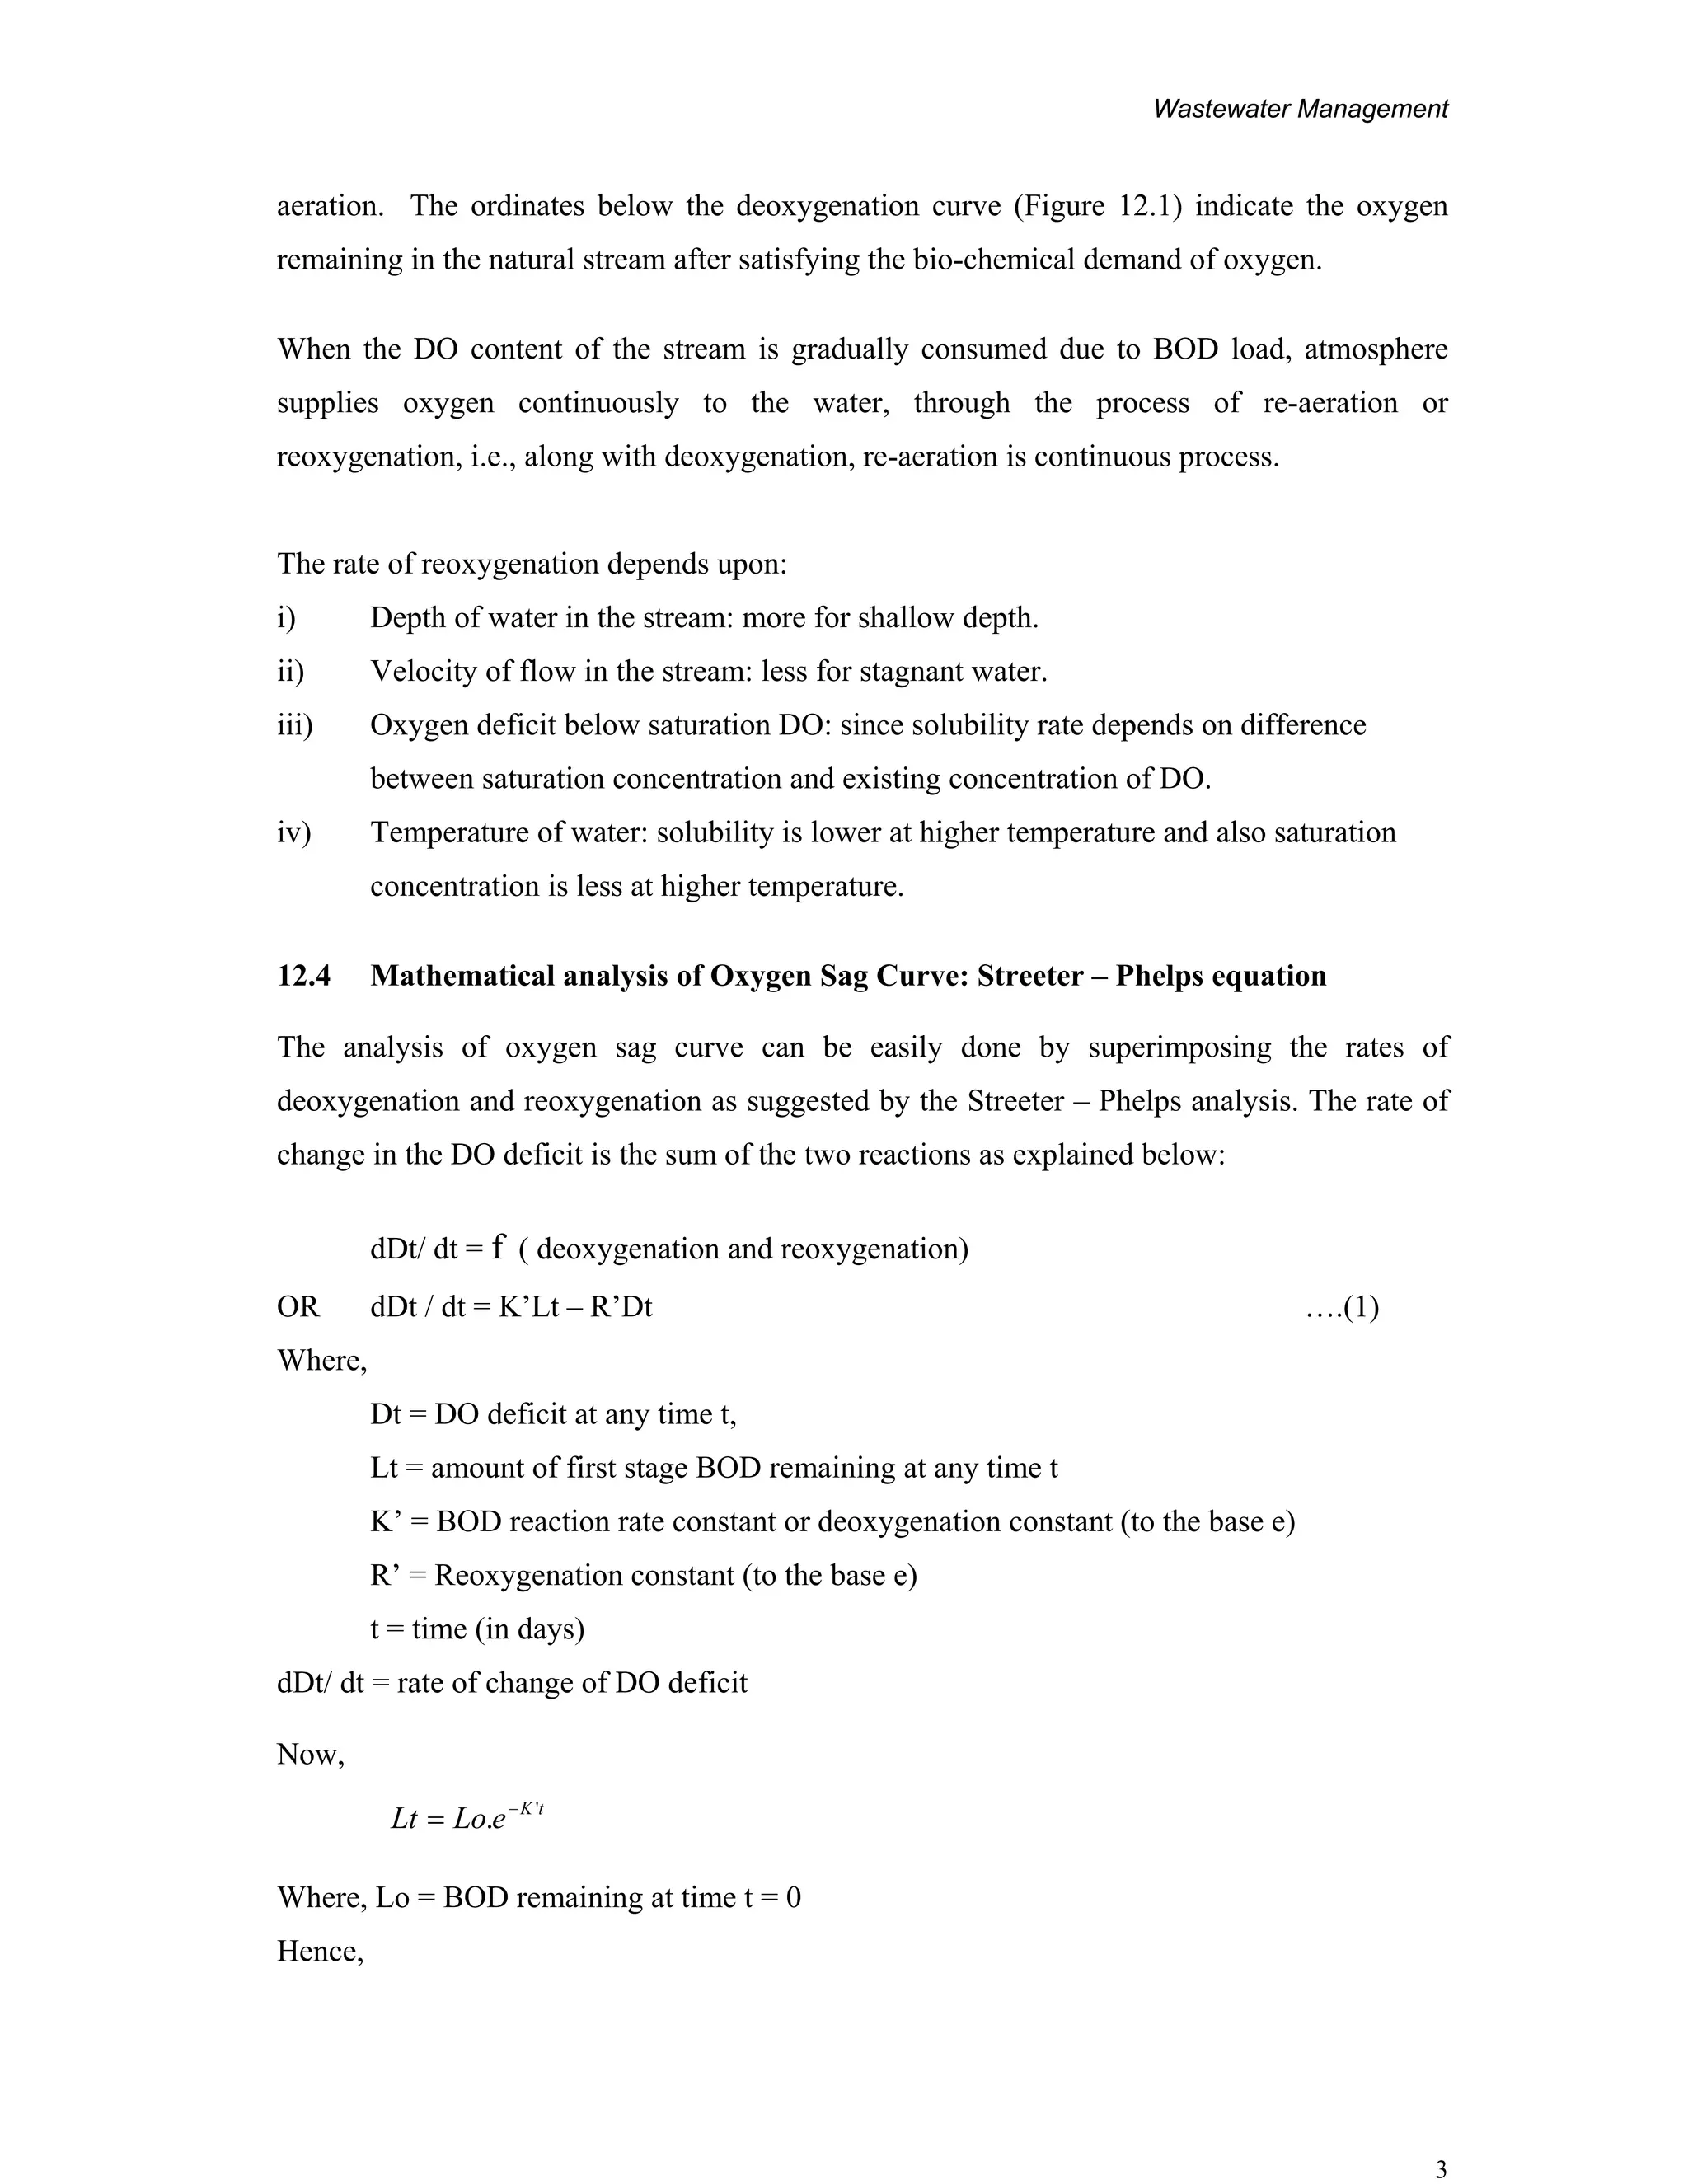
RT = R20 ( )
T-20
Hence, R23.74 = 0.40 (1.016)
23.74-20
= 0.424 day-1
Critical time tc = loge (1-
D
L
)
=
. .
loge
.
.
(1-
. . .
. .
)
= 2.557 days.
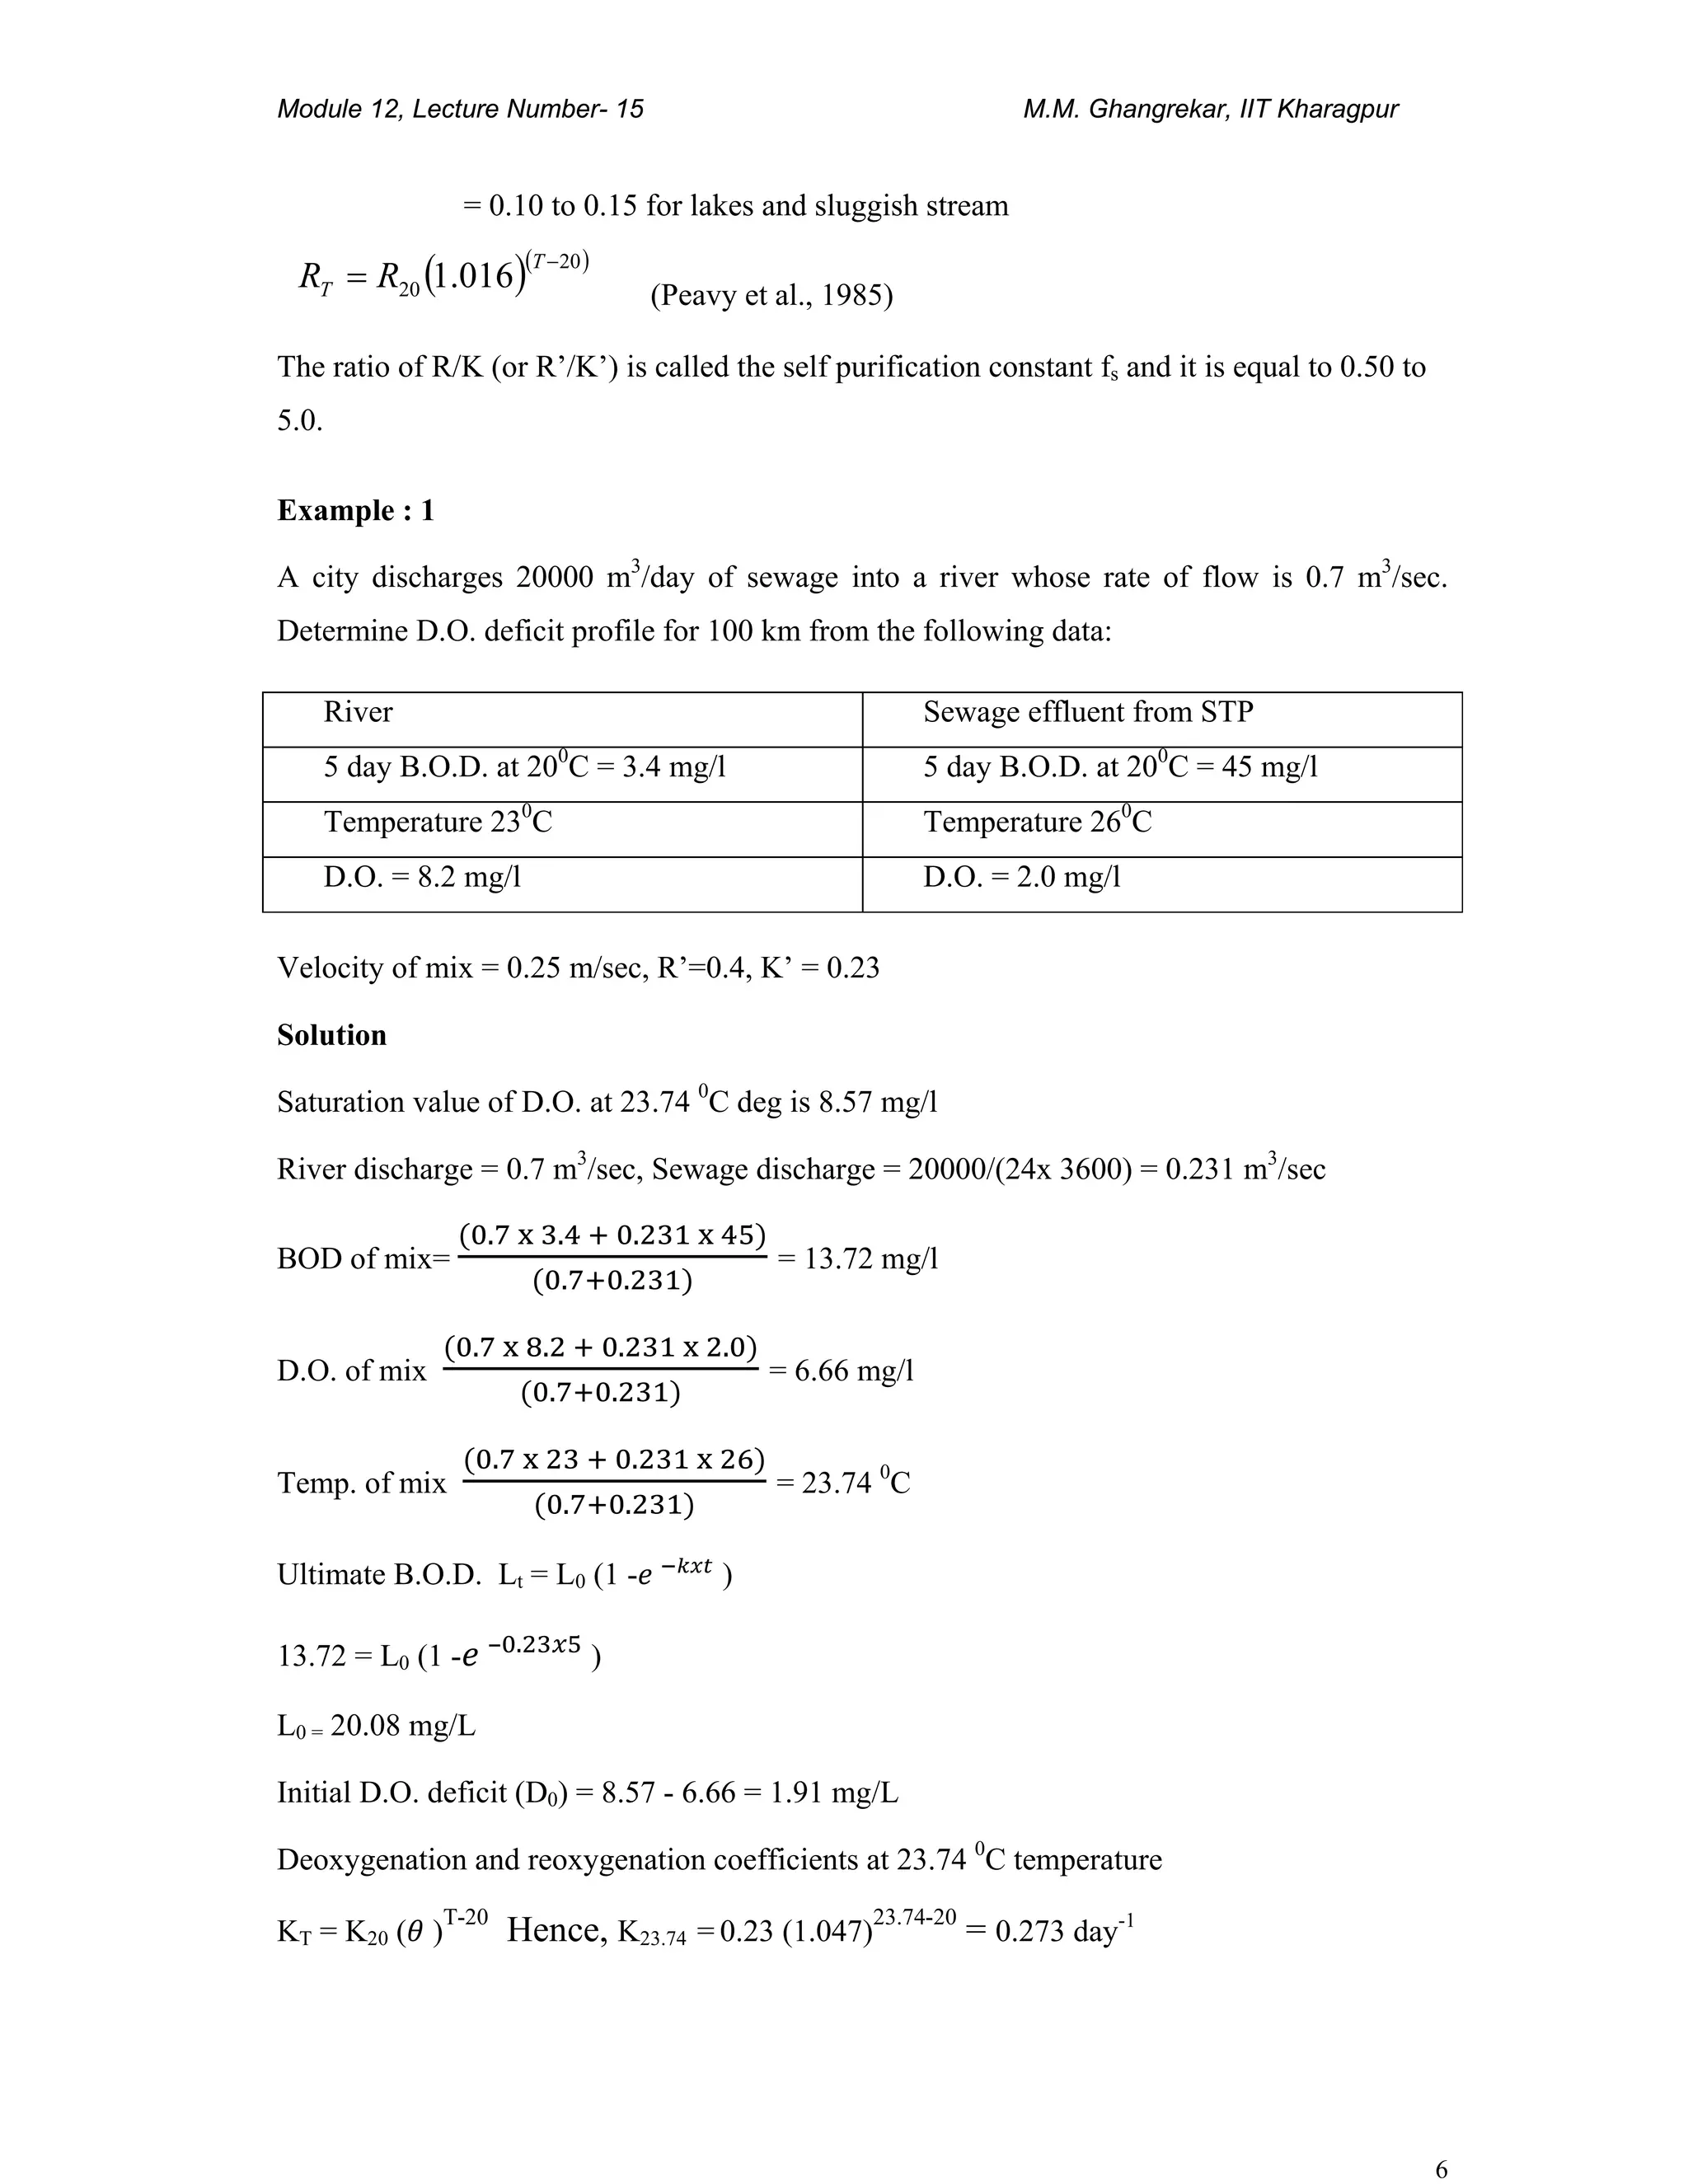
Critical D.O. deficit, Dc = L0
– .
=
.
.
20.08 – . .
= 6.432 mg/l
Distance at which it occurs = L= velocity x time
= (0.25 m/sec) x ( 2.557 x 24 x 60 x 60 sec)
= 55231 m = 55.23 km
Similarly time required for mix to reach at 20 km distance, t20km =
.
= 0.926 day
And DO deficit at 20 km can be calculated using equation 4
Where, K’ = 0.273 d-1
, R’ = 0.424 d-1
, Do = 1.91 mg/L and Lo = 20.08 mg/L and t = 0.926
day
Hence, DO deficit at 20 km = 4.970 mg/L
Similarly DO deficit at 40 km (i.e. t = 1.852 days) = 6.211 mg/L
and DO deficit at 80 km (i.e., t = 3.704 days) = 6.056 mg/L
and DO deficit at 100 km (i.e., t = 4.63 days) = 5.427 mg/L
[ ] tRtRtK
eDoee
KR
LoK
Dt '''
.
''
' −−−
+−
−
=](https://image.slidesharecdn.com/selfpurificationofstreams-150322050901-conversion-gate01/75/Self-purification-of-river-streams-7-2048.jpg)


![L 17 do sag [compatibility mode]](https://cdn.slidesharecdn.com/ss_thumbnails/l-17dosagcompatibilitymode-150311205622-conversion-gate01-thumbnail.jpg?width=640&height=640&fit=bounds)


