Vip Female Escorts Noida 9711199171 Greater Noida Escorts Service
Nalco ru4 qfy2010-140510
1. 4QFY2010 Result Update I Base Metals
May 14, 2010
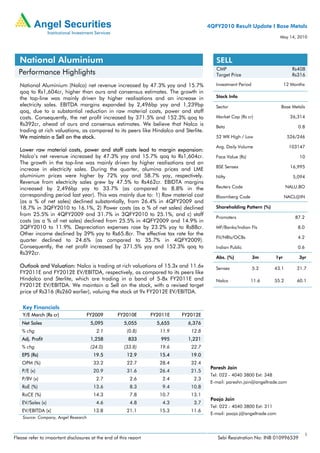
National Aluminium SELL
CMP Rs408
Performance Highlights Target Price Rs316
National Aluminium (Nalco) net revenue increased by 47.3% yoy and 15.7% Investment Period 12 Months
qoq to Rs1,604cr, higher than ours and consensus estimates. The growth in
the top-line was mainly driven by higher realisations and an increase in Stock Info
electricity sales. EBITDA margins expanded by 2,496bp yoy and 1,239bp Sector Base Metals
qoq, due to a substantial reduction in raw material costs, power and staff
costs. Consequently, the net profit increased by 371.5% and 152.3% qoq to Market Cap (Rs cr) 26,314
Rs392cr, ahead of ours and consensus estimates. We believe that Nalco is Beta 0.8
trading at rich valuations, as compared to its peers like Hindalco and Sterlite.
We maintain a Sell on the stock. 52 WK High / Low 526/246
Avg. Daily Volume 103147
Lower raw material costs, power and staff costs lead to margin expansion:
Nalco’s net revenue increased by 47.3% yoy and 15.7% qoq to Rs1,604cr. Face Value (Rs) 10
The growth in the top-line was mainly driven by higher realisations and an
BSE Sensex 16,995
increase in electricity sales. During the quarter, alumina prices and LME
aluminium prices were higher by 72% yoy and 58.7% yoy, respectively. Nifty 5,094
Revenue from electricity sales grew by 47.5% to Rs462cr. EBIDTA margins
increased by 2,496bp yoy to 33.7% (as compared to 8.8% in the Reuters Code NALU.BO
corresponding period last year). This was mainly due to: 1) Raw material cost Bloomberg Code NACL@IN
(as a % of net sales) declined substantially, from 26.4% in 4QFY2009 and
18.7% in 3QFY2010 to 16.1%, 2) Power costs (as a % of net sales) declined Shareholding Pattern (%)
from 25.5% in 4QFY2009 and 31.7% in 3QFY2010 to 25.1%, and c) staff
Promoters 87.2
costs (as a % of net sales) declined from 25.5% in 4QFY2009 and 14.9% in
3QFY2010 to 11.9%. Depreciation expenses rose by 23.2% yoy to Rs88cr. MF/Banks/Indian FIs 8.0
Other income declined by 39% yoy to Rs65.8cr. The effective tax rate for the
FII/NRIs/OCBs 4.2
quarter declined to 24.6% (as compared to 35.7% in 4QFY2009).
Consequently, the net profit increased by 371.5% yoy and 152.3% qoq to Indian Public 0.6
Rs392cr.
Abs. (%) 3m 1yr 3yr
Outlook and Valuation: Nalco is trading at rich valuations of 15.3x and 11.6x Sensex 5.2 43.1 21.7
FY2011E and FY2012E EV/EBITDA, respectively, as compared to its peers like
Hindalco and Sterlite, which are trading in a band of 5-8x FY2011E and Nalco 11.6 55.2 60.1
FY2012E EV/EBITDA. We maintain a Sell on the stock, with a revised target
price of Rs316 (Rs260 earlier), valuing the stock at 9x FY2012E EV/EBITDA.
Key Financials
Y/E March (Rs cr) FY2009 FY2010E FY2011E FY2012E
Net Sales 5,095 5,055 5,655 6,376
% chg 2.1 (0.8) 11.9 12.8
Adj. Profit 1,258 833 995 1,221
% chg (24.0) (33.8) 19.6 22.7
EPS (Rs) 19.5 12.9 15.4 19.0
OPM (%) 33.2 22.7 28.4 32.4
Paresh Jain
P/E (x) 20.9 31.6 26.4 21.5
Tel: 022 - 4040 3800 Ext: 348
P/BV (x) 2.7 2.6 2.4 2.3
E-mail: pareshn.jain@angeltrade.com
RoE (%) 13.6 8.3 9.4 10.8
RoCE (%) 14.3 7.8 10.7 13.1
Pooja Jain
EV/Sales (x) 4.6 4.8 4.3 3.7
Tel: 022 - 4040 3800 Ext: 311
EV/EBITDA (x) 13.8 21.1 15.3 11.6
E-mail: pooja.j@angeltrade.com
Source: Company, Angel Research
1
Please refer to important disclosures at the end of this report Sebi Registration No: INB 010996539
2. NALCO I 4QFY2010 Result Update
Exhibit 1: 4QFY2010 Performance
(Rs cr) 4QFY10 4QFY09 % yoy FY2010 FY2009 % yoy
Net Sales 1,604 1,088 47.3 5,055 5,095 (0.8)
Raw Material 259 287 (9.9) 814 585 39.1
% of Net sales 16.1 26.4 16.1 11.5
Power and Fuel 402 278 44.8 1,612 1,312 22.9
% of Net sales 25.1 25.5 31.9 25.7
Staff Cost 190 277 (31.5) 745 771 (3.3)
% of Net sales 11.9 25.5 14.7 15.1
Other Expenses 234 188 24.4 841 733 14.7
% of Net sales 14.6 17.3 16.6 14.4
Total Expenditure 1,085 1,030 5.3 4,012 3,401 18.0
% of Net sales 67.7 94.6 79.4 66.8
Operating Income 22 37 (39.9) 103 0 -
EBITDA 541 96 466.2 1,146 1,694 (32.3)
% of Net sales 33.7 8.8 22.7 33.2
Interest 0 3 (97.6) 2 4 (45.7)
Depreciation 88 71 23.2 319 272 17.0
Other Income 66 108 (39.0) 369 496 (25.6)
Exceptional Items 0 0 - 0 14 -
Profit before Tax 519 129 301.7 1,194 1,927 (38.0)
% of Net sales 32.4 11.9 23.6 37.8
Provision for tax 127 46 - 362 655 (44.8)
% of PBT 24.6 35.7 30.3 34.0
Reported PAT 391 83 371.5 833 1,272 (34.6)
% of Net sales 24.4 7.6 16.5 25.0
Diluted EPS (Rs) 6.1 1.3 371.5 12.9 19.5 (33.8)
Source: Company, Angel Research
Exhibit 2: Segmental performance
(Rs Cr) 4QFY2010 4QFY2009 % yoy 3QFY2010 % qoq
Revenue
Chemicals 695 492 41.1 509 36.6
Aluminium 1,253 804 55.9 1,141 9.8
Electricity 462 313 47.5 350 32.1
Total Revenue 2,410 1,609 49.8 2,000 20.5
Less: intersegment 806 521 54.8 613 31.5
Net Revenue 1,604 1,088 47.3 1,386 15.7
EBIT
Chemicals 416 149 179.3 128 225.9
Aluminium (331) (140) 136.9 62 (632.1)
Electricity 400 58 589.8 70 473.9
Total 485 67 621.9 259 86.9
Unallocated income 34 65 (47.3) 20 75.5
Interest Expense (0) (3) (97.6) (0) (50.0)
PBT 519 129 301.7 279 86.2
EBIT margin (%)
Chemicals 59.8 30.2 25.1
Aluminium (26.4) (17.4) 5.4
Electricity 86.6 18.5 19.9
Source: Company, Angel Research
May 14, 2010 2
3. NALCO I 4QFY2010 Result Update
Outlook and Valuation
In our view, the recent fall in aluminium prices on LME led to some inventory
liquidation which currently stands at 4.5mn tonnes, down 3.2% ytd. Aluminium
inventory levels have increased by 98.8% in CY2009, whereas aluminium prices
have risen by 45.7% during the same period. We believe that the aluminium
inventory levels are still at the higher end as compared to its 10-year historical
average of 1.3mn tonnes which can limit the upside in aluminium prices.
Exhibit 3: Aluminium LME prices and inventory levels
3,500 5,000
3,000
4,000
2,500
(000' tonnes)
(US $/tonne)
2,000 3,000
1,500 2,000
1,000
1,000
500
0 0
May-00 May-02 May-04 May-06 May-08 May-10
Inventory (RHS) Aluminium prices (LHS)
Source: Bloomberg, Angel Research
At the CMP of Rs408, Nalco is trading at rich valuations of 15.3x and 11.6x
FY2011E and FY2012E EV/EBITDA, respectively, as compared to its peers like
Hindalco and Sterlite, which are trading in a band of 5-8x FY2011E and FY2012E
EV/EBITDA. We maintain a Sell on the stock, with a revised target price of Rs316
(Rs260 earlier), valuing the stock at 9x FY2012E EV/EBITDA.
Key risks to our call: 1) Higher metal prices, and 2) favorable exchange rate
movement.
Exhibit 4: 1-year forward EV/EBITDA
(Rs cr)
80,000
70,000
60,000
50,000
40,000
20X
30,000
16X
20,000 12X
8X
10,000
4X
0
Apr-05 Apr-06 Apr-07 Apr-08 Apr-09 Apr-10
Source: Bloomberg, Angel Research
May 14, 2010 3
7. NALCO I 4QFY2010 Result Update
Research Team Tel: 022-4040 3800 E-mail: research@angeltrade.com Website: www.angeltrade.com
DISCLAIMER
This document is solely for the personal information of the recipient, and must not be singularly used as the basis of any investment decision. Nothing in this
document should be construed as investment or financial advice. Each recipient of this document should make such investigations as they deem necessary to
arrive at an independent evaluation of an investment in the securities of the companies referred to in this document (including the merits and risks involved),
and should consult their own advisors to determine the merits and risks of such an investment.
Angel Securities Limited, its affiliates, directors, its proprietary trading and investment businesses may, from time to time, make investment decisions that are
inconsistent with or contradictory to the recommendations expressed herein. The views contained in this document are those of the analyst, and the company
may or may not subscribe to all the views expressed within.
Reports based on technical and derivative analysis center on studying charts of a stock's price movement, outstanding positions and trading volume, as
opposed to focusing on a company's fundamentals and, as such, may not match with a report on a company's fundamentals.
The information in this document has been printed on the basis of publicly available information, internal data and other reliable sources believed to be true,
and is for general guidance only. Angel Securities Limited has not independently verified all the information contained within this document. Accordingly, we
cannot testify, nor make any representation or warranty, express or implied, to the accuracy, contents or data contained within this document. While Angel
Securities Limited endeavours to update on a reasonable basis the information discussed in this material, there may be regulatory, compliance, or other
reasons that prevent us from doing so.
This document is being supplied to you solely for your information, and its contents, information or data may not be reproduced, redistributed or passed on,
directly or indirectly.
Angel Securities Limited and its affiliates may seek to provide or have engaged in providing corporate finance, investment banking or other advisory services
in a merger or specific transaction to the companies referred to in this report, as on the date of this report or in the past.
Neither Angel Securities Limited, nor its directors, employees or affiliates shall be liable for any loss or damage that may arise from or in connection with the
use of this information.
Note: Please refer to the important `Stock Holding Disclosure' report on the Angel website (Research Section).
Disclosure of Interest Statement Nalco
1. Analyst ownership of the stock No
2. Angel and its Group companies ownership of the stock No
3. Angel and its Group companies’ Directors ownership of the stock No
4. Broking relationship with company covered No
Note: We have not considered any Exposure below Rs 1 lakh for Angel and its Group companies
Address: Acme Plaza, ‘A’ Wing, 3rd Floor, M.V. Road, Opp. Sangam Cinema, Andheri (E), Mumbai - 400 059.
Tel: (022) 3952 4568 / 4040 3800
Angel Broking Ltd: BSE Sebi Regn No : INB 010996539 / CDSL Regn No: IN - DP - CDSL - 234 - 2004 / PMS Regn Code: PM/INP000001546 Angel Securities Ltd:BSE: INB010994639/INF010994639 NSE:
INB230994635/INF230994635 Membership numbers: BSE 028/NSE:09946
Angel Capital & Debt Market Ltd: INB 231279838 / NSE FNO: INF 231279838 / NSE Member code -12798 Angel Commodities Broking (P) Ltd: MCX Member ID: 12685 / FMC Regn No: MCX / TCM /
CORP / 0037 NCDEX : Member ID 00220 / FMC Regn No: NCDEX / TCM / CORP / 0302
May 14, 2010 7