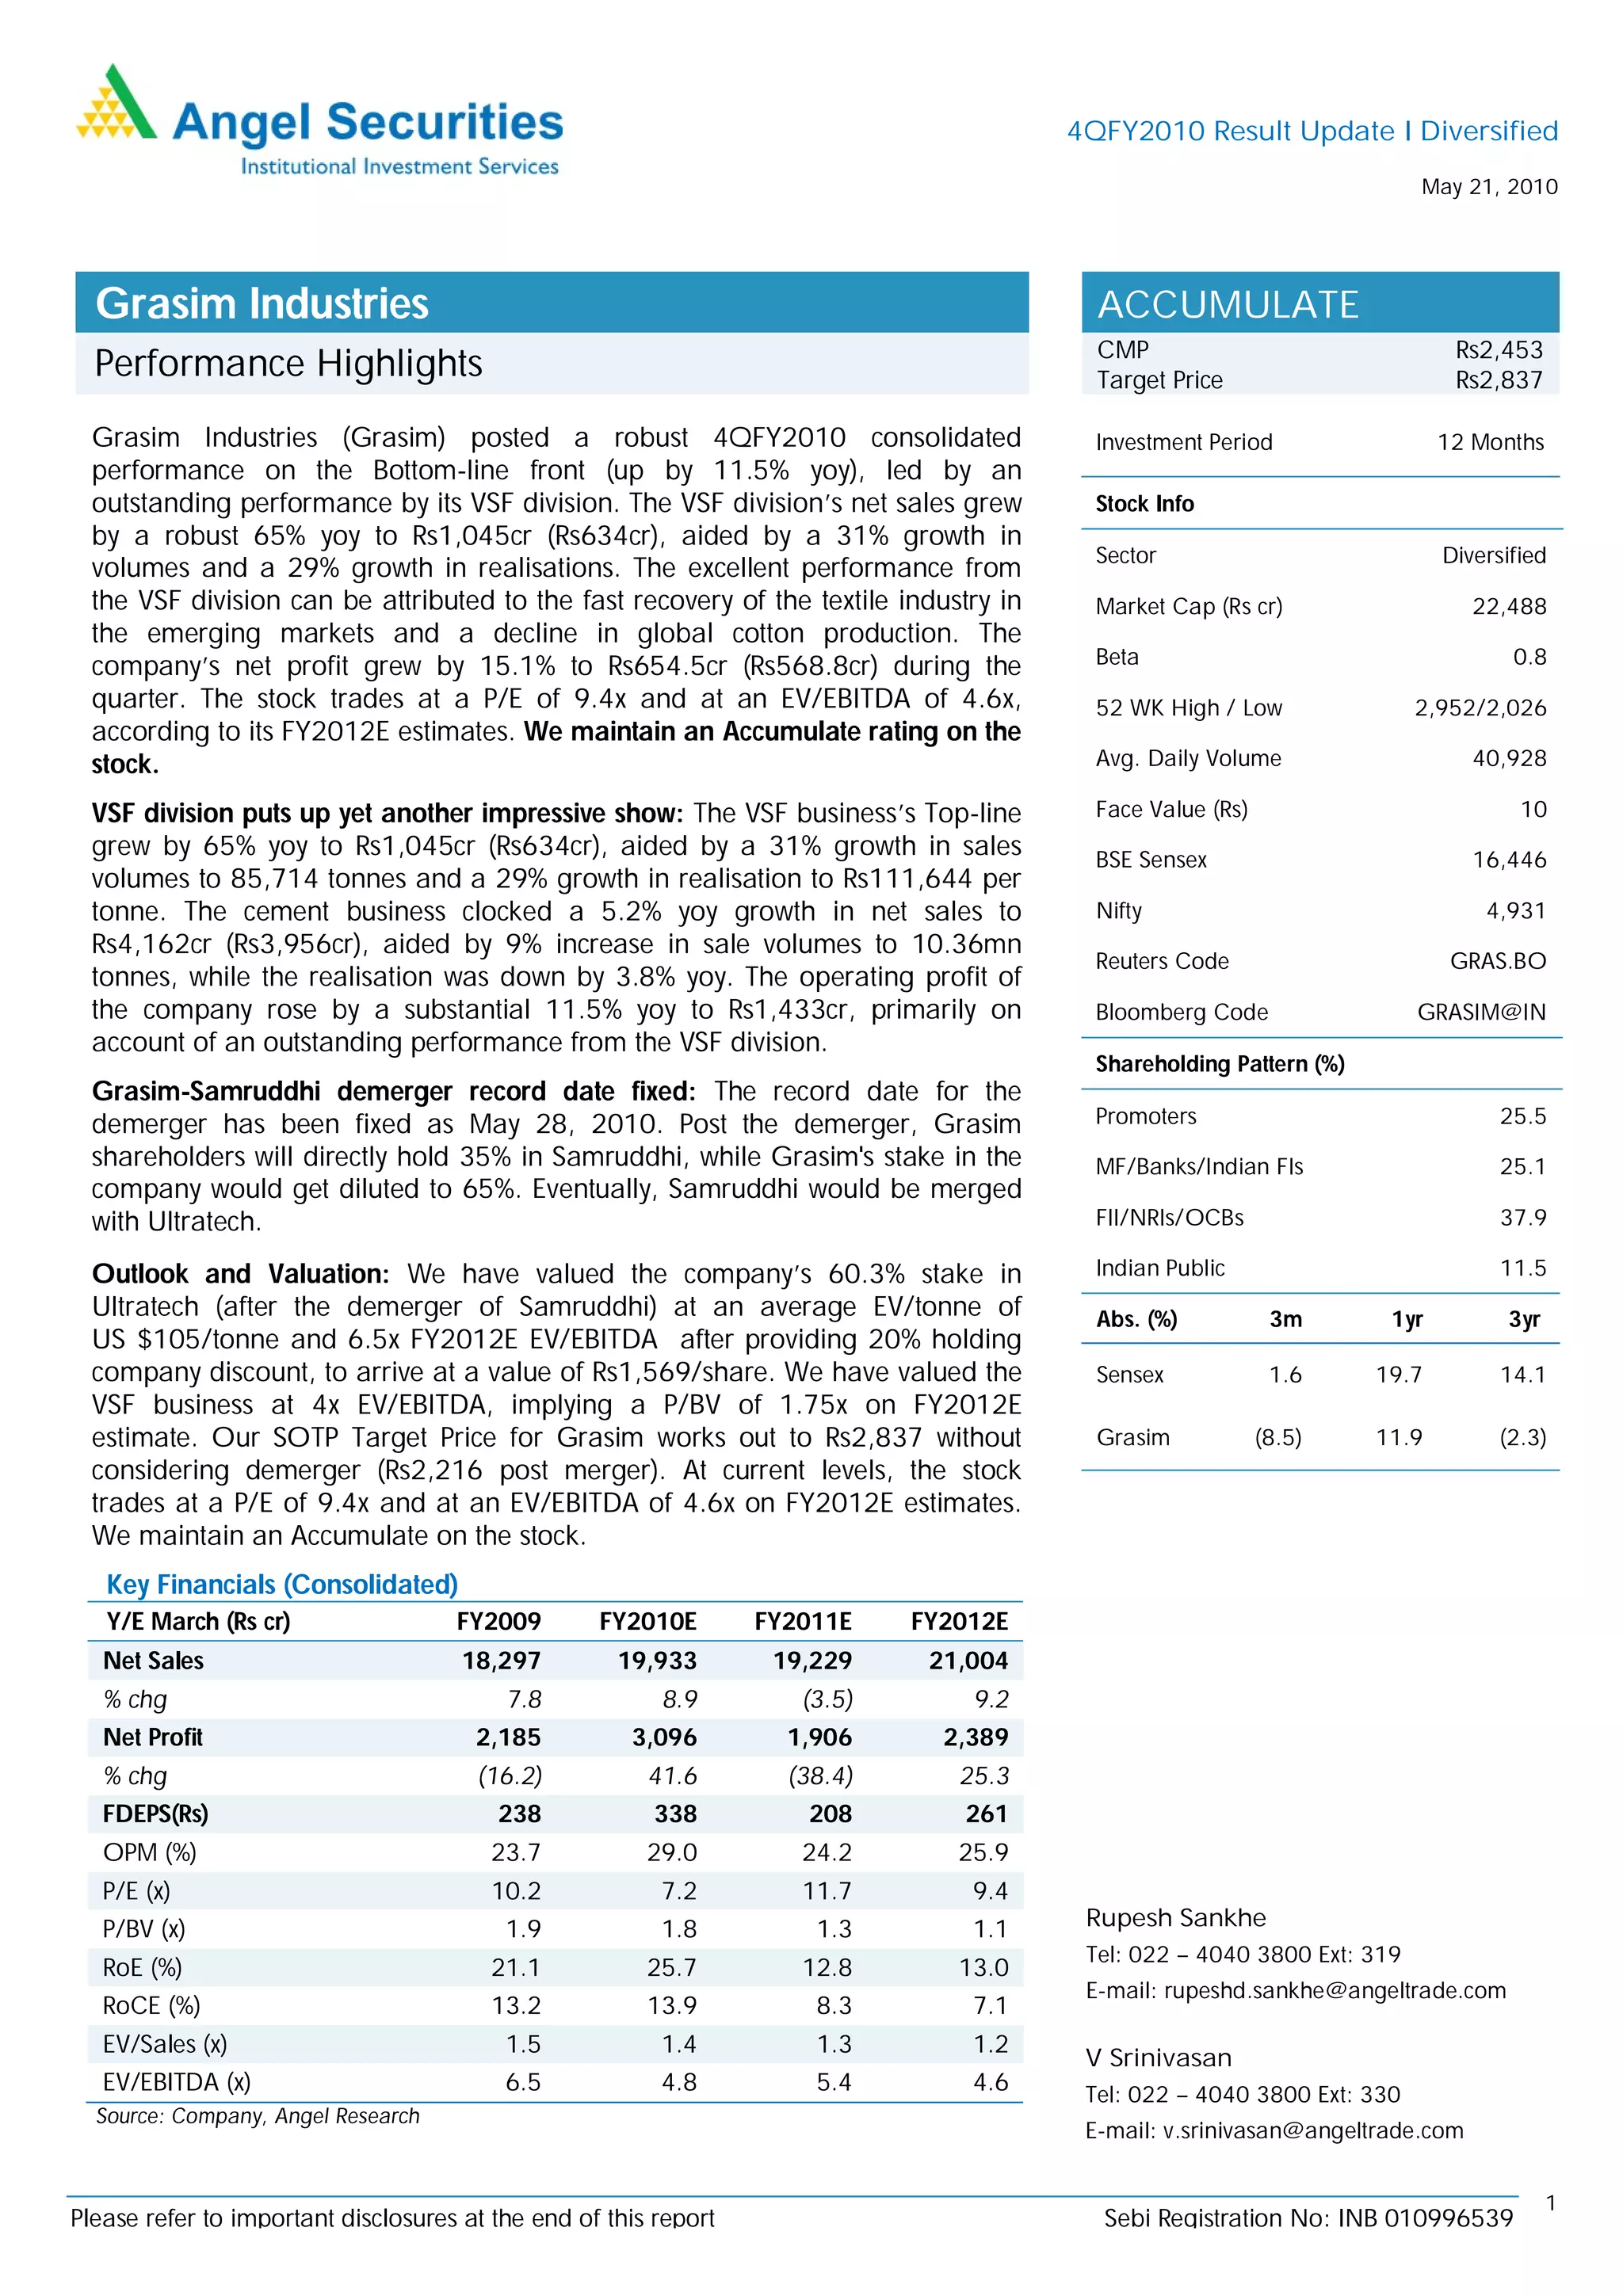
4QFY2010 Result Update I Diversified
                                                                                                                        May 21, 2010


  Grasim Industries                                                                      ACCUMULATE
                                                                                         CMP                                Rs2,453
  Performance Highlights                                                                 Target Price                       Rs2,837

  Grasim Industries (Grasim) posted a robust 4QFY2010 consolidated                       Investment Period                 12 Months
  performance on the Bottom-line front (up by 11.5% yoy), led by an
  outstanding performance by its VSF division. The VSF division’s net sales grew         Stock Info
  by a robust 65% yoy to Rs1,045cr (Rs634cr), aided by a 31% growth in
                                                                                         Sector                            Diversified
  volumes and a 29% growth in realisations. The excellent performance from
  the VSF division can be attributed to the fast recovery of the textile industry in     Market Cap (Rs cr)                   22,488
  the emerging markets and a decline in global cotton production. The
  company’s net profit grew by 15.1% to Rs654.5cr (Rs568.8cr) during the                 Beta                                     0.8
  quarter. The stock trades at a P/E of 9.4x and at an EV/EBITDA of 4.6x,                52 WK High / Low               2,952/2,026
  according to its FY2012E estimates. We maintain an Accumulate rating on the
  stock.                                                                                 Avg. Daily Volume                    40,928

  VSF division puts up yet another impressive show: The VSF business’s Top-line          Face Value (Rs)                           10
  grew by 65% yoy to Rs1,045cr (Rs634cr), aided by a 31% growth in sales                 BSE Sensex                           16,446
  volumes to 85,714 tonnes and a 29% growth in realisation to Rs111,644 per
  tonne. The cement business clocked a 5.2% yoy growth in net sales to                   Nifty                                 4,931
  Rs4,162cr (Rs3,956cr), aided by 9% increase in sale volumes to 10.36mn
                                                                                         Reuters Code                       GRAS.BO
  tonnes, while the realisation was down by 3.8% yoy. The operating profit of
  the company rose by a substantial 11.5% yoy to Rs1,433cr, primarily on                 Bloomberg Code                 GRASIM@IN
  account of an outstanding performance from the VSF division.
                                                                                         Shareholding Pattern (%)
  Grasim-Samruddhi demerger record date fixed: The record date for the
  demerger has been fixed as May 28, 2010. Post the demerger, Grasim                     Promoters                               25.5
  shareholders will directly hold 35% in Samruddhi, while Grasim's stake in the          MF/Banks/Indian FIs                     25.1
  company would get diluted to 65%. Eventually, Samruddhi would be merged
  with Ultratech.                                                                        FII/NRIs/OCBs                           37.9

  Outlook and Valuation: We have valued the company’s 60.3% stake in                     Indian Public                           11.5
  Ultratech (after the demerger of Samruddhi) at an average EV/tonne of                  Abs. (%)           3m       1yr         3yr
  US $105/tonne and 6.5x FY2012E EV/EBITDA after providing 20% holding
  company discount, to arrive at a value of Rs1,569/share. We have valued the            Sensex             1.6     19.7         14.1
  VSF business at 4x EV/EBITDA, implying a P/BV of 1.75x on FY2012E
  estimate. Our SOTP Target Price for Grasim works out to Rs2,837 without                Grasim            (8.5)    11.9         (2.3)
  considering demerger (Rs2,216 post merger). At current levels, the stock
  trades at a P/E of 9.4x and at an EV/EBITDA of 4.6x on FY2012E estimates.
  We maintain an Accumulate on the stock.
   Key Financials (Consolidated)
   Y/E March (Rs cr)                 FY2009        FY2010E        FY2011E    FY2012E
   Net Sales                          18,297         19,933        19,229     21,004
   % chg                                  7.8            8.9         (3.5)       9.2
   Net Profit                          2,185          3,096         1,906      2,389
   % chg                               (16.2)           41.6        (38.4)      25.3
   FDEPS(Rs)                             238             338         208        261
   OPM (%)                               23.7           29.0         24.2       25.9
   P/E (x)                               10.2            7.2         11.7        9.4
   P/BV (x)                               1.9            1.8          1.3        1.1    Rupesh Sankhe
                                                                                        Tel: 022 – 4040 3800 Ext: 319
   RoE (%)                               21.1           25.7         12.8       13.0
                                                                                        E-mail: rupeshd.sankhe@angeltrade.com
   RoCE (%)                              13.2           13.9          8.3        7.1
   EV/Sales (x)                           1.5            1.4          1.3        1.2
                                                                                        V Srinivasan
   EV/EBITDA (x)                          6.5            4.8          5.4        4.6    Tel: 022 – 4040 3800 Ext: 330
  Source: Company, Angel Research
                                                                                        E-mail: v.srinivasan@angeltrade.com


                                                                                                                                       1
Please refer to important disclosures at the end of this report                          Sebi Registration No: INB 010996539
Grasim I 4QFY2010 Result Update


               Exhibit 1: 4QFY10 Financial Performance
                Y/E March (Rs cr)                4QFY10    4QFY09    % chg     FY10       FY09    % chg
                Net Sales                         5,475     4,942      11    19,933     18,297      8.9
                Net Raw Material Costs            1,137     1,107       3      3,742     3,991    (6.2)
                (% of Sales)                       20.8      22.4               18.5      21.6
                Power & Fuel                      928.3     912.6      1.7     3,523     3,756    (6.2)
                (% of Sales)                       17.0      18.5               17.4      20.3
                Staff Costs                       273.7     229.7     19.2   1,058.6     953.6     11.0
                (% of Sales)                         5.0       4.6                5.2       5.2
                Freight & Forwarding              759.6     658.6     15.3     2,750     2,346     17.2
                (% of Sales)                       13.9      13.3               13.6      12.7
                Other Expenses                    942.8     748.4     26.0     3,073     2,919      5.3
                (% of Sales)                       17.2      15.1               15.2      15.8
                Total Expenditure                 4,042     3,656     10.5   14,147     13,966      1.3
                Operating Profit                  1,433     1,286     11.5     5,786     4,331     33.6
                OPM                                26.2      26.0     0.17         30     23.7     6.20
                Interest                           89.8      71.2     26.0     334.6     306.7      9.1
                Depreciation                      257.7     225.2     14.4     994.7     865.8     14.9
                Other Income                       80.5      56.9     41.6     923.7     462.8     99.6
                PBT (incl. Extr. Items)           1,167     1,046     11.5     5,381     3,622     48.6
                Extr. Income/(Expense)                 -         -             336.1          0
                PBT (excl. Extr. Items)           1,167     1,046     11.5     5,045     3,622     39.3
                Provision for Taxation            297.4     335.5              1,570     991.4     58.4
                (% of PBT)                         25.5      32.1               31.1      27.4
                MI & Profits of Associates        214.7     141.8              714.1     444.5
                Reported PAT                        655       569     15.1     3,097     2,186     41.6
                PATM                               12.0      11.5               15.3      11.8
                Equity Capital                     91.7      91.7               91.7      91.7
                EPS (Rs)                           71.4      62.0              337.6     238.5
               Source: Company, Angel Research


                Segmental Performance

                Cement Business

                The revenues of the cement division were higher by 5.2% yoy (on a consolidated
                basis) at Rs5,475cr (Rs4,942cr). The consolidated cement sales volume was up by
                9%, aided by a 21% growth in the offtake by the northern region. The sales volumes
                of Samruddhi (Demerged Cement unit) were higher by 11% yoy to 5.3mn tonnes
                (4.8mn tonnes), aided by a 31% growth in installed capacity to 25.7mtpa. The
                Cement realisations of Samruddhi declined by 2% yoy Rs3,3378/tonne. The OPM of
                Samruddhi stood at 27.6% for the quarter, down by 630bp yoy.


May 21, 2010                                                                                              2
Grasim I 4QFY2010 Result Update


               Exhibit 2: Samruddhi Cement Realisation (Per Tonne)

                  (Rs)
                  3,800

                  3,700                                                             3,689
                                                                            3,664
                  3,600

                  3,500
                                           3,446
                                                                 3,448
                  3,400                                                                      3,404
                                  3,366              3,382
                                                                                                     3,378
                  3,300

                  3,200

                  3,100
                           1QFY09     2QFY09     3QFY09    4QFY09    1QFY10     2QFY10   3QFY10   4QFY10


               Source: Company, Angel Research

               Cement capacity ramped-up by 6mtpa in FY2010

               Grasim’s cement capacity currently stands at 48.9mtpa. The company
               commissioned a 3.1mtpa plant at Kotputli in Rajasthan during the quarter. On a
               consolidated basis, the company expects to incur a total capex of Rs4,475cr over
               FY2011-13E, for expanding the grinding and evacuation facility, logistics
               infrastructure and captive power capacity. Additionally, the company plans to start a
               Brown field expansion of 10mn tonnes from 4QFY2011E, after completion of a
               detailed study.

               Exhibit 3: Grasim’s Cement Capacity (Consolidated)
                 (mtpa)
                  60                                                                              55.9
                                                                                     52.9
                                                                         48.9
                  50
                                                          41.6
                  40
                                          33.8
                           30.1
                  30

                  20

                  10

                   0
                           FY07           FY08            FY09           FY10        FY11E        FY12E

               Source: Company, Angel Research


May 21, 2010                                                                                                 3
Grasim I 4QFY2010 Result Update


               VSF Business: Posts stellar results once again

               The net revenue of the VSF business grew by 65% during the quarter. The Top-line
               growth was aided by a 31% growth in sales volumes to 85,714 tonnes and a 29%
               growth in realisation to Rs111,644 per tonne. The excellent performance from the
               VSF division can be attributed to the fast recovery of the textile industry in the
               emerging markets and a decline in the global cotton production. The operating
               margins of the VSF division grew by a whopping 1,810bp yoy to 34.3% (16.2%); yet,
               on a qoq basis, the OPM declined by 750bp, on account of an increase in input
               costs. The VSF division clocked a capacity utilisation of 97% during the quarter.

               The company is planning to invest Rs1,000cr towards setting up a new VSF plant
               with a capacity of 80,000tpa at Vilayat in Gujarat. The land for the project has been
               obtained and the environment clearance is in place. This plant is expected to be
               operational in FY2013E. The company is also doubling the capacity of its overseas
               Joint Venture in China to 70,000tpa by March 2010.

               Exhibit 4: VSF Division – Operating Profit Trend
                 (Rs cr)
                 500

                                                                                       403.7      394
                 400
                                                                               354.8


                 300

                           195.3                                      198.1
                 200
                                    147.7
                                                             109.7
                 100                              63.5


                    0
                           1QFY09   2QFY09       3QFY09     4QFY09   1QFY10   2QFY10   3QFY10    4QFY10

               Source: Company, Angel Research

               Chemical Business

               The net revenue of the Chemical Business declined by 2% yoy to Rs120.1cr during
               4QFY2010. The sales of this division declined despite a 15% increase in the sales
               volume to 59,585MT. However, the realisation declined by 20% to Rs16,767 per
               tonne. The division’s OPM declined by 260bp yoy to 20.5%.

                Exhibit 5: Grasim - Segment-wise Revenue (Consolidated)
                Rs cr                   4QFY10            4QFY09     yoy %      FY10      FY09      yoy %

                Fibre and Pulp               1,146           688     66.6      3,940     2,915      35.2
                Cement                       4,162         3,956       5.2    15,476    13,512      14.5
                Sponge Iron*                    -            157         -       111     1,008     (89.0)
                Chemicals                     120            123     (2.4)       493       523      (5.7)
                Textiles                         92           71     29.6        351       318      10.4
                Total (Gross)                5,475         4,942     10.8     20,195    18,496          9.2
                Source: Company, Angel Research; * Note: Unit was sold in 1QFY2010


May 21, 2010                                                                                              4
Grasim I 4QFY2010 Result Update


               Grasim-Samruddhi demerger record date fixed at May 28, 2010
               Grasim has decided to demerge its cement business to its subsidiary, Samruddhi
               Cement (Samruddhi), as part of a restructuring plan. The Samruddhi demerger is
               effective from May 18, 2010, while the record date for this spin-off is fixed at May
               28, 2010 (Ex-date May 26, 2010). As a result of the de-merger, Grasim
               shareholders will directly hold 35% in Samruddhi, while Grasim's stake would get
               diluted to 65% in the company. On completion of the de-merger, Samruddhi would
               be listed on the bourses in June 2010 to provide an exit opportunity to investors, as
               eventually Samruddhi would be merged with Ultratech wherein its shareholders will
               get four shares of Ultratech (face value of Rs10) for every seven shares (face value of
               Rs5). The merger is expected to be completed in July 2010.

               Change in Ultratech’s Shareholding Structure
               Post the merger of Samruddhi with Ultratech, Grasim’s stake in Ultratech will
               increase to 60.3% from 54.8%. The shareholders of Grasim will have a 19.1% direct
               stake in Ultratech. The stake of other minority shareholders in Ultratech will stand
               reduced to 20.6% from 45.2%.

               Computation of Grasim’s price after the demerger
               Based on the swap ratio (7:4) between Samruddhi and Ultratech, the per share
               value of Samruddhi stands at 0.57 share of Ultratech. Adjusted for the 35% direct
               shareholding of Grasim shareholders in Samruddhi, Grasim’s current value stands
               at Rs1,914 based on May 21, 2010 market cap (refer Exhibit 6).

               Exhibit 6: Estimated value per share of Grasim (Post Demerger)
                Total No. of Shares (cr) in Samruddhi - (a)                                   26.17
                     -      To be held by Grasim - (b)                                           17
                     -     To be held by Grasim’s Shareholders - (c)                           9.17

                Value per Share of Samruddhi w.r.t one share of Ultratech                       0.57
                Per share value of Samruddhi computes on the basis of Ultratech’s closing       539
                price of Rs946/share on May 21, 2010 - (d)

                Grasim Market Capitalisation as on May 21, 2010 @ Rs2,453 per Share          22,488
                (Rs cr) –(e)
                Value of shares in Samruddhi held by Grasim Shareholders (c)*(d) – (f)        4,945
                Grasim Market Capitalisation Post Demerger (e)-(f)                           17,543
                Total No. of shares in Grasim (cr)                                             9.17

                Estimated value per share of Grasim (Rs) (Post demerger)                      1,914


May 21, 2010                                                                                           5
Grasim I 4QFY2010 Result Update

                                           Outlook and Valuation

                                           In the northern market, the capacity utilisation remained healthy at 86% in April
                                           2010, due to Commonwealth-related spending. All the frontline states in the
                                           southern region, like Andhra Pradesh, Tamil Nadu and Karnataka, had been
                                           witnessing low demand in the recent months. The industry had also witnessed
                                           aggressive inter-regional stock movement, pending the expansions in the other
                                           regions, which exerted pressure on the prices and profitability. Overall, the cement
                                           companies have been reporting strong sales volumes, on the back of new capacities
                                           coming on stream, which has enabled most of the cement manufacturers to increase
                                           their total cement production. Cement capacity addition in India during FY2010
                                           stood at 27mn tonnes, taking the total capacity of the sector to around 252mtpa at
                                           the end of FY2010. Going ahead, we expect the industry to add around 41mn
                                           tonnes of capacity through FY2011-12E.

                                           All-India demand is expected to remain robust, but accelerated capacity additions
                                           and the stabilisation of new capacities would exert pressure on prices.

                                           VSF demand is likely to remain stable in the short to medium term, on account of
                                           improved demand due to a faster recovery in the textile sector in the emerging
                                           markets and a decline in global cotton production. However, an increase in input
                                           prices (pulp and sulphur) is expected to put pressure on the margins. VSF
                                           realisations could also witness downward pressures on account of large capacity
                                           expansions in China.

                                           We have valued the company’s 60.3% stake in Ultratech (after the demerger of
                                           Samruddhi) at an average EV/tonne of US $105/tonne and 6.5x FY2012E
                                           EV/EBITDA after providing 20% holding company discount, to arrive at a value of
                                           Rs1,569/share. We have valued the VSF business at 4x EV/EBITDA, implying a P/BV
                                           of 1.75x on FY2012E estimates. Our SOTP Target Price for Grasim works out to
                                           Rs2,837 without considering demerger (Rs2,216 post merger). At current levels, the
                                           stock trades at a P/E of 9.4x and at an EV/EBITDA of 4.6x on FY2012E estimates.
                                           We maintain an Accumulate on the stock.

 Exhibit 7: SOTP Valuation for Grasim (Without considering demerger)
 Segments                                                                                   Valuation Parameter   Per Share (Rs)
 Grasim’s stake in Ultratech (@ 20% holding company          Average of EV/Tonne @US$105/Tonne, EV/EBITDA of
                                                                                                                          1,569
 discount) (60.3%)                                                                            6.5x FY2012E
                                                             Average of EV/Tonne @US$105/Tonne, EV/EBITDA of
 Grasim shareholder’s holding in Ultratech (19.1%)                                                                          621
                                                                                               6.5x FY2012E
 VSF                                                                                  EV/EBITDA of 4x FY2012E               356
 Chemicals and Others                                                                 EV/EBITDA of 4x FY2012E                59
 Cash and Unquoted Investments                                                             P/BV of 1x FY2012E               231
 Per share value                                                                                                          2,837


Exhibit 8: SOTP Valuation for Grasim (Post -demerger)
 Segments                                                 Valuation Parameter                                     Per Share (Rs)
 Grasim’s stake in Ultratech (@ 20% holding company       Average of EV/Tonne @US$105/Tonne, EV/EBITDA of
                                                                                                                         1,569
 discount) (60.3%)                                        6.5x FY2012E
 VSF                                                      EV/EBITDA of 4x FY2012E                                          356
 Chemicals and Others                                     EV/EBITDA of 4x FY2012E                                            59
 Cash and Unquoted Investments                            P/BV of 1x FY2012E                                               231
 Per share value                                                                                                         2,216


May 21, 2010                                                                                                                   6
Grasim I 4QFY2010 Result Update


               Exhibit 8: 1-year forward EV/EBITDA Band
                (Rs cr)
                50,000


                40,000

                                                                                      7x
                30,000

                                                                                      5x
                20,000

                                                                                      3x
                10,000
                                                                                      1x
                      0
                      Apr-05          Apr-06     Apr-07    Apr-08     Apr-09      Apr-10

               Source: Company, Angel Research


May 21, 2010                                                                               7
Grasim I 4QFY2010 Result Update


               Profit & Loss Statement (consolidated) (Rs cr)
               Y/E March                         FY2007     FY2008      FY2009    FY2010    FY2011E    FY2012E
               Net Sales                         14,095     16,973      18,297    19,933     19,229     21,004
               Other operating income
               Total operating income            14,095     16,973      18,297    19,933     19,229     21,004
               % chg                               37.9        20.4         7.8       8.9      (3.5)        9.2
               Total Expenditure                 10,123     12,015      13,966    14,147     14,573     15,561
               Net Raw Materials                  2,929      3,603       3,991     3,742      4,030      4,472
               Other Mfg costs                    2,473      2,907       3,756     3,523      3,782      4,015
               Personnel                            673         845        954     1,059      1,101      1,252
               Other                              4,048      4,659       5,265     5,823      5,660      5,821
               EBITDA                             3,972      4,959       4,331     5,787      4,656      5,443
               % chg                               92.0        24.8      (12.7)     33.6      (19.5)      16.9
               (% of Net Sales)                    28.2        29.2       23.7      29.0       24.2       25.9
               Depreciation& Amortisation           610         670        866       995      1,164      1,210
               EBIT                               3,362      4,289       3,465     4,792      3,492      4,233
               % chg                              123.3        27.5      (19.2)     38.3      (27.1)      21.2
               (% of Net Sales)                    23.9        25.3       18.9      24.0       18.2       20.2
               Interest & other Charges             229         222        307       335        290        296
               Other Income                         318         463        463       923        546        525
               (% of PBT)                            9.2       10.2       12.8      17.2       14.6       11.8
               Share in profit of Associates         (0)          2         16          -          -          -
               Recurring PBT                      3,451      4,530       3,621     5,380      3,748      4,462
               % chg                              121.9        31.2      (20.1)     48.6      (30.3)      19.1
               Extraordinary Expense/(Inc.)            -      (282)           -         -          -          -
               PBT (reported)                     3,451      4,812       3,621     5,380      3,748      4,462
               Tax                                1,092      1,466         991     1,570      1,142      1,324
               (% of PBT)                          31.6        30.5       27.4      29.2       30.5       29.7
               PAT (reported)                     2,359      3,346       2,630     3,810      2,606      3,139
               Add: Share of earnings of
                                                      (0)          2                    -          -          -
               associate
               Less: Minority interest (MI)         392          457       444       714        700        750
               Prior period items
               PAT after MI (reported)            1,968         2,890    2,185     3,096      1,906      2,389
               ADJ. PAT                           1,968         2,607    2,185     3,096      1,906      2,389
               % chg                               89.9          32.5    (16.2)     41.6      (38.4)      25.3
               (% of Net Sales)                    14.0          15.4     11.9      15.5         9.9      11.4
               Basic EPS (Rs)                       215           315      238       338        208        261
               Fully Diluted EPS (Rs)               215           315      238       338        208        261
               % chg                               89.1          46.8    (24.4)     41.6      (38.4)      25.3


May 21, 2010                                                                                                  8
Grasim I 4QFY2010 Result Update


                Balance Sheet (consolidated)                                                              (Rs cr)
               Y/E March                            FY2007    FY2008     FY2009     FY2010    FY2011E    FY2012E
               SOURCES OF FUNDS
               Equity Share Capital                     92         92         92         92         92         92
               Preference Capital                        6         35         57         57         57         57
               Reserves& Surplus                     6,464      9,017     11,421     12,382     17,155     19,374
               Shareholders Funds                    6,562      9,144     11,570     12,531     17,305     19,523
               Minority Interest                       859      1,276      1,670      3,754      3,754      3,754
               Total Loans                           4,873      5,577      5,916      5,599      4,499      3,649
               Deferred Tax Liability                1,153      1,158      1,592      2,005      2,005      2,005
               Total Liabilities                    13,447     17,154     20,748     23,889     27,563     28,931
               APPLICATION OF FUNDS
               Gross Block                          12,528     13,729     19,062     21,618     22,818     23,718
               Less: Acc. Depreciation               6,012      6,340      6,825      7,820      8,984     10,193
               Net Block                             6,515      7,389     12,237     13,798     13,834     13,525
               Capital Work-in-Progress              1,957      5,534      1,982      1,021      2,821      4,921
               Goodwill                              1,844      1,991      2,001      2,001      2,001      2,001
               Investments                           2,272      1,661      3,563      6,675      6,675      6,675
               Current Assets                        3,301      4,258      4,534      4,360      6,132      5,943
               Cash                                    369        290        227        237      1,669      1,152
               Loans & Advances                        748      1,205      1,261      1,261      1,261      1,261
               Other                                 2,184      2,763      3,046      2,862      3,202      3,530
               Current liabilities                   2,443      3,678      3,568      3,966      3,901      4,134
               Net Current Assets                      858        580        966        394      2,231      1,809
               Mis. Exp. not written off                 -          -          0          0          0          0
               Total Assets                         13,447     17,154     20,748     23,889     27,563     28,931


               Cash Flow Statement (consolidated) (Rs cr)
               Y/E March                          FY2007     FY2008     FY2009     FY2010E    FY2011E    FY2012E
               Profit before tax                   3,451      4,812      3,621       5,380      3,748      4,462
               Depreciation                           610       670        866         995      1,164      1,210
               Change in Working Capital              (31)      (56)       420         887      2,289       (479)
               Less: Other income                     318       463        463         923        546         525
               Direct taxes paid                   1,092      1,466        991       1,570      1,142      1,324
               Cash Flow from Operations           2,620      3,497      3,453       4,769      5,513      3,344
               (Inc)/ Decin Fixed Assets          (2,553)    (4,777)    (1,782)     (1,595)    (3,000)    (3,000)
               (Inc)/ Dec in Investments            (920)       611     (1,902)     (3,112)          -          -
               (Inc)/ Dec in loans and advances
               Other income                          318        463         463         923       546         525
               Cash Flow from Investing           (3,155)    (3,703)    (3,222)     (3,785)    (2,454)    (2,475)
               Issue of Equity                          -          -           -          -          -          -
               Inc./(Dec.) in loans                1,190        704         339       (317)    (1,100)      (850)
               Dividend Paid (Incl. Tax)             294        355         327         323       237         240
               Others                                229        222         307         335       290         296
               Cash Flow from Financing              667        127       (295)       (975)    (1,627)    (1,386)
               Inc./(Dec.) in Cash                   132        (79)        (63)         10     1,432       (517)
               Opening Cash balances                 237        369         290         227       237      1,669
               Closing Cash balances                 369        290         227         237     1,669      1,152


May 21, 2010                                                                                                    9
Grasim I 4QFY2010 Result Update


               Key Ratios
               Y/E March                         FY2007   FY2008   FY2009    FY2010    FY2011E   FY2012E
               Valuation Ratio (x)
               P/E (on FDEPS)                      11.4      7.8     10.3        7.3      11.8       9.4
               P/CEPS                               7.6      5.6      6.4        4.7       6.0       5.2
               P/BV                                 3.4      2.5      1.9        1.8       1.3       1.2
               Dividend yield (%)                   1.3      1.6      1.5        1.4       1.1       1.1
               EV/Sales                             1.9      1.6      1.5        1.4       1.3       1.2
               EV/EBITDA                            6.8      5.6      6.5        4.8       5.4       4.6
               EV / Total Assets                    2.0      1.6      1.4        1.2       0.9       0.9
               Per Share Data (Rs)
               EPS (Basic)                        214.6    315.2     238.3     337.6     207.9     260.5
               EPS (fully diluted)                214.6    315.2     238.3     337.6     207.9     260.5
               Cash EPS                           323.8    438.1     381.2     524.0     411.2     474.2
               DPS                                 32.1     38.8      35.7      35.2      25.9      26.2
               Book Value                         715.7    997.3   1,261.9   1,366.7   1,887.3   2,129.3
               Dupont Analysis
               EBIT margin                         23.9     25.3     18.9      24.0       18.2      20.2
               Tax retention ratio                 68.4     69.5     72.6      70.8       69.5      70.3
               Asset turnover (x)                   1.2      1.1      1.0       0.9        0.8       0.8
               ROIC (Post-tax)                     20.0     19.9     13.5      15.4        9.8      11.1
               Cost of Debt (Post Tax)              3.7      3.0      3.9       4.1        4.0       5.1
               Leverage (x)                         0.7      0.6      0.5       0.5        0.3       0.1
               Operating ROE                       31.4     30.6     18.6      20.5       11.5      12.0
               Returns (%)
               ROCE (Pre-tax)                      28.4     28.0     18.3      21.5       13.6      15.0
               Angel ROIC (Pre-tax)                39.5     46.1     26.8      25.8       16.7      20.2
               ROE                                 34.5     33.2     21.1      25.7       12.8      13.0
               Turnover ratios (x)
               Asset Turnover (Gross Block)         1.2      1.3       1.1       1.0       0.9       0.9
               Inventory / Sales (days)             33       33        40        39        39        38
               Receivables (days)                   18       20        18        18        22        21
               Working capital cycle (ex-cash)
                                                    12        8        10         8         7        11
               (days)
               Solvency ratios (x)
               Net debt to equity                   0.7      0.6       0.5       0.4       0.2       0.1
               Net debt to EBITDA                   1.1      1.1       1.3       0.9       0.6       0.5
               Interest Coverage (EBIT /
                                                   14.7     19.3     11.3      14.3       12.0      14.3
               Interest)


May 21, 2010                                                                                           10
Grasim I 4QFY2010 Result Update

Research Team Tel: 022-4040 3800                                          E-mail: research@angeltrade.com                                       Website: www.angeltrade.com


DISCLAIMER

This document is solely for the personal information of the recipient, and must not be singularly used as the basis of any investment decision. Nothing in this
document should be construed as investment or financial advice. Each recipient of this document should make such investigations as they deem necessary to
arrive at an independent evaluation of an investment in the securities of the companies referred to in this document (including the merits and risks involved),
and should consult their own advisors to determine the merits and risks of such an investment.

Angel Securities Limited, its affiliates, directors, its proprietary trading and investment businesses may, from time to time, make investment decisions that are
inconsistent with or contradictory to the recommendations expressed herein. The views contained in this document are those of the analyst, and the company
may or may not subscribe to all the views expressed within.

Reports based on technical and derivative analysis center on studying charts of a stock's price movement, outstanding positions and trading volume, as
opposed to focusing on a company's fundamentals and, as such, may not match with a report on a company's fundamentals.

The information in this document has been printed on the basis of publicly available information, internal data and other reliable sources believed to be true,
and are for general guidance only. Angel Securities Limited has not independently verified all the information contained within this document. Accordingly,
we cannot testify, nor make any representation or warranty, express or implied, to the accuracy, contents or data contained within this document. While
Angel Securities Limited endeavours to update on a reasonable basis the information discussed in this material, there may be regulatory, compliance, or
other reasons that prevent us from doing so.

This document is being supplied to you solely for your information, and its contents, information or data may not be reproduced, redistributed or passed on,
directly or indirectly.

Angel Securities Limited and its affiliates may seek to provide or have engaged in providing corporate finance, investment banking or other advisory services
in a merger or specific transaction to the companies referred to in this report, as on the date of this report or in the past.

Neither Angel Securities Limited nor its directors, employees and affiliates shall be liable for any loss or damage that may arise from or in connection with the
use of this information.
Note: Please refer to the important `Stock Holding Disclosure' report on the Angel website (Research Section).


 Disclosure of Interest Statement                                                                          Grasim Industries
 1.    Analyst ownership of the stock                                                                               No
 2.    Angel and its Group companies ownership of the stock                                                         Yes
 3.    Angel and its Group companies’ Directors ownership of the stock                                              No
 4.    Broking relationship with company covered                                                                    No
 Note: We have not considered any Exposure below Rs 1 lakh for Angel and its Group companies.


                                Address: Acme Plaza, ‘A’ Wing, 3rd Floor, M.V. Road, Opp. Sangam Cinema, Andheri (E), Mumbai - 400 059.
                                                                    Tel : (022) 3952 4568 / 4040 3800


    Angel Broking Ltd: BSE Sebi Regn No : INB 010996539 / CDSL Regn No: IN - DP - CDSL - 234 - 2004 / PMS Regn Code: PM/INP000001546 Angel Securities Ltd:BSE: INB010994639/INF010994639 NSE:
    INB230994635/INF230994635 Membership numbers: BSE 028/NSE:09946
    Angel Capital & Debt Market Ltd: INB 231279838 / NSE FNO: INF 231279838 / NSE Member code -12798 Angel Commodities Broking (P) Ltd: MCX Member ID: 12685 / FMC Regn No: MCX / TCM /
    CORP / 0037 NCDEX : Member ID 00220 / FMC Regn No: NCDEX / TCM / CORP / 0302


May 21, 2010                                                                                                                                                                              11

Grasim Result Update 4qfy2010 - 210510

  • 1.
    4QFY2010 Result UpdateI Diversified May 21, 2010 Grasim Industries ACCUMULATE CMP Rs2,453 Performance Highlights Target Price Rs2,837 Grasim Industries (Grasim) posted a robust 4QFY2010 consolidated Investment Period 12 Months performance on the Bottom-line front (up by 11.5% yoy), led by an outstanding performance by its VSF division. The VSF division’s net sales grew Stock Info by a robust 65% yoy to Rs1,045cr (Rs634cr), aided by a 31% growth in Sector Diversified volumes and a 29% growth in realisations. The excellent performance from the VSF division can be attributed to the fast recovery of the textile industry in Market Cap (Rs cr) 22,488 the emerging markets and a decline in global cotton production. The company’s net profit grew by 15.1% to Rs654.5cr (Rs568.8cr) during the Beta 0.8 quarter. The stock trades at a P/E of 9.4x and at an EV/EBITDA of 4.6x, 52 WK High / Low 2,952/2,026 according to its FY2012E estimates. We maintain an Accumulate rating on the stock. Avg. Daily Volume 40,928 VSF division puts up yet another impressive show: The VSF business’s Top-line Face Value (Rs) 10 grew by 65% yoy to Rs1,045cr (Rs634cr), aided by a 31% growth in sales BSE Sensex 16,446 volumes to 85,714 tonnes and a 29% growth in realisation to Rs111,644 per tonne. The cement business clocked a 5.2% yoy growth in net sales to Nifty 4,931 Rs4,162cr (Rs3,956cr), aided by 9% increase in sale volumes to 10.36mn Reuters Code GRAS.BO tonnes, while the realisation was down by 3.8% yoy. The operating profit of the company rose by a substantial 11.5% yoy to Rs1,433cr, primarily on Bloomberg Code GRASIM@IN account of an outstanding performance from the VSF division. Shareholding Pattern (%) Grasim-Samruddhi demerger record date fixed: The record date for the demerger has been fixed as May 28, 2010. Post the demerger, Grasim Promoters 25.5 shareholders will directly hold 35% in Samruddhi, while Grasim's stake in the MF/Banks/Indian FIs 25.1 company would get diluted to 65%. Eventually, Samruddhi would be merged with Ultratech. FII/NRIs/OCBs 37.9 Outlook and Valuation: We have valued the company’s 60.3% stake in Indian Public 11.5 Ultratech (after the demerger of Samruddhi) at an average EV/tonne of Abs. (%) 3m 1yr 3yr US $105/tonne and 6.5x FY2012E EV/EBITDA after providing 20% holding company discount, to arrive at a value of Rs1,569/share. We have valued the Sensex 1.6 19.7 14.1 VSF business at 4x EV/EBITDA, implying a P/BV of 1.75x on FY2012E estimate. Our SOTP Target Price for Grasim works out to Rs2,837 without Grasim (8.5) 11.9 (2.3) considering demerger (Rs2,216 post merger). At current levels, the stock trades at a P/E of 9.4x and at an EV/EBITDA of 4.6x on FY2012E estimates. We maintain an Accumulate on the stock. Key Financials (Consolidated) Y/E March (Rs cr) FY2009 FY2010E FY2011E FY2012E Net Sales 18,297 19,933 19,229 21,004 % chg 7.8 8.9 (3.5) 9.2 Net Profit 2,185 3,096 1,906 2,389 % chg (16.2) 41.6 (38.4) 25.3 FDEPS(Rs) 238 338 208 261 OPM (%) 23.7 29.0 24.2 25.9 P/E (x) 10.2 7.2 11.7 9.4 P/BV (x) 1.9 1.8 1.3 1.1 Rupesh Sankhe Tel: 022 – 4040 3800 Ext: 319 RoE (%) 21.1 25.7 12.8 13.0 E-mail: rupeshd.sankhe@angeltrade.com RoCE (%) 13.2 13.9 8.3 7.1 EV/Sales (x) 1.5 1.4 1.3 1.2 V Srinivasan EV/EBITDA (x) 6.5 4.8 5.4 4.6 Tel: 022 – 4040 3800 Ext: 330 Source: Company, Angel Research E-mail: v.srinivasan@angeltrade.com 1 Please refer to important disclosures at the end of this report Sebi Registration No: INB 010996539
  • 2.
    Grasim I 4QFY2010Result Update Exhibit 1: 4QFY10 Financial Performance Y/E March (Rs cr) 4QFY10 4QFY09 % chg FY10 FY09 % chg Net Sales 5,475 4,942 11 19,933 18,297 8.9 Net Raw Material Costs 1,137 1,107 3 3,742 3,991 (6.2) (% of Sales) 20.8 22.4 18.5 21.6 Power & Fuel 928.3 912.6 1.7 3,523 3,756 (6.2) (% of Sales) 17.0 18.5 17.4 20.3 Staff Costs 273.7 229.7 19.2 1,058.6 953.6 11.0 (% of Sales) 5.0 4.6 5.2 5.2 Freight & Forwarding 759.6 658.6 15.3 2,750 2,346 17.2 (% of Sales) 13.9 13.3 13.6 12.7 Other Expenses 942.8 748.4 26.0 3,073 2,919 5.3 (% of Sales) 17.2 15.1 15.2 15.8 Total Expenditure 4,042 3,656 10.5 14,147 13,966 1.3 Operating Profit 1,433 1,286 11.5 5,786 4,331 33.6 OPM 26.2 26.0 0.17 30 23.7 6.20 Interest 89.8 71.2 26.0 334.6 306.7 9.1 Depreciation 257.7 225.2 14.4 994.7 865.8 14.9 Other Income 80.5 56.9 41.6 923.7 462.8 99.6 PBT (incl. Extr. Items) 1,167 1,046 11.5 5,381 3,622 48.6 Extr. Income/(Expense) - - 336.1 0 PBT (excl. Extr. Items) 1,167 1,046 11.5 5,045 3,622 39.3 Provision for Taxation 297.4 335.5 1,570 991.4 58.4 (% of PBT) 25.5 32.1 31.1 27.4 MI & Profits of Associates 214.7 141.8 714.1 444.5 Reported PAT 655 569 15.1 3,097 2,186 41.6 PATM 12.0 11.5 15.3 11.8 Equity Capital 91.7 91.7 91.7 91.7 EPS (Rs) 71.4 62.0 337.6 238.5 Source: Company, Angel Research Segmental Performance Cement Business The revenues of the cement division were higher by 5.2% yoy (on a consolidated basis) at Rs5,475cr (Rs4,942cr). The consolidated cement sales volume was up by 9%, aided by a 21% growth in the offtake by the northern region. The sales volumes of Samruddhi (Demerged Cement unit) were higher by 11% yoy to 5.3mn tonnes (4.8mn tonnes), aided by a 31% growth in installed capacity to 25.7mtpa. The Cement realisations of Samruddhi declined by 2% yoy Rs3,3378/tonne. The OPM of Samruddhi stood at 27.6% for the quarter, down by 630bp yoy. May 21, 2010 2
  • 3.
    Grasim I 4QFY2010Result Update Exhibit 2: Samruddhi Cement Realisation (Per Tonne) (Rs) 3,800 3,700 3,689 3,664 3,600 3,500 3,446 3,448 3,400 3,404 3,366 3,382 3,378 3,300 3,200 3,100 1QFY09 2QFY09 3QFY09 4QFY09 1QFY10 2QFY10 3QFY10 4QFY10 Source: Company, Angel Research Cement capacity ramped-up by 6mtpa in FY2010 Grasim’s cement capacity currently stands at 48.9mtpa. The company commissioned a 3.1mtpa plant at Kotputli in Rajasthan during the quarter. On a consolidated basis, the company expects to incur a total capex of Rs4,475cr over FY2011-13E, for expanding the grinding and evacuation facility, logistics infrastructure and captive power capacity. Additionally, the company plans to start a Brown field expansion of 10mn tonnes from 4QFY2011E, after completion of a detailed study. Exhibit 3: Grasim’s Cement Capacity (Consolidated) (mtpa) 60 55.9 52.9 48.9 50 41.6 40 33.8 30.1 30 20 10 0 FY07 FY08 FY09 FY10 FY11E FY12E Source: Company, Angel Research May 21, 2010 3
  • 4.
    Grasim I 4QFY2010Result Update VSF Business: Posts stellar results once again The net revenue of the VSF business grew by 65% during the quarter. The Top-line growth was aided by a 31% growth in sales volumes to 85,714 tonnes and a 29% growth in realisation to Rs111,644 per tonne. The excellent performance from the VSF division can be attributed to the fast recovery of the textile industry in the emerging markets and a decline in the global cotton production. The operating margins of the VSF division grew by a whopping 1,810bp yoy to 34.3% (16.2%); yet, on a qoq basis, the OPM declined by 750bp, on account of an increase in input costs. The VSF division clocked a capacity utilisation of 97% during the quarter. The company is planning to invest Rs1,000cr towards setting up a new VSF plant with a capacity of 80,000tpa at Vilayat in Gujarat. The land for the project has been obtained and the environment clearance is in place. This plant is expected to be operational in FY2013E. The company is also doubling the capacity of its overseas Joint Venture in China to 70,000tpa by March 2010. Exhibit 4: VSF Division – Operating Profit Trend (Rs cr) 500 403.7 394 400 354.8 300 195.3 198.1 200 147.7 109.7 100 63.5 0 1QFY09 2QFY09 3QFY09 4QFY09 1QFY10 2QFY10 3QFY10 4QFY10 Source: Company, Angel Research Chemical Business The net revenue of the Chemical Business declined by 2% yoy to Rs120.1cr during 4QFY2010. The sales of this division declined despite a 15% increase in the sales volume to 59,585MT. However, the realisation declined by 20% to Rs16,767 per tonne. The division’s OPM declined by 260bp yoy to 20.5%. Exhibit 5: Grasim - Segment-wise Revenue (Consolidated) Rs cr 4QFY10 4QFY09 yoy % FY10 FY09 yoy % Fibre and Pulp 1,146 688 66.6 3,940 2,915 35.2 Cement 4,162 3,956 5.2 15,476 13,512 14.5 Sponge Iron* - 157 - 111 1,008 (89.0) Chemicals 120 123 (2.4) 493 523 (5.7) Textiles 92 71 29.6 351 318 10.4 Total (Gross) 5,475 4,942 10.8 20,195 18,496 9.2 Source: Company, Angel Research; * Note: Unit was sold in 1QFY2010 May 21, 2010 4
  • 5.
    Grasim I 4QFY2010Result Update Grasim-Samruddhi demerger record date fixed at May 28, 2010 Grasim has decided to demerge its cement business to its subsidiary, Samruddhi Cement (Samruddhi), as part of a restructuring plan. The Samruddhi demerger is effective from May 18, 2010, while the record date for this spin-off is fixed at May 28, 2010 (Ex-date May 26, 2010). As a result of the de-merger, Grasim shareholders will directly hold 35% in Samruddhi, while Grasim's stake would get diluted to 65% in the company. On completion of the de-merger, Samruddhi would be listed on the bourses in June 2010 to provide an exit opportunity to investors, as eventually Samruddhi would be merged with Ultratech wherein its shareholders will get four shares of Ultratech (face value of Rs10) for every seven shares (face value of Rs5). The merger is expected to be completed in July 2010. Change in Ultratech’s Shareholding Structure Post the merger of Samruddhi with Ultratech, Grasim’s stake in Ultratech will increase to 60.3% from 54.8%. The shareholders of Grasim will have a 19.1% direct stake in Ultratech. The stake of other minority shareholders in Ultratech will stand reduced to 20.6% from 45.2%. Computation of Grasim’s price after the demerger Based on the swap ratio (7:4) between Samruddhi and Ultratech, the per share value of Samruddhi stands at 0.57 share of Ultratech. Adjusted for the 35% direct shareholding of Grasim shareholders in Samruddhi, Grasim’s current value stands at Rs1,914 based on May 21, 2010 market cap (refer Exhibit 6). Exhibit 6: Estimated value per share of Grasim (Post Demerger) Total No. of Shares (cr) in Samruddhi - (a) 26.17 - To be held by Grasim - (b) 17 - To be held by Grasim’s Shareholders - (c) 9.17 Value per Share of Samruddhi w.r.t one share of Ultratech 0.57 Per share value of Samruddhi computes on the basis of Ultratech’s closing 539 price of Rs946/share on May 21, 2010 - (d) Grasim Market Capitalisation as on May 21, 2010 @ Rs2,453 per Share 22,488 (Rs cr) –(e) Value of shares in Samruddhi held by Grasim Shareholders (c)*(d) – (f) 4,945 Grasim Market Capitalisation Post Demerger (e)-(f) 17,543 Total No. of shares in Grasim (cr) 9.17 Estimated value per share of Grasim (Rs) (Post demerger) 1,914 May 21, 2010 5
  • 6.
    Grasim I 4QFY2010Result Update Outlook and Valuation In the northern market, the capacity utilisation remained healthy at 86% in April 2010, due to Commonwealth-related spending. All the frontline states in the southern region, like Andhra Pradesh, Tamil Nadu and Karnataka, had been witnessing low demand in the recent months. The industry had also witnessed aggressive inter-regional stock movement, pending the expansions in the other regions, which exerted pressure on the prices and profitability. Overall, the cement companies have been reporting strong sales volumes, on the back of new capacities coming on stream, which has enabled most of the cement manufacturers to increase their total cement production. Cement capacity addition in India during FY2010 stood at 27mn tonnes, taking the total capacity of the sector to around 252mtpa at the end of FY2010. Going ahead, we expect the industry to add around 41mn tonnes of capacity through FY2011-12E. All-India demand is expected to remain robust, but accelerated capacity additions and the stabilisation of new capacities would exert pressure on prices. VSF demand is likely to remain stable in the short to medium term, on account of improved demand due to a faster recovery in the textile sector in the emerging markets and a decline in global cotton production. However, an increase in input prices (pulp and sulphur) is expected to put pressure on the margins. VSF realisations could also witness downward pressures on account of large capacity expansions in China. We have valued the company’s 60.3% stake in Ultratech (after the demerger of Samruddhi) at an average EV/tonne of US $105/tonne and 6.5x FY2012E EV/EBITDA after providing 20% holding company discount, to arrive at a value of Rs1,569/share. We have valued the VSF business at 4x EV/EBITDA, implying a P/BV of 1.75x on FY2012E estimates. Our SOTP Target Price for Grasim works out to Rs2,837 without considering demerger (Rs2,216 post merger). At current levels, the stock trades at a P/E of 9.4x and at an EV/EBITDA of 4.6x on FY2012E estimates. We maintain an Accumulate on the stock. Exhibit 7: SOTP Valuation for Grasim (Without considering demerger) Segments Valuation Parameter Per Share (Rs) Grasim’s stake in Ultratech (@ 20% holding company Average of EV/Tonne @US$105/Tonne, EV/EBITDA of 1,569 discount) (60.3%) 6.5x FY2012E Average of EV/Tonne @US$105/Tonne, EV/EBITDA of Grasim shareholder’s holding in Ultratech (19.1%) 621 6.5x FY2012E VSF EV/EBITDA of 4x FY2012E 356 Chemicals and Others EV/EBITDA of 4x FY2012E 59 Cash and Unquoted Investments P/BV of 1x FY2012E 231 Per share value 2,837 Exhibit 8: SOTP Valuation for Grasim (Post -demerger) Segments Valuation Parameter Per Share (Rs) Grasim’s stake in Ultratech (@ 20% holding company Average of EV/Tonne @US$105/Tonne, EV/EBITDA of 1,569 discount) (60.3%) 6.5x FY2012E VSF EV/EBITDA of 4x FY2012E 356 Chemicals and Others EV/EBITDA of 4x FY2012E 59 Cash and Unquoted Investments P/BV of 1x FY2012E 231 Per share value 2,216 May 21, 2010 6
  • 7.
    Grasim I 4QFY2010Result Update Exhibit 8: 1-year forward EV/EBITDA Band (Rs cr) 50,000 40,000 7x 30,000 5x 20,000 3x 10,000 1x 0 Apr-05 Apr-06 Apr-07 Apr-08 Apr-09 Apr-10 Source: Company, Angel Research May 21, 2010 7
  • 8.
    Grasim I 4QFY2010Result Update Profit & Loss Statement (consolidated) (Rs cr) Y/E March FY2007 FY2008 FY2009 FY2010 FY2011E FY2012E Net Sales 14,095 16,973 18,297 19,933 19,229 21,004 Other operating income Total operating income 14,095 16,973 18,297 19,933 19,229 21,004 % chg 37.9 20.4 7.8 8.9 (3.5) 9.2 Total Expenditure 10,123 12,015 13,966 14,147 14,573 15,561 Net Raw Materials 2,929 3,603 3,991 3,742 4,030 4,472 Other Mfg costs 2,473 2,907 3,756 3,523 3,782 4,015 Personnel 673 845 954 1,059 1,101 1,252 Other 4,048 4,659 5,265 5,823 5,660 5,821 EBITDA 3,972 4,959 4,331 5,787 4,656 5,443 % chg 92.0 24.8 (12.7) 33.6 (19.5) 16.9 (% of Net Sales) 28.2 29.2 23.7 29.0 24.2 25.9 Depreciation& Amortisation 610 670 866 995 1,164 1,210 EBIT 3,362 4,289 3,465 4,792 3,492 4,233 % chg 123.3 27.5 (19.2) 38.3 (27.1) 21.2 (% of Net Sales) 23.9 25.3 18.9 24.0 18.2 20.2 Interest & other Charges 229 222 307 335 290 296 Other Income 318 463 463 923 546 525 (% of PBT) 9.2 10.2 12.8 17.2 14.6 11.8 Share in profit of Associates (0) 2 16 - - - Recurring PBT 3,451 4,530 3,621 5,380 3,748 4,462 % chg 121.9 31.2 (20.1) 48.6 (30.3) 19.1 Extraordinary Expense/(Inc.) - (282) - - - - PBT (reported) 3,451 4,812 3,621 5,380 3,748 4,462 Tax 1,092 1,466 991 1,570 1,142 1,324 (% of PBT) 31.6 30.5 27.4 29.2 30.5 29.7 PAT (reported) 2,359 3,346 2,630 3,810 2,606 3,139 Add: Share of earnings of (0) 2 - - - associate Less: Minority interest (MI) 392 457 444 714 700 750 Prior period items PAT after MI (reported) 1,968 2,890 2,185 3,096 1,906 2,389 ADJ. PAT 1,968 2,607 2,185 3,096 1,906 2,389 % chg 89.9 32.5 (16.2) 41.6 (38.4) 25.3 (% of Net Sales) 14.0 15.4 11.9 15.5 9.9 11.4 Basic EPS (Rs) 215 315 238 338 208 261 Fully Diluted EPS (Rs) 215 315 238 338 208 261 % chg 89.1 46.8 (24.4) 41.6 (38.4) 25.3 May 21, 2010 8
  • 9.
    Grasim I 4QFY2010Result Update Balance Sheet (consolidated) (Rs cr) Y/E March FY2007 FY2008 FY2009 FY2010 FY2011E FY2012E SOURCES OF FUNDS Equity Share Capital 92 92 92 92 92 92 Preference Capital 6 35 57 57 57 57 Reserves& Surplus 6,464 9,017 11,421 12,382 17,155 19,374 Shareholders Funds 6,562 9,144 11,570 12,531 17,305 19,523 Minority Interest 859 1,276 1,670 3,754 3,754 3,754 Total Loans 4,873 5,577 5,916 5,599 4,499 3,649 Deferred Tax Liability 1,153 1,158 1,592 2,005 2,005 2,005 Total Liabilities 13,447 17,154 20,748 23,889 27,563 28,931 APPLICATION OF FUNDS Gross Block 12,528 13,729 19,062 21,618 22,818 23,718 Less: Acc. Depreciation 6,012 6,340 6,825 7,820 8,984 10,193 Net Block 6,515 7,389 12,237 13,798 13,834 13,525 Capital Work-in-Progress 1,957 5,534 1,982 1,021 2,821 4,921 Goodwill 1,844 1,991 2,001 2,001 2,001 2,001 Investments 2,272 1,661 3,563 6,675 6,675 6,675 Current Assets 3,301 4,258 4,534 4,360 6,132 5,943 Cash 369 290 227 237 1,669 1,152 Loans & Advances 748 1,205 1,261 1,261 1,261 1,261 Other 2,184 2,763 3,046 2,862 3,202 3,530 Current liabilities 2,443 3,678 3,568 3,966 3,901 4,134 Net Current Assets 858 580 966 394 2,231 1,809 Mis. Exp. not written off - - 0 0 0 0 Total Assets 13,447 17,154 20,748 23,889 27,563 28,931 Cash Flow Statement (consolidated) (Rs cr) Y/E March FY2007 FY2008 FY2009 FY2010E FY2011E FY2012E Profit before tax 3,451 4,812 3,621 5,380 3,748 4,462 Depreciation 610 670 866 995 1,164 1,210 Change in Working Capital (31) (56) 420 887 2,289 (479) Less: Other income 318 463 463 923 546 525 Direct taxes paid 1,092 1,466 991 1,570 1,142 1,324 Cash Flow from Operations 2,620 3,497 3,453 4,769 5,513 3,344 (Inc)/ Decin Fixed Assets (2,553) (4,777) (1,782) (1,595) (3,000) (3,000) (Inc)/ Dec in Investments (920) 611 (1,902) (3,112) - - (Inc)/ Dec in loans and advances Other income 318 463 463 923 546 525 Cash Flow from Investing (3,155) (3,703) (3,222) (3,785) (2,454) (2,475) Issue of Equity - - - - - - Inc./(Dec.) in loans 1,190 704 339 (317) (1,100) (850) Dividend Paid (Incl. Tax) 294 355 327 323 237 240 Others 229 222 307 335 290 296 Cash Flow from Financing 667 127 (295) (975) (1,627) (1,386) Inc./(Dec.) in Cash 132 (79) (63) 10 1,432 (517) Opening Cash balances 237 369 290 227 237 1,669 Closing Cash balances 369 290 227 237 1,669 1,152 May 21, 2010 9
  • 10.
    Grasim I 4QFY2010Result Update Key Ratios Y/E March FY2007 FY2008 FY2009 FY2010 FY2011E FY2012E Valuation Ratio (x) P/E (on FDEPS) 11.4 7.8 10.3 7.3 11.8 9.4 P/CEPS 7.6 5.6 6.4 4.7 6.0 5.2 P/BV 3.4 2.5 1.9 1.8 1.3 1.2 Dividend yield (%) 1.3 1.6 1.5 1.4 1.1 1.1 EV/Sales 1.9 1.6 1.5 1.4 1.3 1.2 EV/EBITDA 6.8 5.6 6.5 4.8 5.4 4.6 EV / Total Assets 2.0 1.6 1.4 1.2 0.9 0.9 Per Share Data (Rs) EPS (Basic) 214.6 315.2 238.3 337.6 207.9 260.5 EPS (fully diluted) 214.6 315.2 238.3 337.6 207.9 260.5 Cash EPS 323.8 438.1 381.2 524.0 411.2 474.2 DPS 32.1 38.8 35.7 35.2 25.9 26.2 Book Value 715.7 997.3 1,261.9 1,366.7 1,887.3 2,129.3 Dupont Analysis EBIT margin 23.9 25.3 18.9 24.0 18.2 20.2 Tax retention ratio 68.4 69.5 72.6 70.8 69.5 70.3 Asset turnover (x) 1.2 1.1 1.0 0.9 0.8 0.8 ROIC (Post-tax) 20.0 19.9 13.5 15.4 9.8 11.1 Cost of Debt (Post Tax) 3.7 3.0 3.9 4.1 4.0 5.1 Leverage (x) 0.7 0.6 0.5 0.5 0.3 0.1 Operating ROE 31.4 30.6 18.6 20.5 11.5 12.0 Returns (%) ROCE (Pre-tax) 28.4 28.0 18.3 21.5 13.6 15.0 Angel ROIC (Pre-tax) 39.5 46.1 26.8 25.8 16.7 20.2 ROE 34.5 33.2 21.1 25.7 12.8 13.0 Turnover ratios (x) Asset Turnover (Gross Block) 1.2 1.3 1.1 1.0 0.9 0.9 Inventory / Sales (days) 33 33 40 39 39 38 Receivables (days) 18 20 18 18 22 21 Working capital cycle (ex-cash) 12 8 10 8 7 11 (days) Solvency ratios (x) Net debt to equity 0.7 0.6 0.5 0.4 0.2 0.1 Net debt to EBITDA 1.1 1.1 1.3 0.9 0.6 0.5 Interest Coverage (EBIT / 14.7 19.3 11.3 14.3 12.0 14.3 Interest) May 21, 2010 10
  • 11.
    Grasim I 4QFY2010Result Update Research Team Tel: 022-4040 3800 E-mail: research@angeltrade.com Website: www.angeltrade.com DISCLAIMER This document is solely for the personal information of the recipient, and must not be singularly used as the basis of any investment decision. Nothing in this document should be construed as investment or financial advice. Each recipient of this document should make such investigations as they deem necessary to arrive at an independent evaluation of an investment in the securities of the companies referred to in this document (including the merits and risks involved), and should consult their own advisors to determine the merits and risks of such an investment. Angel Securities Limited, its affiliates, directors, its proprietary trading and investment businesses may, from time to time, make investment decisions that are inconsistent with or contradictory to the recommendations expressed herein. The views contained in this document are those of the analyst, and the company may or may not subscribe to all the views expressed within. Reports based on technical and derivative analysis center on studying charts of a stock's price movement, outstanding positions and trading volume, as opposed to focusing on a company's fundamentals and, as such, may not match with a report on a company's fundamentals. The information in this document has been printed on the basis of publicly available information, internal data and other reliable sources believed to be true, and are for general guidance only. Angel Securities Limited has not independently verified all the information contained within this document. Accordingly, we cannot testify, nor make any representation or warranty, express or implied, to the accuracy, contents or data contained within this document. While Angel Securities Limited endeavours to update on a reasonable basis the information discussed in this material, there may be regulatory, compliance, or other reasons that prevent us from doing so. This document is being supplied to you solely for your information, and its contents, information or data may not be reproduced, redistributed or passed on, directly or indirectly. Angel Securities Limited and its affiliates may seek to provide or have engaged in providing corporate finance, investment banking or other advisory services in a merger or specific transaction to the companies referred to in this report, as on the date of this report or in the past. Neither Angel Securities Limited nor its directors, employees and affiliates shall be liable for any loss or damage that may arise from or in connection with the use of this information. Note: Please refer to the important `Stock Holding Disclosure' report on the Angel website (Research Section). Disclosure of Interest Statement Grasim Industries 1. Analyst ownership of the stock No 2. Angel and its Group companies ownership of the stock Yes 3. Angel and its Group companies’ Directors ownership of the stock No 4. Broking relationship with company covered No Note: We have not considered any Exposure below Rs 1 lakh for Angel and its Group companies. Address: Acme Plaza, ‘A’ Wing, 3rd Floor, M.V. Road, Opp. Sangam Cinema, Andheri (E), Mumbai - 400 059. Tel : (022) 3952 4568 / 4040 3800 Angel Broking Ltd: BSE Sebi Regn No : INB 010996539 / CDSL Regn No: IN - DP - CDSL - 234 - 2004 / PMS Regn Code: PM/INP000001546 Angel Securities Ltd:BSE: INB010994639/INF010994639 NSE: INB230994635/INF230994635 Membership numbers: BSE 028/NSE:09946 Angel Capital & Debt Market Ltd: INB 231279838 / NSE FNO: INF 231279838 / NSE Member code -12798 Angel Commodities Broking (P) Ltd: MCX Member ID: 12685 / FMC Regn No: MCX / TCM / CORP / 0037 NCDEX : Member ID 00220 / FMC Regn No: NCDEX / TCM / CORP / 0302 May 21, 2010 11