This document discusses stroke, including its types, causes, pathophysiology, imaging findings, and clinical features. It provides the following key points:
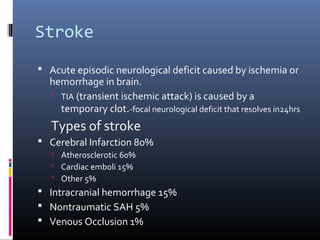
1. Stroke is caused by ischemia or hemorrhage in the brain. The main types are cerebral infarction (80%), intracerebral hemorrhage (15%), and subarachnoid hemorrhage (5%).
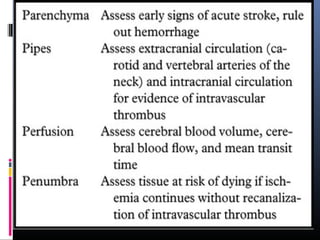
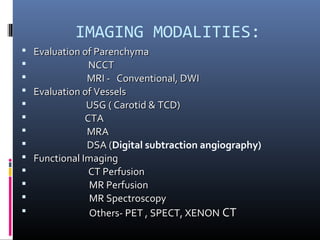
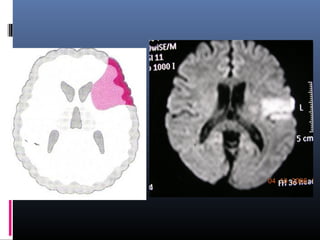
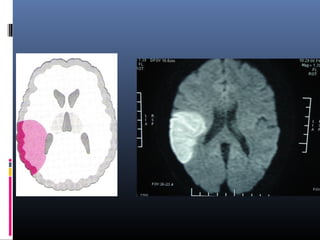
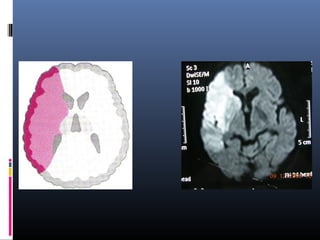
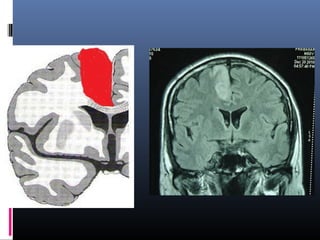
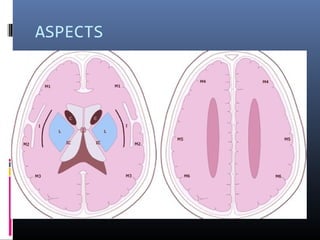
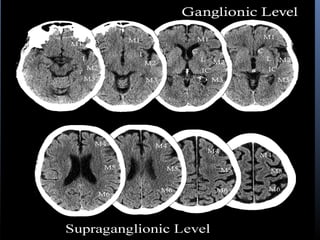
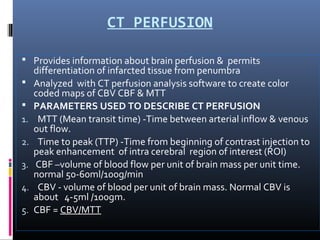
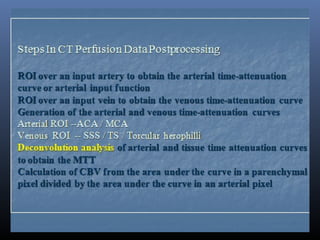
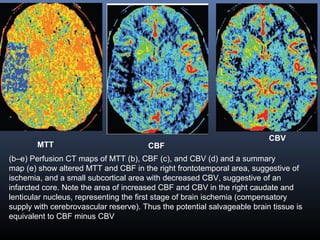
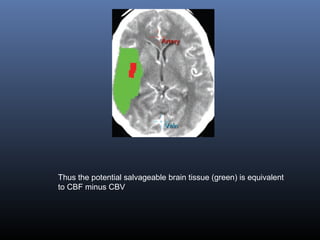
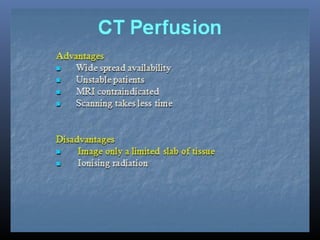
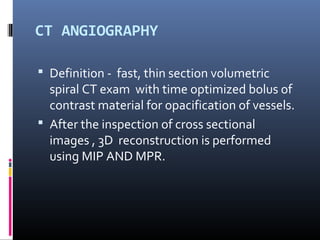
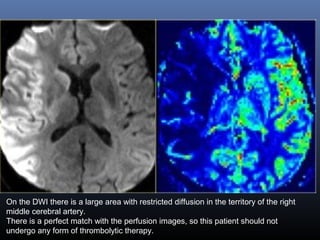
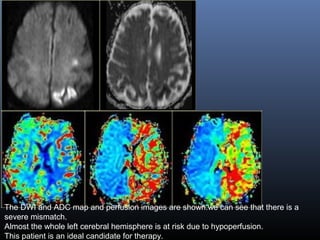
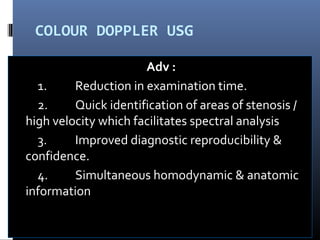
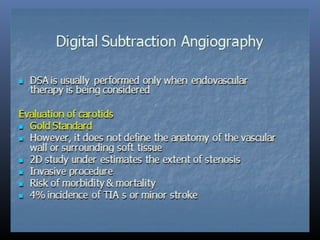
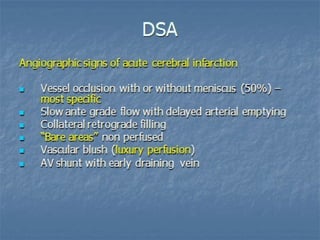
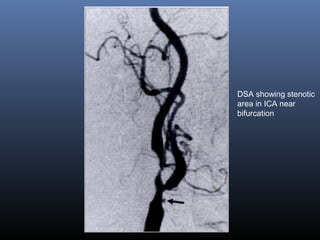
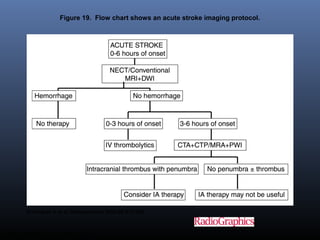
2. Imaging plays an important role in assessing the parenchyma, vessels, perfusion, and penumbra to guide therapy and predict outcomes. Techniques include CT, MRI, CT/MR perfusion, and angiography.
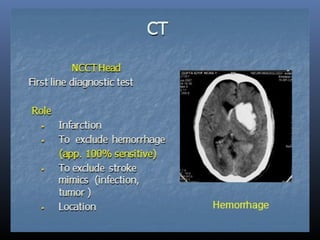
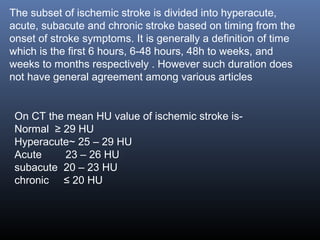
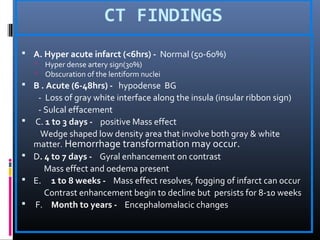
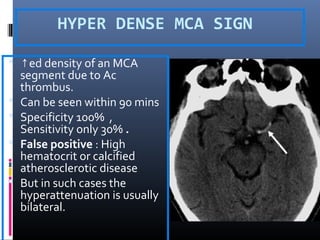
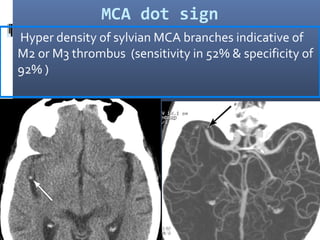
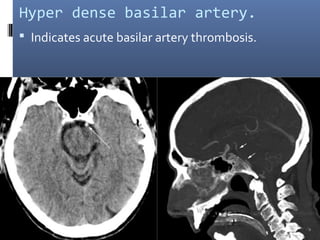
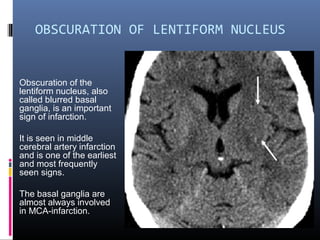
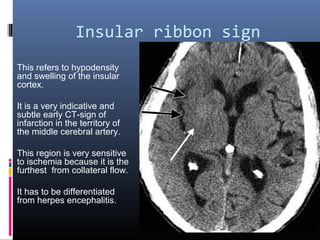
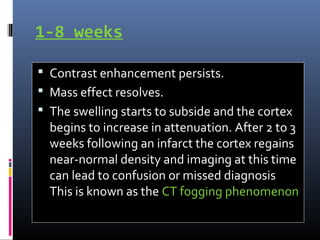
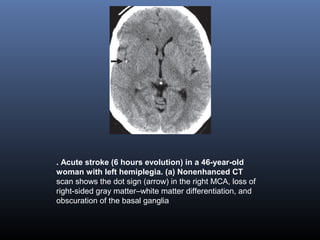
3. CT findings evolve over time from hyperacute to chronic stages. Early signs include
Objectives of this presentation are
Introduction to ct
Cross sectional anatomy
Common important pathologies
This presentation is aimed to educate beginers to help in ct interpretetion.
Definition of stroke and cerebrovascular disorders and pathophysiology of cerebral infarct and CT imaging overview of acute-subacute and chronic infarcts and penumbra.
causes of cerebral edema , Radiological signs of acute infarct and hemorrhagic infarct and comparison of MRI and CT in the diagnosis of acute infarct
Role of diffusion weighted imaging (DWI) and diffusion perfusion mismatch
Magnetic Resonance Angiography and VenographyAnjan Dangal
Introduction to MR Angiography and Venography Procedure of Brain . Includes Indication, MRI protocol, planning and anatomy as well as brief intoduction to physics behind MRA and MRV principle.
Its important to recognise the myelination pattern in neonates and infants. This presentation talks about the myelination pattern and imaging of white matter diseases in children.
Five pearls and pitfalls in using head CT for diagnosis of traumatic brain injury. This was presented at the 51st Annual Scientific Meeting of the Royal College of Radiologists of Thailand (6 Aug 2014)
stroke FOAM Acute central nervous system injury with abrupt onsetDr Aya Ali
Acute central nervous system injury with abrupt
onset
Mechanism:
• Interruption of blood flow(Ischemic Stroke)
or
• Bleeding into or around the brain(Hemorrhagic
stroke)
ARTIFICIAL INTELLIGENCE IN HEALTHCARE.pdfAnujkumaranit
Artificial intelligence (AI) refers to the simulation of human intelligence processes by machines, especially computer systems. It encompasses tasks such as learning, reasoning, problem-solving, perception, and language understanding. AI technologies are revolutionizing various fields, from healthcare to finance, by enabling machines to perform tasks that typically require human intelligence.
Anti ulcer drugs and their Advance pharmacology ||
Anti-ulcer drugs are medications used to prevent and treat ulcers in the stomach and upper part of the small intestine (duodenal ulcers). These ulcers are often caused by an imbalance between stomach acid and the mucosal lining, which protects the stomach lining.
||Scope: Overview of various classes of anti-ulcer drugs, their mechanisms of action, indications, side effects, and clinical considerations.
Tom Selleck Health: A Comprehensive Look at the Iconic Actor’s Wellness Journeygreendigital
Tom Selleck, an enduring figure in Hollywood. has captivated audiences for decades with his rugged charm, iconic moustache. and memorable roles in television and film. From his breakout role as Thomas Magnum in Magnum P.I. to his current portrayal of Frank Reagan in Blue Bloods. Selleck's career has spanned over 50 years. But beyond his professional achievements. fans have often been curious about Tom Selleck Health. especially as he has aged in the public eye.
Follow us on: Pinterest
Introduction
Many have been interested in Tom Selleck health. not only because of his enduring presence on screen but also because of the challenges. and lifestyle choices he has faced and made over the years. This article delves into the various aspects of Tom Selleck health. exploring his fitness regimen, diet, mental health. and the challenges he has encountered as he ages. We'll look at how he maintains his well-being. the health issues he has faced, and his approach to ageing .
Early Life and Career
Childhood and Athletic Beginnings
Tom Selleck was born on January 29, 1945, in Detroit, Michigan, and grew up in Sherman Oaks, California. From an early age, he was involved in sports, particularly basketball. which played a significant role in his physical development. His athletic pursuits continued into college. where he attended the University of Southern California (USC) on a basketball scholarship. This early involvement in sports laid a strong foundation for his physical health and disciplined lifestyle.
Transition to Acting
Selleck's transition from an athlete to an actor came with its physical demands. His first significant role in "Magnum P.I." required him to perform various stunts and maintain a fit appearance. This role, which he played from 1980 to 1988. necessitated a rigorous fitness routine to meet the show's demands. setting the stage for his long-term commitment to health and wellness.
Fitness Regimen
Workout Routine
Tom Selleck health and fitness regimen has evolved. adapting to his changing roles and age. During his "Magnum, P.I." days. Selleck's workouts were intense and focused on building and maintaining muscle mass. His routine included weightlifting, cardiovascular exercises. and specific training for the stunts he performed on the show.
Selleck adjusted his fitness routine as he aged to suit his body's needs. Today, his workouts focus on maintaining flexibility, strength, and cardiovascular health. He incorporates low-impact exercises such as swimming, walking, and light weightlifting. This balanced approach helps him stay fit without putting undue strain on his joints and muscles.
Importance of Flexibility and Mobility
In recent years, Selleck has emphasized the importance of flexibility and mobility in his fitness regimen. Understanding the natural decline in muscle mass and joint flexibility with age. he includes stretching and yoga in his routine. These practices help prevent injuries, improve posture, and maintain mobilit
Couples presenting to the infertility clinic- Do they really have infertility...Sujoy Dasgupta
Dr Sujoy Dasgupta presented the study on "Couples presenting to the infertility clinic- Do they really have infertility? – The unexplored stories of non-consummation" in the 13th Congress of the Asia Pacific Initiative on Reproduction (ASPIRE 2024) at Manila on 24 May, 2024.
Factory Supply Best Quality Pmk Oil CAS 28578–16–7 PMK Powder in Stockrebeccabio
Factory Supply Best Quality Pmk Oil CAS 28578–16–7 PMK Powder in Stock
Telegram: bmksupplier
signal: +85264872720
threema: TUD4A6YC
You can contact me on Telegram or Threema
Communicate promptly and reply
Free of customs clearance, Double Clearance 100% pass delivery to USA, Canada, Spain, Germany, Netherland, Poland, Italy, Sweden, UK, Czech Republic, Australia, Mexico, Russia, Ukraine, Kazakhstan.Door to door service
Hot Selling Organic intermediates
New Directions in Targeted Therapeutic Approaches for Older Adults With Mantl...i3 Health
i3 Health is pleased to make the speaker slides from this activity available for use as a non-accredited self-study or teaching resource.
This slide deck presented by Dr. Kami Maddocks, Professor-Clinical in the Division of Hematology and
Associate Division Director for Ambulatory Operations
The Ohio State University Comprehensive Cancer Center, will provide insight into new directions in targeted therapeutic approaches for older adults with mantle cell lymphoma.
STATEMENT OF NEED
Mantle cell lymphoma (MCL) is a rare, aggressive B-cell non-Hodgkin lymphoma (NHL) accounting for 5% to 7% of all lymphomas. Its prognosis ranges from indolent disease that does not require treatment for years to very aggressive disease, which is associated with poor survival (Silkenstedt et al, 2021). Typically, MCL is diagnosed at advanced stage and in older patients who cannot tolerate intensive therapy (NCCN, 2022). Although recent advances have slightly increased remission rates, recurrence and relapse remain very common, leading to a median overall survival between 3 and 6 years (LLS, 2021). Though there are several effective options, progress is still needed towards establishing an accepted frontline approach for MCL (Castellino et al, 2022). Treatment selection and management of MCL are complicated by the heterogeneity of prognosis, advanced age and comorbidities of patients, and lack of an established standard approach for treatment, making it vital that clinicians be familiar with the latest research and advances in this area. In this activity chaired by Michael Wang, MD, Professor in the Department of Lymphoma & Myeloma at MD Anderson Cancer Center, expert faculty will discuss prognostic factors informing treatment, the promising results of recent trials in new therapeutic approaches, and the implications of treatment resistance in therapeutic selection for MCL.
Target Audience
Hematology/oncology fellows, attending faculty, and other health care professionals involved in the treatment of patients with mantle cell lymphoma (MCL).
Learning Objectives
1.) Identify clinical and biological prognostic factors that can guide treatment decision making for older adults with MCL
2.) Evaluate emerging data on targeted therapeutic approaches for treatment-naive and relapsed/refractory MCL and their applicability to older adults
3.) Assess mechanisms of resistance to targeted therapies for MCL and their implications for treatment selection
These lecture slides, by Dr Sidra Arshad, offer a quick overview of physiological basis of a normal electrocardiogram.
Learning objectives:
1. Define an electrocardiogram (ECG) and electrocardiography
2. Describe how dipoles generated by the heart produce the waveforms of the ECG
3. Describe the components of a normal electrocardiogram of a typical bipolar leads (limb II)
4. Differentiate between intervals and segments
5. Enlist some common indications for obtaining an ECG
Study Resources:
1. Chapter 11, Guyton and Hall Textbook of Medical Physiology, 14th edition
2. Chapter 9, Human Physiology - From Cells to Systems, Lauralee Sherwood, 9th edition
3. Chapter 29, Ganong’s Review of Medical Physiology, 26th edition
4. Electrocardiogram, StatPearls - https://www.ncbi.nlm.nih.gov/books/NBK549803/
5. ECG in Medical Practice by ABM Abdullah, 4th edition
6. ECG Basics, http://www.nataliescasebook.com/tag/e-c-g-basics
HOT NEW PRODUCT! BIG SALES FAST SHIPPING NOW FROM CHINA!! EU KU DB BK substit...GL Anaacs
Contact us if you are interested:
Email / Skype : kefaya1771@gmail.com
Threema: PXHY5PDH
New BATCH Ku !!! MUCH IN DEMAND FAST SALE EVERY BATCH HAPPY GOOD EFFECT BIG BATCH !
Contact me on Threema or skype to start big business!!
Hot-sale products:
NEW HOT EUTYLONE WHITE CRYSTAL!!
5cl-adba precursor (semi finished )
5cl-adba raw materials
ADBB precursor (semi finished )
ADBB raw materials
APVP powder
5fadb/4f-adb
Jwh018 / Jwh210
Eutylone crystal
Protonitazene (hydrochloride) CAS: 119276-01-6
Flubrotizolam CAS: 57801-95-3
Metonitazene CAS: 14680-51-4
Payment terms: Western Union,MoneyGram,Bitcoin or USDT.
Deliver Time: Usually 7-15days
Shipping method: FedEx, TNT, DHL,UPS etc.Our deliveries are 100% safe, fast, reliable and discreet.
Samples will be sent for your evaluation!If you are interested in, please contact me, let's talk details.
We specializes in exporting high quality Research chemical, medical intermediate, Pharmaceutical chemicals and so on. Products are exported to USA, Canada, France, Korea, Japan,Russia, Southeast Asia and other countries.
Ozempic: Preoperative Management of Patients on GLP-1 Receptor Agonists Saeid Safari
Preoperative Management of Patients on GLP-1 Receptor Agonists like Ozempic and Semiglutide
ASA GUIDELINE
NYSORA Guideline
2 Case Reports of Gastric Ultrasound
The prostate is an exocrine gland of the male mammalian reproductive system
It is a walnut-sized gland that forms part of the male reproductive system and is located in front of the rectum and just below the urinary bladder
Function is to store and secrete a clear, slightly alkaline fluid that constitutes 10-30% of the volume of the seminal fluid that along with the spermatozoa, constitutes semen
A healthy human prostate measures (4cm-vertical, by 3cm-horizontal, 2cm ant-post ).
It surrounds the urethra just below the urinary bladder. It has anterior, median, posterior and two lateral lobes
It’s work is regulated by androgens which are responsible for male sex characteristics
Generalised disease of the prostate due to hormonal derangement which leads to non malignant enlargement of the gland (increase in the number of epithelial cells and stromal tissue)to cause compression of the urethra leading to symptoms (LUTS
micro teaching on communication m.sc nursing.pdfAnurag Sharma
Microteaching is a unique model of practice teaching. It is a viable instrument for the. desired change in the teaching behavior or the behavior potential which, in specified types of real. classroom situations, tends to facilitate the achievement of specified types of objectives.
Title: Sense of Smell
Presenter: Dr. Faiza, Assistant Professor of Physiology
Qualifications:
MBBS (Best Graduate, AIMC Lahore)
FCPS Physiology
ICMT, CHPE, DHPE (STMU)
MPH (GC University, Faisalabad)
MBA (Virtual University of Pakistan)
Learning Objectives:
Describe the primary categories of smells and the concept of odor blindness.
Explain the structure and location of the olfactory membrane and mucosa, including the types and roles of cells involved in olfaction.
Describe the pathway and mechanisms of olfactory signal transmission from the olfactory receptors to the brain.
Illustrate the biochemical cascade triggered by odorant binding to olfactory receptors, including the role of G-proteins and second messengers in generating an action potential.
Identify different types of olfactory disorders such as anosmia, hyposmia, hyperosmia, and dysosmia, including their potential causes.
Key Topics:
Olfactory Genes:
3% of the human genome accounts for olfactory genes.
400 genes for odorant receptors.
Olfactory Membrane:
Located in the superior part of the nasal cavity.
Medially: Folds downward along the superior septum.
Laterally: Folds over the superior turbinate and upper surface of the middle turbinate.
Total surface area: 5-10 square centimeters.
Olfactory Mucosa:
Olfactory Cells: Bipolar nerve cells derived from the CNS (100 million), with 4-25 olfactory cilia per cell.
Sustentacular Cells: Produce mucus and maintain ionic and molecular environment.
Basal Cells: Replace worn-out olfactory cells with an average lifespan of 1-2 months.
Bowman’s Gland: Secretes mucus.
Stimulation of Olfactory Cells:
Odorant dissolves in mucus and attaches to receptors on olfactory cilia.
Involves a cascade effect through G-proteins and second messengers, leading to depolarization and action potential generation in the olfactory nerve.
Quality of a Good Odorant:
Small (3-20 Carbon atoms), volatile, water-soluble, and lipid-soluble.
Facilitated by odorant-binding proteins in mucus.
Membrane Potential and Action Potential:
Resting membrane potential: -55mV.
Action potential frequency in the olfactory nerve increases with odorant strength.
Adaptation Towards the Sense of Smell:
Rapid adaptation within the first second, with further slow adaptation.
Psychological adaptation greater than receptor adaptation, involving feedback inhibition from the central nervous system.
Primary Sensations of Smell:
Camphoraceous, Musky, Floral, Pepperminty, Ethereal, Pungent, Putrid.
Odor Detection Threshold:
Examples: Hydrogen sulfide (0.0005 ppm), Methyl-mercaptan (0.002 ppm).
Some toxic substances are odorless at lethal concentrations.
Characteristics of Smell:
Odor blindness for single substances due to lack of appropriate receptor protein.
Behavioral and emotional influences of smell.
Transmission of Olfactory Signals:
From olfactory cells to glomeruli in the olfactory bulb, involving lateral inhibition.
Primitive, less old, and new olfactory systems with different path
2. Stroke
Acute episodic neurological deficit caused by ischemia or
hemorrhage in brain.
TIA (transient ischemic attack) is caused by a
temporary clot.-focal neurological deficit that resolves in24hrs
Types of stroke
Cerebral Infarction 80%
Atherosclerotic 60%
Cardiac emboli 15%
Other 5%
Intracranial hemorrhage 15%
Nontraumatic SAH 5%
Venous Occlusion 1%
3. CAUSES BY AGE
Adult
Atherosclerosis
Emboli (cardiac and noncardiac)
Young Patient
Arterial dissection
Vasculopathy
Emboli
Drug abuse
Venous Thrombosis
Blood dyscrasia
4.
5.
6.
7.
8. Causes of cytotoxic edema
Early ischemia
Encephalopathy
Early hypoxia
Reyes syndrome
Severe hypothermia
Various toxins (eg dinitrophenol,
hexachlorophene, isoniazid)
9.
10.
11. Pathophysiology of IschaemicPathophysiology of Ischaemic
Stroke:Stroke:
Perfusion is maintained by autoregulationPerfusion is maintained by autoregulation
Normal - CBF - 50-60 ml / 100gm / minNormal - CBF - 50-60 ml / 100gm / min
Oligaemic State - CBF - 35ml / 100gm / minOligaemic State - CBF - 35ml / 100gm / min
Ischaemic State - CBF - 20ml / 100gm / minIschaemic State - CBF - 20ml / 100gm / min
Infarction - CBF < 10ml / 100gm / minInfarction - CBF < 10ml / 100gm / min
PENUMBRA: “TISSUE AT RISK”PENUMBRA: “TISSUE AT RISK”
SALVAGEABLESALVAGEABLE
THERAPEUTIC WINDOW - ? < 3 HRSTHERAPEUTIC WINDOW - ? < 3 HRS
12.
13. Goals of Acute Stroke
Imaging Targeted toward assessment of the
four Ps—
Parenchyma
Pipes
Perfusion
Penumbra
Selection of the appropriate therapy,
and prediction of the clinical outcome
17. On CT the mean HU value of ischemic stroke is-
Normal ≥ 29 HU
Hyperacute~ 25 – 29 HU
Acute 23 – 26 HU
subacute 20 – 23 HU
chronic ≤ 20 HU
The subset of ischemic stroke is divided into hyperacute,
acute, subacute and chronic stroke based on timing from the
onset of stroke symptoms. It is generally a definition of time
which is the first 6 hours, 6-48 hours, 48h to weeks, and
weeks to months respectively . However such duration does
not have general agreement among various articles
18. CT FINDINGS
A. Hyper acute infarct (<6hrs) - Normal (50-60%)
Hyper dense artery sign(30%)
Obscuration of the lentiform nuclei
B . Acute (6-48hrs) - hypodense BG
- Loss of gray white interface along the insula (insular ribbon sign)
- Sulcal effacement
C. 1 to 3 days - positive Mass effect
Wedge shaped low density area that involve both gray & white
matter. Hemorrhage transformation may occur.
D. 4 to 7 days - Gyral enhancement on contrast
Mass effect and oedema present
E. 1 to 8 weeks - Mass effect resolves, fogging of infarct can occur
Contrast enhancement begin to decline but persists for 8-10 weeks
F. Month to years - Encephalomalacic changes
19. HYPER DENSE MCA SIGN
↑ed density of an MCA
segment due to Ac
thrombus.
Can be seen within 90 mins
Specificity 100% ,
Sensitivity only 30% .
False positive : High
hematocrit or calcified
atherosclerotic disease
But in such cases the
hyperattenuation is usually
bilateral.
20.
21. MCA dot sign
Hyper density of sylvian MCA branches indicative of
M2 or M3 thrombus (sensitivity in 52% & specificity of
92% )
23. OBSCURATION OF LENTIFORM NUCLEUS
Obscuration of the
lentiform nucleus, also
called blurred basal
ganglia, is an important
sign of infarction.
It is seen in middle
cerebral artery infarction
and is one of the earliest
and most frequently
seen signs.
The basal ganglia are
almost always involved
in MCA-infarction.
24. Insular ribbon sign
This refers to hypodensity
and swelling of the insular
cortex.
It is a very indicative and
subtle early CT-sign of
infarction in the territory of
the middle cerebral artery.
This region is very sensitive
to ischemia because it is the
furthest from collateral flow.
It has to be differentiated
from herpes encephalitis.
26. It should be noted that the term haemorrhagic transformation
is a little variably used and collectively refers to two different
processes, which have different incidence, appearance and
prognostic implications. These are:
•petechial haemorrhage
•intracerebral haematoma
27. SUBACUTE INFARCTSSUBACUTE INFARCTS
Petechial haemorrhage
typically is more
pronounced in grey
matter and results in
increased attenuation.
secondary haematomas
are merely a
summation of the
features of a ischaemic
infarct, with
superimposed cerebral
haemorrhage
28. Hemorrhagic infarcts
Petechial hemorrhage
Small foci of increased attenuation
in the infarcted area
> 50%
No effect on prognosis
No mass effect
Occurs in first 4th days , rare in the
first 6 hrs
Due to leaking blood from high
pressure vessels
Secondary hematoma
Hematoma within the infarcted
area.
< 5%
Affect prognosis
mass effect
Occurs in first 4 days and in the
first 24 hr in the thrombolysed
patients
Due to rupture vessels because
of rapid reperfusion .
29. Although this petechial change can result in cortex appearing near-normal it
should not be confused with the phenomenon of fogging seen on CT which
occurs 2 to 3 weeks after infarction.
30.
31. 1-8 weeks
Contrast enhancement persists.
Mass effect resolves.
The swelling starts to subside and the cortex
begins to increase in attenuation. After 2 to 3
weeks following an infarct the cortex regains
near-normal density and imaging at this time
can lead to confusion or missed diagnosis
This is known as the CT fogging phenomenon
37. Middle cerebral artery infarction - superior
branch
Clinical features
1.Contralateral hemiplegia – face and
upper limb more involved than
lower limb.
2. Contralateral hemisensory loss.
3.Conjugate gaze paresis(patient looks
towards the side of lesion.
4.Broca’s dysphasia (if left sided)
38.
39. Middle cerebral artery infarction - Inferior
branch
Clinical features
1.Contralateral hemianopia.
2.Wernicke’s dysphasia ( if left sided )
3.Left spatial neglect ( if right sided )
43. Middle cerebral artery infarction -
Clinical features
1.Contralateral hemiparesis
2.Contralateral sensory loss
3.Transcortical motor / sensory
aphasia ( left sided lesion)
Lenticular striate artery occlusion
44.
45. Anterior cerebral artery infarction
Clinical features
1.Contralateral
a.paralysis of leg and foot with paresis of
arm
b.cortical sensory loss over leg and foot
c.presence of primitive reflexes
2.Urinary incontinence
3.Gait apraxia
4.Apraxia of left sided limbs(with left sided
lesion and corpus callosum involvement)
46.
47. LACUNAR INFARCT
Lacunar infarcts are small infarcts(less than 15mm)
in the deeper parts of the brain (basal ganglia,
thalamus, white matter) and in the brain stem.
Lacunar infarcts are caused by occlusion of a single
deep penetrating artery.
Lacunar infarcts account for 25% of all ischemic
strokes.
Atherosclerosis is the most common cause of
lacunar infarcts followed by emboli.
25% of patients with clinical and radiologically
defined lacunes had a potential cardiac cause for
their strokes.
DD WITH VIRCHOW ROBIN SPACES
49. ASPECTS
The Alberta Stroke Program Early CT Score (ASPECTS) was
proposedin 2001 as a means of quantitatively assessing acute
ischemiaon CT images by using a 10-point topographic scoring
system
According to this system, the MCA territory is dividedinto 10
regions, each of which accounts for one point in thetotal score
The normal MCA territory is assigned atotal score of 10. For each
area involved in stroke on the unenhancedCT images, one point is
deducted from that score.
It was demonstrated thatthe baseline ASPECTS correlated inversely
with the NationalInstitutes of Health Stroke Score (NIHSS), and, as
the ASPECTSdecreases, the probability of dependence, death, and
symptomatichemorrhage increases.
53. CT PERFUSION
Provides information about brain perfusion & permits
differentiation of infarcted tissue from penumbra
Analyzed with CT perfusion analysis software to create color
coded maps of CBV CBF & MTT
PARAMETERS USED TO DESCRIBE CT PERFUSION
1. MTT (Mean transit time) -Time between arterial inflow & venous
out flow.
2. Time to peak (TTP) -Time from beginning of contrast injection to
peak enhancement of intra cerebral region of interest (ROI)
3. CBF –volume of blood flow per unit of brain mass per unit time.
normal 50-60ml/100g/min
4. CBV - volume of blood per unit of brain mass. Normal CBV is
about 4-5ml /100gm.
5. CBF = CBV/MTT
54.
55. . Acute stroke (6 hours evolution) in a 46-year-old
woman with left hemiplegia. (a) Nonenhanced CT
scan shows the dot sign (arrow) in the right MCA, loss of
right-sided gray matter–white matter differentiation, and
obscuration of the basal ganglia
56. MTT
CBV
CBF
(b–e) Perfusion CT maps of MTT (b), CBF (c), and CBV (d) and a summary
map (e) show altered MTT and CBF in the right frontotemporal area, suggestive of
ischemia, and a small subcortical area with decreased CBV, suggestive of an
infarcted core. Note the area of increased CBF and CBV in the right caudate and
lenticular nucleus, representing the first stage of brain ischemia (compensatory
supply with cerebrovascular reserve). Thus the potential salvageable brain tissue is
equivalent to CBF minus CBV
57. Thus the potential salvageable brain tissue (green) is equivalent
to CBF minus CBV
58. Follow-up axial T2-weighted MR image shows a hyperintense right
front parietal area and caudate nucleus related to final infarction in the
ischemic area (both decreased and increased flow areas at perfusion CT),
which resulted because no treatment was performed
59.
60. CT ANGIOGRAPHY
Definition - fast, thin section volumetric
spiral CT exam with time optimized bolus of
contrast material for opacification of vessels.
After the inspection of cross sectional
images , 3D reconstruction is performed
using MIP AND MPR.
61. ADVANTAGES OF CTA
1. Non Invasive & Easy to interpret
2. Able to detect plaque morphology with calcified
plaque easily distinguished from soft or lipid
laden plaque
3. Images can be acquired very quickly
4. Cost effective
5. Widely available can be done in emergency
setting.
6. Not effected by complex flow dynamics as are
MRA & doppler
7. Ability to distinguish vessel occlusion from near
total stenosis
62. DISADVANTAGES
1. Contrast is needed.
2. Significant time needed for post processing
of source images at a workstation.
3. Difficult to scan from the aortic arch to the
intracranial circulation at appropriate slice
thickness in one setting
65. MRI: -(T1W, T2W,PD,FLAIR)
MR FINDINGS
1. Immediate: Absence of normal flow void ( detected within mins of
symptoms ) , low ADC, Perfusion alterations
2. <12hrs – Anatomic alterations on T1WI sulcal effacement , gyral edema loss
of gray white interfaces
3. 12-24 hrs : Hyper intensity on T2WI, Meningeal enhancement adjacent to
infarct, mass effect.
4. 1-3 days : Intravascular Meningeal enhancement begin decreasing, early
parenchymal contrast enhancement ,signal abnormalities striking on T2W ,
Hemorrhage transformation may occur.
5 . 4-7 days : Striking parenchymal contrast enhancement, mass effect,
edema starts decreasing, intravascular& Meningeal enhancement
disappears.
6. 1-8 weeks : Contrast enhancement often persists, mass effect resolves.
Decrease in abnormal signal on T2W1 (fogging effect)
7 . Months Years : Encephalomalacic changes, hemorrhagic residue.
66. SIGNS OF ACUTE STROKE ON
FLAIR
FLAIR sequence produce a heavily T2WI with nulling of the signal of
CSF .By suppressing the S.I of bulk water FLAIR images increase the
conspicuity of lesions located in areas adjacent to or filled with CSF.
1. Hyperintense vessel sign : Increased signal intensity in lumen of
large and small vessels may be observed as a sign of infarction. (On
T2WI – occlusion of intracranial arteries is visible as lack of flow void.)
2. Hyperintense swollen cortical gyri : Acute infarcts can appear on
FLAIR as swollen cortical gyri of increased signal intensity. It may also
appear bright on T2WI but FLAIR depicts these areas more clearly than
T2WI by suppressing the CSF signal.
67. Hyperintense vessel sign
FLAIR MR image show punctiform
hyperintense vessels in left sylvian fissure
suggesting slow flow or thrombosis in insular
branches of middle cerebral artery
T2-W MR image shows lack of flow void in
insular branches of left middle cerebral
artery (arrows). Compare with normal
contra lateral side.
68. Hyperintense swollen cortical gyri
DW MR image shows high signal intensity in left MCA territory (arrow); this
finding is indicative of acute ischemia. Lack of diffusion restriction in lesion
anteriorly in frontal lobe indicates that this lesion is not acute infarct
FLAIR MR
DW MR
69. ADVANCED MR IMAGING TECHNIQUES
FOR BETTER DEFINITION OF
STROKE1. MR diffusion imaging
2.MR Perfusion
3. Proton MR Spectroscopy imaging
70. DIFFUSION MRI
Is uniquely sensitive to detect earliest changes
within 90 mins
Sen88% -100% sp 86-100%
Acute stages - infarcted tissue has low ADC & seen
as hyperintense on DW1
Chr infarcts are hypointense on DW1 & hyperintense
on ADC
71. ADVANTAGES OF DWI OVER CONVENTIONAL
MRI
1. Identify stroke before conventional imaging.
2.Differentiate acute from chronic infarcts
3. Show small lesions adjacent to CSF (also be
diagnosed by FLAIR)
4.Fresh lesion can be identified among multiple
infarcts
5. To help predict outcome and to facilitate
correlation with final infarcts size
72. MRI Ischemia Timecourse
T2
DWI
ADC
In the acute phase T2WI will be
normal, but with time the
infarcted area will become
hyperintense.
The hyperintensity on T2WI
reaches its maximum between 7
to 30 days. After this it starts to
fade.
DWI is already positive in the
acute phase and then becomes
more bright with a maximum at 7
days.
DWI in brain infarction will be
positive for approximately for 3
weeks after onset (in spinal cord
infarction DWI is only positive for
one week!).
ADC will be of low signal
intensity with a maximum at 24
hours and then will increase in
signal intensity and finally
becomes bright in the chronic
stage.
73. Acute stroke
Figure 15a. Acute stroke of the posterior circulation in a 77-year-old man. (a) Diffusion-
weighted MR image shows bilateral areas of increased signal intensity (arrows) in the
thalami and occipital lobes. (b) ADC map shows decreased ADC values in the same
areas (arrows). These findings are indicative of acute ischemia
74. DW ADC
Chronic infarcts
Chronic infarcts in a 71-year-old man with a remote history of multiple strokes. (a)
Diffusion-weighted MR image shows areas of decreased signal intensity in the left
frontal lobe. (b) ADC map shows increased ADC values in the white matter of the right
frontal lobe. These features are suggestive of chronic infarction.
75.
76.
77. Pseudo-normalization of DWI
This occurs between 10-15 days.
The case on the left shows a normal DWI.
On T2WI there is may be some subtle hyperintensity in the right occipital lobe in the
vascular territory of the posterior cerebral artery.
The T1WI after the administration of Gadolinium shows gyral enhancement
indicating infarction.
78. PERFUSION MRI
dynamic susceptibility contrast MRI
Can detect impaired perfusion in both ischemic core &
penumbra.
Gd as contrast agent injected at rate of 5 ml /sec via a MRI
compatible power injector
hypoperfused show delayed arrival of contrast than in contra
lateral hemisphere
images are acquired during 1st
pass of contrast agent through
brain
analyzed with perfusion analysis software & adequate post
processing to create maps of CBF, CBV, MTT, TTP.
sensitivity of 74 to 84% and specificity of 96-100%
81. On the right the diffusion-perfusion mismatch is indicated in blue.
This is the tissue at risk.
82. On the DWI there is a large area with restricted diffusion in the territory of the right
middle cerebral artery.
There is a perfect match with the perfusion images, so this patient should not
undergo any form of thrombolytic therapy.
83. The DWI and ADC map and perfusion images are shown.we can see that there is a
severe mismatch.
Almost the whole left cerebral hemisphere is at risk due to hypoperfusion.
This patient is an ideal candidate for therapy.
84. Can be used to observe Ischemia induced changes in cerebral metabolism.
Characterised by decreased N-acetyl aspartate, creatine &phosphocreatine
& elevated lactate.
85. Carotid sonography
Noninvasive , safe & inexpensive .
Identification of Stenosis : B Mode, Color Doppler
B Mode –
(i) IMT(intima media thickness) -- normal up to 0.8 mm
(ii) Plaque – identification –extent , location , surface
contour ,texture
USG features s/o plaque ulceration
1. Focal depression or break in plaque surface.
2. Anechoic region within plaque extending to
vessel lumen.
3. Eddies of colour within plaque
86. CDUS : 91 to 94% sensitive and 85% to 99%
specific in detecting significant stenosis of the
ICA
Assessment of severity : Severity depends on 4
factors
1. PSV
2. EDV
3. Amount of spectral broadening
4. Nature of flow pattern distal to Stenosis
87. PSV EDV Spectral PSV
ICA/CCA
Normal <125cm/s <40 Normal <2
1-15% <125cm/s <40 Minimal broadening <2
15-49% <125cm/s <40 Marked broadening <2
50-79% >125cm/s <140 Marked broadening with
post stenotic turbulence
>3
80-99% >250cm/s >140 -Do – variable
Occlusio
n
No flow No
flow
N.A NA
DOPPLER SPECTRUM
ANALYSIS
Classification of ICA
Stenosis
88. R ICA High-grade Stenosis (80-
90% diameter reduction
Colour Doppler US image of the right Common Carotid arterial bifurcation with a large
eccentric fibro fatty plaque. Severe aliasing and turbulence are seen at the stenotic
segment.
89. R ICA High-grade Stenosis
(>80% by velocity criteria)
The Spectral Doppler trace shows extremely high systolic and diastolic
velocities (PSV 450cm/s & EDV240cm/s) in the stenotic segment with
turbulence.
90. Intramural hematoma
Color Doppler image of a patient with
ICA dissection shows a hypo echoic thickened wall (arrowheads),
a finding consistent with an intramural hematoma.
91. Double lumen with different
signals
Figure 7. Color
Doppler image of
a patient with ICA
dissection shows a
double lumen with
different signals
103. Q9.1. Diagnosis Please
Post-contrast Axial T1-wtd
image
T1-wtd imageFLAIR Image
Post-contrast coronal T1
wtd image
MRA Circle of Willis
Diffusion weighted image
(DWI)
Diffusion weighted image (DWI)
9.1a 9.1b 9.1c 9.1d
9.1e 9.1f
47 year-old left
handed gentleman
with one day
history of left facial
droop and slurred
speech.
104. Diffusion weighted image (DWI)
9.1a 9.1b 9.1c 9.1d 9.1e 9.1f
Diagnosis: Acute one day old infarction involving the right
middle cerebral artery (MCA) territory.
Acute infarction is seen as an area of increased signal
intensity on DWI (arrow in A), FLAIR image (arrow in B), with
no evidence of hemorrhage on T1-wtd image (C) and no
enhancement on post contrast images (D). Intravascular
enhancement also an indication of acute stroke is shown on
coronal T1 weighted image (arrow in F). MR angiography of
circle of Willis demonstrates small caliber of right Sylvian
branches of MCA (arrows in E) when compared to the normal
side.
105. Q9.6. Diagnosis Please
July 31, 2003
T1-wtd imageDW Image FLAIR Image Post-contrast Axial T1-wtd
image
9.6a 9.6b 9.6c 9.6d
December 31, 2003
DW Image FLAIR Image T1-wtd image Post-contrast Axial T1-wtd
image
9.6e 9.6f 9.6g 9.6h
73 year-old male with stage IV non-small cell carcinoma presented with 2 weeks
history of sudden onset of speech difficulty with difficulty in word finding,
symptoms gradually improved. Clinical diagnosis: Stroke versus metastasis.
A repeat MRI
scan done 5
months later
106. Q9.6. Diagnosis Please
July 31, 2003
December 31, 2003
Diagnosis: Non-hemorrhagic subacute enhancing infarct (2 weeks old)
involving the left basal ganglia region. Subacute infarct is seen as an area
of increased signal intensity on FLAIR image (arrow in B) and bright signal
intensity on DWI (arrow in A). Enhancement of the infarct is shown on post
contrast image (arrow in D).
A repeat MRI scan done 5 months
later showed resolution of infarct and
no evidence of bright signal intensity
on diffusion weighted image E.
5 months old infarct.
9.6a 9.6b 9.6c 9.6d
9.6e 9.6f 9.6g 9.6h
Editor's Notes
Figure 2a. Axial unenhanced CT images in a proximal segment of the left MCA in a 53-year-old man (a) and a distal segment of the left MCA in a 62-year-old woman (b), obtained 2 hours after the onset of right Hemiparesis and aphasia, show areas of hyper attenuation (arrow) suggestive of intravascular thrombi.
Images of an 81-year-old female patient with atrial fibrillation who presented with left facial droop, slurred speech, and left lower-extremity weakness. (a) Initial noncontrast transverse head CT scan demonstrates a hyper attenuating dot (arrow) in right sylvian fissure, which is more opaque than any structure in ipsilateral or contra lateral sylvian fissure—the MCA dot sign. (b) Three-dimensional CT reformation obtained after the bolus administration of intravenous contrast material confirms acute occlusion (arrow) of the distal M1 segment of the MCA; the MCA dot sign seen on the noncontrast CT scan represents propagation of this thrombus in an M2 branch vessel.
GYRIFORM ENHANCEMENT
DD WITH VIRCHOW ROBIN SPACES
The Alberta Stroke Program Early CT Score (ASPECTS) was proposed in 2001 as a means of quantitatively assessing acute ischemia on CT images by using a 10-point topographic scoring system (23). According to this system, the MCA territory is divided into 10 regions, each of which accounts for one point in the total score (Fig 6). The normal MCA territory is assigned a total score of 10. For each area involved in stroke on the unenhanced CT images, one point is deducted from that score. Hence, a score of 0 translates into a finding of diffuse ischemic involvement throughout the MCA territory (Fig 7). It was demonstrated that the baseline ASPECTS correlated inversely with the National Institutes of Health Stroke Score (NIHSS), and, as the ASPECTS decreased, the probability of dependence, death, and symptomatic hemorrhage increased. In addition, clinical agreement with the ASPECTS was superior to that with the one-third MCA rule. The authors concluded that the ASPECTS system is a systematic, robust, and practical method that is applicable to axial images acquired at different levels
CT perfusion is analysed with commercial CT perfusion analysis software to create color coded maps of CBV CBF & MTT which are examined for detecting areas of hypo perfusion.
Figure 5. Acute stroke (6 hours evolution) in a 46-year-old woman with left hemiplegia. (a) Nonenhanced CT
scan shows the dot sign (arrow) in the right MCA, loss of right-sided gray matter–white matter differentiation, and
obscuration of the basal ganglia. (b–e) Perfusion CT maps of MTT (b), CBV (c), and CBF (d) and a summary
map (e) show altered MTT and CBF in the right frontotemporal area, suggestive of ischemia, and a reduced subcortical
area with decreased CBV, suggestive of an infarcted core. Note the area of increased CBF and CBV in the
right caudate and lenticular nucleus, representing the first stage of brain ischemia (compensatory supply with cerebrovascular
reserve). (f) Follow-up axial T2-weighted MR image shows a hyperintense right front parietal area and caudate nucleus related to final infarction in the ischemic area (both decreased and increased flow areas at perfusion CT), which resulted because no treatment was performed.
Figure 8. Acute stroke (1.5 hours evolution) in a 57-year-old woman with right hemiplegia. (a) Nonenhanced CT scan shows loss of the insular ribbon in the left MCA and hypo attenuation of the left lenticular nucleus.
(b–d) Perfusion CT maps of MTT (b) and CBV (c) and a summary map (d)
show extensive infarction with reduced mismatch. (e) Axial MIP reformatted
CT angiographic image shows left MCA obstruction (arrows). (f) CT
angiographic–source image shows an area of hypo attenuation, thereby
helping confirm core infarction (orange dots). (g) Axial diffusion-weighted
MR image obtained 24 hours later shows a hyperintense lesion representing
established infarction. The lesion appears very similar to the area seen at CT
angiography–source imaging.
Figure
Fig. 2A. —. FLAIR MR image shows punctiform hyperintense vessels in left sylvian fissure (arrows), suggesting slow flow or thrombosis in insular branches of middle cerebral artery
Fig. 2B. —T2-W MR image shows lack of flow void in insular branches of left middle cerebral artery (arrows). Compare with normal contra lateral side.
Fig. 4A. —FLAIR MR image shows multiple swollen hyperintense cortical gyri in left insula (thick arrow). These gyriform, hazy areas of hyperintensity are not sharply demarcated. Compare these areas of hyperintensity with hyperintensity of old infarct in left frontal lobe anteriorly, which is more sharply demarcated (thin arrow). Note tubular area of hyperintense signal in M2 segment of left middle cerebral artery
DW MR image shows high signal intensity in left MCA territory (arrow); this finding is indicative of acute ischemia. Lack of diffusion restriction in lesion anteriorly in frontal lobe indicates that this lesion is not acute infarct
based on quantitative assessment of the random movements of water protons (ADC) within tissue. In acute ischaemic, the random movement of the water protons is rapidly attenuated due to disruption of energy metabolism with failure of ion pumps. This results cytotoxic edema (ADC is decreased by approx 30-50% within 30 mins of ischemia).
In DWI – structures with fast diffusion are dark & structure which slower diffusion are bright. In a I.
ADC continues to decrease & there is peak signal reduction between 1 to 4 days. ADC return to baseline at 1 to 4 wks reflects developments of vasogenic oedemic
Figure 15a. Acute stroke of the posterior circulation in a 77-year-old man. (a) Diffusion-weighted MR image (b = 1000 sec/mm2) shows bilateral areas of increased signal intensity (arrows) in the thalami and occipital lobes. (b) ADC map shows decreased ADC values in the same areas (arrows). These findings are indicative of acute ischemia
Figure 16a. Chronic infarcts in a 71-year-old man with a remote history of multiple strokes. (a) Diffusion-weighted MR image (b = 1000 sec/mm2) shows areas of decreased signal intensity in the left frontal lobe. (b) ADC map shows increased ADC values in the white matter of the right frontal lobe. These features are suggestive of chronic infarction.
Pseudo-normalization of DWIThis occurs between 10-15 days.The case on the left shows a normal DWI.On T2WI there is may be some subtle hyperintensity in the right occipital lobe in the vascular territory of the posterior cerebral artery.The T1WI after the administration of Gadolinium shows gyral enhancement indicating infarction.
In this approach, a paramagnetic substance typically a gadolinium bared contrast agent is injected rapidly at a rate of 5 ml /sec via a MRI compatible power injector. As the gadolinium travels through the blood vessels, there are signal changes caused by T1, T2 effects of the contrast agents. There contrast agents have T1 shortening effect through dipole - dipole interaction and T2 shortening effect through magnetic susceptibility effect.
Brain region that are hypoperfused are identified by the delayed arrival of contrast agent to vascular bed than in contra lateral hemisphere with patent vessels. Rapid MR images are acquired during the first pass of contrast agent through the brain. PWI data were analyzed with perfusion analysis software and adequate post processing to create maps of CBF, CBV, MTT, TTP. MR perfusion provides qualitative data regarding the cerebral circulation.
In general perfusion images are less sensitive than DWI in the detection of acute stroke with sensitivity if 74 to 84% and specificity of 96-100%
On the left we first have a diffusion image indicating the area with irreversible changes (dead issue).In the middle there is a large area with hypoperfusion.On the right the diffusion-perfusion mismatch is indicated in blue.This is the tissue at risk.This is the brain tissue that maybe can be saved with therapy.
On the DWI there is a large area with restricted diffusion in the territory of the right middle cerebral artery.There is a perfect match with the perfusion images, so this patient should not undergo any form of thrombolytic therapy.
On the left another case.The DWI and ADC map is shown.Continue for the perfusion images
Now we can see that there is a severe mismatch.Almost the whole left cerebral hemisphere is at risk due to hypoperfusion.This patient is an ideal candidate for therapy.
Colour Doppler US image of the right Common Carotid arterial bifurcation with a large eccentric fibro fatty plaque. Severe aliasing and turbulence are seen at the stenotic segment.
The Spectral Doppler trace shows extremely high systolic and diastolic velocities (PSV 450cm/s & EDV240cm/s) in the stenotic segment with turbulence.
Figure 5. Color Doppler image of a patient with
ICA dissection shows a hypo echoic thickened wall (arrowheads),
a finding consistent with an intramural hematoma.
The hematoma narrows the lumen and spares
the bulb
Figure 7. Color Doppler image of a patient with ICA
dissection shows a double lumen with different signals
Figure 6. Gray-scale B-mode Ultrasonographic (US)
image of a patient with ICA dissection shows an Intimal
flap (arrowhead
Figure 8. Power Doppler image of a patient with
ICA dissection shows a dissecting aneurysm.