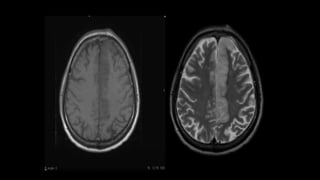
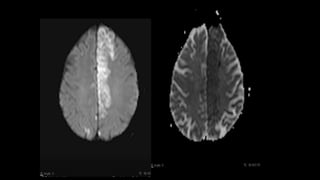
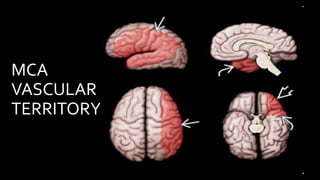
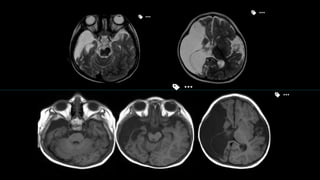
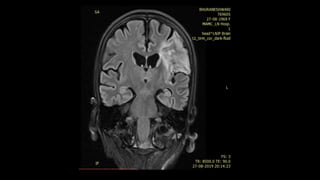
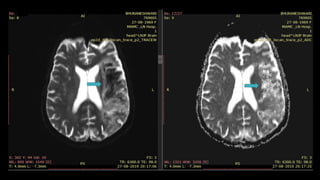
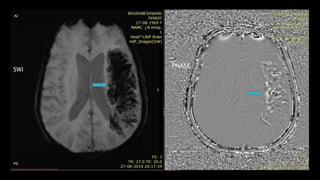
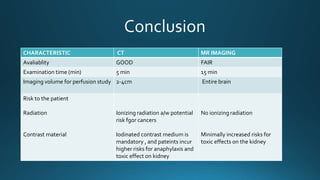
The document discusses the role of MR imaging in the diagnosis and management of stroke, highlighting the differences between ischemic and hemorrhagic strokes and the importance of imaging in triaging treatment options. It outlines the various neuroimaging techniques, their timeframes for stroke detection, and the critical information needed to determine the presence of reversible ischemic penumbra and the extent of infarction. Additionally, it emphasizes the advantages of MRI over CT in detecting hyperacute ischemic changes and the implications of imaging findings for treatment decisions.
MR IMAGING INSTROKE
MODERATOR DR RADHIKA BATRA
PG DR SHIVALI ARYA
DR SHUBHAM K.
2.
DEFINITION
Stroke is classicallycharacterized as
a neurological deficit attributed to an acute focal injury of the central
nervous system by a vascular cause , including cerebral infarction ,
intracerebral hemorrhage (ICH) and subarachanoid hemorrhage(SAH)”
PATHOPHYSIOLOGY OF ACUTEISCHEMIC
STROKE
CEREBRAL BLOOD FLOW( in
ml/min/100g )
NORMAL 50-60
OLIGEMIC STATE 35
ISCHEMIC STATE 20
INFARCTION <10
6.
• It isthe area at risk which is at the risk
of infarction if the blood flow is not
restored to normal
• It still has marginal blood supply from
collateral sources and retains intact
cellular metabolism. Thus , it has
potential to be restored under
reperfusion conditions and is vital in
GOALS OF NEUROIMAGING
PRIMARYGOALS
•To distinguish ischemic stroke
from Intracranial Haemorrhage
•To select/triage patients for
possible reperfusion therapies.
• Although CTis the most commonly used modality for stroke
imaging, partly because of its wide availability and faster
acquisition time , some comprehensive stroke centres choose
MRI rather than CT
because of higher Sn and Sp of MRI for delineation of
hyperacute ischemia.
• Absence of radiation.
delineating an ischemic penumbra
discrepancy betweenCT/CTA and clinical stroke severity
36.
First 3-6 hours= normal
BLURRING OF Grey matter-White Matter
INTERFACE
LOSS OFTHE EXPECTED FLOWVOID
38.
Nearly all strokeare FLAIR POSITIVE (cortical swelling
and hyperintensity , intraarterial hyperintensity) by 7
hours
T2 scans become positive by 12-24 hours
IMAGING SEQUENCE HYPERACUTE
INFARCT
ACUTEINFARCT
T1WEIGHTED isointensity usually low signal intensity after 12-
24 hours, BLURRINGOF GW-WM
INTERFACE can be seen
T2 WEIGHTED Isointensity after 12-24 hours ; may
see loss of flow void in large arteries
usually high signal intensity
FLAIR usually positive after 7 hours high signal intensity
DIFFUSIONWEIGHTED IMAGING high signal intensity high signal intensity
ADC MAPPING low signal intensity low signal intensity
CONTRAST ENHANCEDT1
WEIGHTED
arterial enhancement may occur
after 0-2 hours
arterial enhancement may occur
PROPERTIES DYNAMIC SUSCEPTIBILTY
CONTRAST(DSC)
DYNAMIC CONTRAST
ENHANCEMENT (DCE)
ARTERIAL SPIN
LABELLING (ASL)
HANDLING OF BOLUS tracking of bolus technique Passage of bolus technique Tagging of bolus
CONTRAST MEDIA intravenous gadolinium intravenous gadolinium No contrast
MECHANISM OF
RELAXATION
t2/t2* relaxation Signal change due toT1
relaxation
Signal change due to
Magnetic labelled bloodT1
relaxation
MECHANISM magnetic field is distorted by
contrast agent by virtue of its
paramagnetic property ,
leading to more susceptibility
effect and causes reduction of
t2 and t2* around the vessels
Contrast agent cause dipole-
dipole interaction between
the protons in the water
molecules leading toT1
shortening and production of
signal
Tagged blood by inversion
flows into the capillary site
followed by transcapillary
exchange with the brain
tissue and flows into the
draining vein
TYPES OF IMAGING
SEQUENCES
T2 /T2 *WI T1 WI Sequence with shortTE
and longTR
TOTAL DURATION OF
SCAN
Relatively short (< 2 min) Long (5-6 min) Long with multiple
averaging
SIGNALTO NOISE RATIO Very good good fair
73.
• DSC
injection ofa bolus of IV gadolinium
T2 * contrast
in the brain
• DCE shortening ofT1 shortening
IV gadolinium, outside the
brain
• ASL
WITHOUT CONTRAST AGENT. It
Good rule ofthumb is , if infarct is low signal on
ADC infarct is < 1week old.
“T2 shine through” is seen
DWI &
ADC
88.
T2* GRE
•Petechial orgyriform “ blooming” foci
•Prominent ipsilateral medullary veins on SWI
89.
HEMORRHAGIC TRANSFORMATION (HT)
20-25%cases 2days to a week
after ictus.
Reperfusion either spontaneously or following
treatment with tPA causes exudation of blood cells
through damaged vascular endothelium and blood
brain barrier.
Petechial > lobar bleed
HT Indicates favourable outcome
MR IMAGING FEATURES
T1WI-Hypointense , hyperintensity with
cortical necrosis may be seen.
T2WI- High signal intensity
FLAIR - Low signal intensity in presence of
cystic encephalomalacia , marginal gliosis
around the old cavitated lesions shows
hyperintensity.
ISCHEMIC STROKE, HYPOGLYCEMIA, STATUS
EPILEPTICUS, CARDIAC ARREST
• Most frequently located in medial occipital cortex and perirolandic
region
• Occurs due to neuronal damage , reactive tissue change of glia and
deposition of lipid laden macrophages.
T1 hyperintensity – as early as 3-5 days , but typically after 2
weeks , with a peak at 1 month and fades over 3 months. But is seen
for as long as 1.5 years
LOCAL SYSTEMIC
Sinus traumaProtien s and c deficiency
Regional infection Peripartum state
Neoplastic invasion OCP use
Hypercoagulable state
secondary to malignancy
Common Causes
In 25% cases - no cause is
identified
Neonate shock ,
dehydration
childrens Local infection
such as
mastoiditis
Adults coaglulopathy
Women Ocp ,
pregnancy
Most common
cause
Presentation – Headache ,
seizure
ACUTE 0-5 DAYSSUBACUTE 6-
15DAYS
CHRONIC>15
DAYS
Isointense onT1 Hyperintense on
bothT1 andT2
Isointense onT1
Hypointense onT2
Due to intracellular
deoxyhemoglobin
Due to
methemoglobin
In thrombus
Iso -hyper onT2
143.
SUPERFICIAL CEREBRALVEIN
THROMBOSIS
SuperficialThrombosis WithDST SuperficialThrombosis Without
DST
• Rare (5% of all CVTs)
• May cause convexal
subarachnoid hemorrhage
• May see "cord" sign on CT which
is called hyperintense vein sign on
MR representing adj thrombosed
vein
•T2* (GRE, SWI) key to diagnosis
○ "Blooming" thrombus in vein(s)
Altered mental status
Memoryimpairment
When midbrain is also involved – hemiplegia , oculomotor
disturbances may also be seen along with above triad.
NCCT scans in early acute AOP occlusions are usually normal.
T2/ FLAIR images shows round or ovoid hyperintensities in
the medial thalami, just lateral to 3rd ventricle and midbrain.
Vertical gaze palsy
158.
TOP OF BASILARINFARCTION
Locked in syndrome
“dense basilar artery sign”
160.
• It isImportant cause of stroke in the young patient
and is
164.
MULTIPLE EMBOLIC INFARCTS
cardiacemboli
GM-WM interface
•MR- multifocal peripheral T2/FLAIR hyperintensities
Differential diagnosis
Hypotensive cerebral infarction – involve deep
internal watershed zones
Parenchymal mets – do not restrict on DWI
166.
CHARACTERISTIC CT MRIMAGING
Avaliablity GOOD FAIR
Examination time (min) 5 min 15 min
Imaging volume for perfusion study 2-4cm Entire brain
Risk to the patient
Radiation
Contrast material
Ionizing radiation a/w potential
risk fgor cancers
Iodinated contrast medium is
mandatory , and pateints incur
higher risks for anaphylaxis and
toxic effect on kidney
No ionizing radiation
Minimally increased risks for
toxic effects on the kidney
Editor's Notes
#4 Stroke is categorized mainly into two types , in which ischemic stroke consists of 85 % of the cases and rest 15% is caused by the hemorrhagic stroke
#6 Normal cerebral blood flow is 50-60 ml /min /100 g of brain tissue in infarction it goes even below 10 ml
#8 Here is pictorial representation of 3 territories associated with stroke, in center there is zone of ischemic core. Surrounding it, is the penumbra. Outside penumbra there is zone of focal oligemia
#11 Aca vascular territory includes anterior two thirds of the medial surface . A thin strip of cortex over the top of the hemisphere and a small wedge along the inferomedial frontal lobe
#12 Here is an example. In the given AXIAL T1 Weighted image . There is hypointense area extending anteroposteriorly till 2/3 rd of interhemispheric fissure on left side with Corresponding hyperintensity on T2 Weighted image
#13 On DWI and corresponding ADC map , the area shows diffusion restriction s/o acute ACA territory infarct
#14 MCA supplies most of the lateral surface of the hemisphere, the anterior tip of the temporal lobe and the inferolateral frontal lobe. MCA is the most frequently occluded intracranial vessel
#15 In this example, there is e/o altered signal intensity area following CSF signal intensity noted in anterolateral part of right temporal region and right fronto-parietal, appearing hyperintense on T2 Weighted images, hypointense in T1 and FLAIR images with exvacuo dilatation of right lateral ventricle s/o volume loss.
#16 DWI and corresponding ADC map do not show any diffusion restriction . On the right is MR angiogram showing non visualization of right MCA
#17 PCA territory involves the occipital lobe and posterior third of the medial surface and posterolateral surfaces of the hemisphere as well as almost the entire inferior surface of the temporal lobe
#18 In this example of acute PCA territory infarct, AXIAL FLAIR image shows hyperintensity in right temporo-occipital region.DWI shows hyperintensity in the right temporo-occipital region with low ADC values on ADC map s/o diffusion restriction
#19 2 VA unite near the pontomedullary junction to form BA. BA courses superiorly into the prepontine cistern to terminate into 2 POSTERIOR CEREBRAL ARTERIES. Numerous small basilar perforating branches arise from the dorsal surface of the BA to supply the pons and midbrain. First major named BA branch is AICA .2 superior cerebellar arteries arise from each side of the distal BA that curve posterolaterally around the midbrain
#20 Graphic shows the posterior circulation vascular territories of PICA in orange, AICA in sky blue, SCA in yellow, MEDULLARY perforating brances of VA, PONTINE PERFORATING branches of BA, thalamic perforating branches from the top of BA and PCOM ARTERIES
#21 Here is an example. T2 axial and T1 Saggital image show focal altered signal intensity area on the left side of the medulla appearing hyperintense on T2 and hypointense on T1
#22 Corresponding FLAIR coronal image show hyperintense area on the left side of the medulla
#23 DWI and corresponding ADC map show diffusion restriction s/o acute medullary infarct
#27 Warning signs of stroke can be remembered as the abbreviation BEFAST where B stands for loss of balance, E for eye symptoms, F for facial drooping, A stands for ARM nad leg weakness and S stands for speech difficulty. When all these symptoms are present it’s the time to call for ambulance
#40 Here is the T2 Axial image of the same patient showing hyperintensity in right FRONTOPARIETAL REGION WITH BLURRING OF GREY WHITE MATTER JUNCTION
#41 FLAIR CORONAL images show HYPERintensitY in RIGHT FRONTOPARIETAL REGION
#42 On DWI …..
ADC value decrease and appears DARK with high signal intensity on DWI
#46 Here is the example of the same patient shown before. DWI shows hyperintensity in the right frontoparietal region with hypointensity on corresponding ADC map s/o diffusion restriction
#47 MR 2D ANGIO and 3D TOF MIP images show loss of flow related signals in right MCA. RIGHT ICA appear decreased in calibre as compared to left ICA
#50 Here is an example of abnormal linear hypointensity noted in left MCA in the axial SWI image consistent with thrombus. This is called artery susceptibility sign which is considered as MRI correlate of hyperdense MCA seen on NCCT
#51 Here is another example of 47y old male. FLAIR axial images show shows patchy hyperintensity in left caudate nucleus , lateral putamen and parietal cortex. T2* GRE shows several linear hypointensities in the affected MCA branches, consistent with haemoglobin deoxygenation caused by slow stagnating arterial blood flow.
#52 DWI of the same patient shows multiple patchy foci of diffusion restriction consistent with ACUTE CEREBRAL INFARCTION. AXIAL 2D MRA shows no flow in the left MCA
#55 Here is a CBF perfusion map showing perfusion abnormality in left frontoparietal region which appears blue on perfsuion map. DWI shows a smaller diffusion abnormality in left corona radiata. So the mismatched area shows ischemic penumbra. Areas that show matched diffusion and perfusion abnormality is the infarcted tissue
#58 Right occipital pyogenic abscess showing marked diffusion restriction within the core on DWI and ADC maps and a peripheral enhancing pattern on T1 post gadolinium
#59 HERE is an example of primary CNs LYMPHOMA showing Left frontal periventricular lesion showing prominent diffusion restriction presenting with hyperintensity on DWI and low ADC value
#60 This is an example of MRI of patient with status epilepticus showing normal T1 and T2 WI . DWI and corresponding ADC map show diffusion restriction in non vascular distribution sparing white matter
#61 Here is the summary of hyperacute and acute infarcts
HYPERACUTE AND ACUTE INFARCTS show high signal intensity on DWI and corresponding low signal intensity on ADC map
On c+ t1wi , arterial enhancement may occur in hyperacute and acute infarct.
#63 Here is TOF MIP and VRT MRA showing excellent angiogram due to background suppression and better flow related signal leading to better distal small vessel visibilty
#64 here is an example of AP VIEW of normal MR angiogram of cervicocranial arterial system
#65 In this MR angiography of bilateral carotid system there is e/o short segment narrowing of Left ICA s/o left ICA stenosis
#67 These are the sequences we take while characterizing plaque components . These are the things we look to characterize plaque
#69 MRI of a plaque in the right common carotid artery demonstrating fibrous cap rupture with ulcer formation The crescent-shaped high signal region in the PDW, T2W, and CE-T1W) images corresponding to a region of thrombus formation, shown on the matched histology section
#72 CBF is taken at the height of the curve. CBV is measured by area under the curve. T MAX is the time it takes for the tissue residue function to reach its maximum value.it is not influenced by the scan duration. Hence is the most widely accepted parameter to measure the penumbra
#73 Mainly 3 perfusion techniques are used in perfusion MRA
#75 This is an example of 51y woman with sudden onset of speech difficulties and right side weakness, FAST FLAIR sequence shows left MCA cortical hyperintensity . DWI shows restricted diffusion in the corresponding areas
#76 T2* GRE in the same case shows blooming thrombus in the left M1 segment till bifurcation. Perfusion MR shows markedly reduced cerebral blood flow in the densely ischemic core infarct which appears smaller than the corresponding DWI and FLAIR abnormality
#77 CBV is markedly reduced in the densely ischemic core infarct (SO there is matched reduction in both CBV and CBF), however there is a penumbra of well maintained CBV . Hence there is CBV-CBF MISMATCH in this area. MTT shows prolonged transit time therefore CBV/MTT MISMATCH in the large ischemic penumbra
#82 THIS IS THE SAGGITAL T1 W MRI BRAIN IMAGE SHOWING area of T1 HYPOINTENSITY IN CORONA RADIATA REGION
#83 This is the Axial t2wi of the same pt showing hyperintense signal corresponds to the right corona radiate region
#84 These are the axial T2WI taken at sequential intervals of a patient with R MCA territory infarct showing T2 fogging phenomenon with decrease in the the signal intensity over the period of time almost reaching to isointensity in 3rd image
#85 CORONAL FLAIR IMAGE OF THE SAME PT SHOWS HYPERINTENSE SIGNAL
#87 Axial T1 WI, t2 and flair SHOWS ill defined hypointense signal, apeearing hyperintense on T2/FLAIR in left mca territory ,
#88 DWI shows hyperintense signal and corresponding ADC map also shows hyperintense signal confirming that the high signal on DWI is not due to restricted diffudion and is due to T2 shine through.
#91 Sagital T1 and axial T2 wi showing areas of altered signal intensity appearing heterogeneously hypointense with hyperintense foci within on T1 and ,Heterogenously hypERintense on T2 in left frontoparietal lobe with loss of grey white matter differenciation
#93 Showing few areas of restricted diffusion in the periphery on DWI and ADC
#94 Extensive blooming is also seen within APPEARING white on phase images s/o large subacute infarct withj hemoorhagic transformation
#96 These are the T1 post contrast axial images of a 75 year women with right sided weakness and left MCA terriortory infarct taken at DAY 0 , 2 AND DAY 7.
Scan at D0 reveals mild intravascular enhancement , increasing on day 2 . Parenchymal enhancement is seen on day 7 scan .
#97 this is an example showing Diffusion w and TTP perfusion images showing acute ischemic lesion in left thalamus with hypoperfusion in the corresponding location . In the cerebellum ,trace dwi is unremarkable while TTP demonstrate hypoperfusion in contralateral cerebellar hemisphere
#102 This is the saggital T1WI of a showing multiple oval T1 hypointensities in left centrum semiovale and frontal white matter in a in a child with homocystinuria
#104 And shows signal suppression on FLAIR in the centre with marginal hyperintensity
#105 There is no diffusion restriction on DWI and ADC map s/o chronic infarcts with glioenccephalomalacic changes.
#106 .MRA of the same pt reveals non visualization of left ICA with narrowing of M1 segment of left MCA and A1 segment of ACA .Thus metabolic disorders must be kept as defential in pediatric stroke
#108 Flair coronal images showS gyriform hyperintensity in right parietal cortex
Another case showing cortical laminar necrosis in occipital cortex on T1 saggital IMAGE
#110 External –wedge or gyriform
internal- rosary like line of WMHs
#111 This is the diagram to show watershed zones .wedge shaped area between ACA , MCA and MCA – PCA represent external watershed zones. Curved blue line represent subcortical watershed zones. Yellow line indicate internal watershed zone b/w major vessels and perforating arteries.
#112 here is case of watershed infarct
FLAIR AXIAL MRI images shows bilateral areas of hyperintensity , most prominent are located posteriorly on the watershed b/w MCA –PCA and also bwtween ACA –MCA watershed in the last 2 images.
#113 As we saw in THIS example. The image shows typical man in the barrel phenotype with atrophy of shoulder gilde muscles and arms hanging flaccidly .
#120 With diffusion restriction on DWI and ADC map s/o acute lacunar infarct
#121 this are the axial FLAIR and DWI images showing another example of acute lacunar infarct in left hemispheric white matter showing FLAIR AND DWI hyperintensity
#123 C/o 75 y old men showing T1 hypointense and T2 hyperintense foci in mid pons
#124 Showing signal suppression on FLAIR image with no enhancement on post contrast scan s/o chroniclacunar infarct. Also there are T2/FLAIR hyperintensities in subcortical and periventricular white matter b/l s/o ischemic demylination and glioenchephalomalcic changes in right parietal refgion
#125 This is the another c/o CHRONIC LACUNAR infarct in right basal ganglia appearing hypointense on T1/ hyper on T2 with signal suppression on FLAIR
#126 Pvs tends to be sharpely marginated , ovoid and linear with complete suppression on flair however lacunar infarcts are often irregular with FLAIR hyperintense rim.
#129 MIP image from CE MR venography with color overlay shows
Lateral MIP images from CE MR V shows veins from the lateral cerebral hemisphere that drains into the SSS
1 frontopolar , 2 anterior frontal , 3 posterior frontal , 4 vein ot tolard , 5 anterior parietal
6 SMCV which drain into sphwenopartietal snus or cavernous sinus , 7 is the vein of labbe that drains into transverse sinus
#130 These are the Axial color coded diag demonstrating venous draignage pattern. As we can see Most of the Superficial part of the brain ie. Cortex , subcortical white matter shown in green color atre drained by cortical vein ( including VOT) and sss. Central core brain structures ie basal ganglia , thalami , lat and 3rd ventricles and most of corona radiate are drained by deep venous system ie. ICB , VOG & SS. Transverse sinus and vein of labbe drain the posterior temporal and inferior parietal lobe as shown in yellow color . Sp and cv
#131 Lateral MIP image from CE MRV shows major component of deep venous system.
1 is the thalamostraite vein , 2 is septal vein 3rd is the internal cerebral vein , 4 is the basal vein of Rosenthal 5 th is the VOG
#136 c/o 35 year old women presented with severe headache for 5 days . Axial T1 wi shows isointense thrombus in left sigmoid sinus
Which appears hypointense on T2wi s/o acute left sigmoid sinus thrombusis
#137 Frontal mip image from coronal TOF MR venography shows lack of flow in distal portion of left transverse sinusand sigmoid sinius
#138 Subacute thrombus appears hyper on all sequences…..
Clot signal in chronic dst is variable and depends on organization of clot…..
LONG STANDING DST MAY DEVELOP SIGNIFICANT COLLATERAL FORMATION THROUGHT MEDULLARY VEINS WHICH IS SEEN AS SQIGGLY PARENCHYMAL
#139 T2 * SWI shows innumerable prominent tortuous corkscrew squiggly medullary veins throughout both cerebral hemisphers . Venous DSA shows that distal SSS is occluded while proximal and mid seg are patent . Numourous enlarged medullary veins appears to hang in space . This is chronic SSS thrombosis with medullary collateral draingae
#145 Here is a c/o superficial venous thrombosis. T2* GRE image shows lineaer hypointensity in right paracentral sulcus ( short arrow)due to magnatic succeptility effect at the site of thrombosed vein. Hypointense area shows corresponding AREAS OF cortical hemorrhage ( long arrow). On T1 wi only swollen gyri are seen.
#146 This is a c/o VOT thrombosis.Axial T1wi Mri BRAIN shows T1 hyperintensity in post central gyrus , typical site for VOT s/o thrombosis and SWI shows blooming in the region of thrombosed vdein
#147 Saggital view MR venography image shows non visualization of vein of tolard
#148 Case of young women presented with seizure and altered mental status .T1 wi shows sublte “ dot sign” of T1 hyperintensity within a small cortical vein , within expected location of vein of labbe. T2 hyperintense area of mass effect involving left temporal lobe grey and white matter
#149 T1 post contrast image show heterogenous enhancement within . AXIAL MR VENOGRPAHY confirms suspicioun of left transverse sinus thrombosis . No vein of labbe is visible on left and see the normal vein of labbe on right.
#151 Axial graphic depicts deep venous occlusion with thrombosis of ICV , VOG and hemorrhage in both the rthalamus. Note the engorgement of medullarty veins
#152 AXIAL FLAIR image show extensive signal abnormalities within both thalaMI extending into caudate nuclei .
Saggital 2d phase contrastt MR venogram shows no signal from the portion of deep venous system s/o thrombosis
#156 This image shows a single dominant perforating artery fromP1 segment as compared to normal in which multiple small perforating branches supply the thamus and midbrain
#158 This is a c/o AOP INFARCTION . Axial DWI images shows diffusion restriction in bilateral paramedian thalamic and midbrain region – consistent with acute infarct.
#159 LOCKED IN SYNDROME IS ALSO CALLED PSEUDOCOMA IN WHICH THE AFFECTED PT IS AWAKE AND CONCIOUS BUT IS PARALYZED AND VOICELESS .
#160 Reformatted 3DMRA image demonstrate occlusion of the basilar artry in A pt with acute bilateral central infarct.
#162 Here is an example of a young patient presenting with severe acute neck pain SHOWING left ICA dissection ON T2wi AS crescentric shaped hyperintense intramural hematoma causing expansion of the artery. However there is no narrowing of ICA lumen
#163 Another example showing circumferential intramural hematoma seen bilaterally causing expansion of the bilateral ICA . There is narrowed lumen of the right ICA and open lumen of the left ICA
#164 Here is MR Angiography of cervical region showing narrowing & abnormal contour of the of the left vertebral artery causing cerebellar tonsilar infarction on left side.
#165 Simultaneous small acute infarcts in multiple different vascular distribution…………..most commonly emboli is cardiac in origin
Clinically silent , they convey risk of subsequent stroke
#166 Diffusion wi shows multiple foci od hyperintensities in both the cerebral hemisphere and in multiple vascular territories..cortical , subcortical and deep regions are affected. Restriction is confirmed on ADC maps , indicating this represents acute infarcts. The distribution raises concern for central embolic source such as cardiac source.