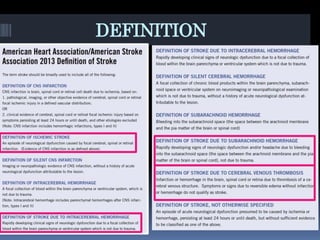
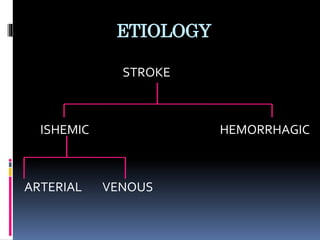
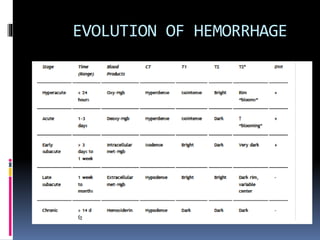
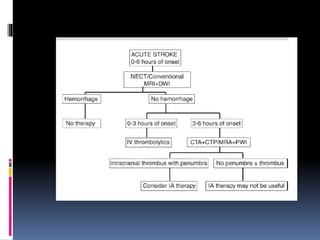
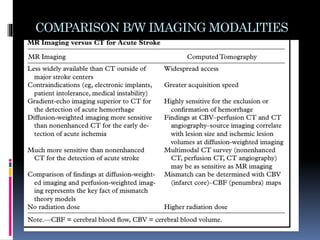
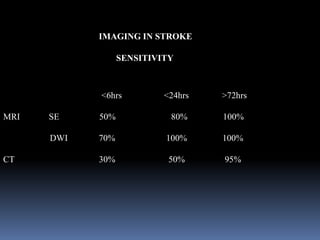
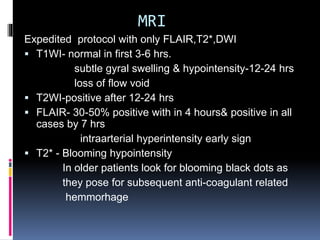
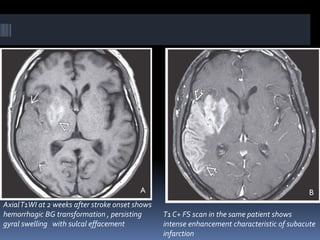
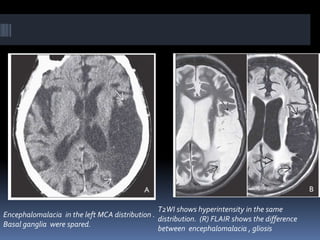
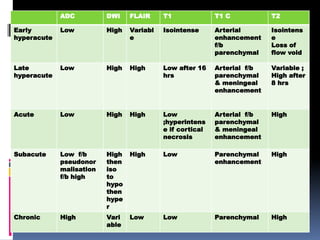
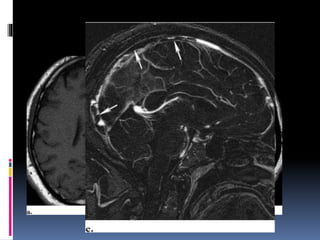
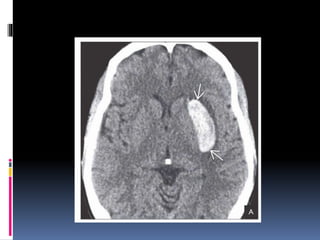
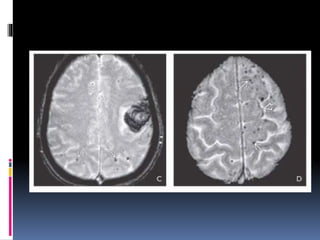
IMAGING IN
STROKE
DEFINITION
ETIOLOGY
STROKE
ISHEMIC HEMORRHAGIC
ARTERIAL VENOUS
EVOLUTION OF HEMORRHAGE
ARTERIAL ISCHEMIC STROKE
 ASCO phenotypic system.
 TOAST classification system.
 In acute stroke, there is a
central, irreversibly infarcted
tissue core surrounded by a
peripheral region of stunned
cells called the penumbra
that receives a collateral
blood supply from uninjured
arterial and leptomeningeal
territories .
 The cells in the penumbra
are potentially salvageable
with early recanalization.
CHRONOLOGY OF STROKE
 Early hyperacute-0-6 hrs
 Late hyperacute-6-24 hrs
 Acute-24 hrs-1 week
 Subacute -1-3 weeks
 Chronic -> 3weeks
 CBV is defined as the volume of blood in a given amount of
brain tissue, most commonly milliliters of blood per 100 g of
brain tissue.
 CBF is defined as the volume of blood passing through a
given amount of brain tissue per unit of time, most commonly
milliliters of blood per minute per 100g of brain tissue.
 Mean transit time (MTT) corresponds to the average time,
in seconds, that red blood cells spend within a determinate
volume of capillary circulation.
 MTT = cerebral blood volume (CBV) / cerebral blood flow
IMAGING MODALITIES
 Computed tomography,
 Magnetic Resonance Imaging,
 Duplex sonography.
COMPARISON B/W IMAGING MODALITIES
IMAGING IN STROKE
<6hrs <24hrs >72hrs
MRI SE 50% 80% 100%
DWI 70% 100% 100%
CT 30% 50% 95%
SENSITIVITY
GOALS OF IMAGING
 Parenchyma
 Pipes
 Perfusion
 Penumbra
NECT
CT Angiography
Perfusion CT & CT angiography
HYPER ACUTE & ACUTE STROKE
 In 50-60% cases imaging helps
NECT-
 Dense MCA sign
 Blurring with indistinctness of GM-WM junction
 Insular ribbon sign
 Disappearing basal ganglia sign
 Wedge shaped parenchymal hypodensity with
indistinct GM-WM borders & sulcal effacement
 Malignant MCA infarct
ASPECTS infarct scoring system
 Two NECT slices
 Ten regions
 One point is detected for each area involved
 <7 indicates > 1/3 MCA territory.
CECT- Intravascular enhancement is noticed
CT Angiography-
 To assess intra& extra cranial circulation for occlusion
 Triple rule out
p CT –CBV,CBF,MTT are calculated
 Color coding is done based on perfusion
 Well perfused GM- red/yellow, WM- blue
 Ishemia – blue/ purple
 Non perfused – black
 For MTT, the slower the transit time the closer to the red end of
the scale
CTA shows an abrupt “cutoff” with a meniscus of contrast in the
proximal left MCA. Contrast in the distal M2 and M3 segments is
caused by slow retrograde collateral flow from pial branches of
the ACA across the watershed to M4 (cortical) branches .
NECT shows hypodensity of the right basal ganglia compared to the normal.
pCT was performed CBV shows markedly reduced blood volume in the right basal
ganglia compared to the normal left side .
CBV in the cortex overlying the basal ganglia infarct appears relatively normal.
MRI
Expedited protocol with only FLAIR,T2*,DWI
 T1WI- normal in first 3-6 hrs.
subtle gyral swelling & hypointensity-12-24 hrs
loss of flow void
 T2WI-positive after 12-24 hrs
 FLAIR- 30-50% positive with in 4 hours& positive in all
cases by 7 hrs
intraarterial hyperintensity early sign
 T2* - Blooming hypointensity
In older patients look for blooming black dots as
they pose for subsequent anti-coagulant related
hemmorhage
 DWI- Positive in > 95% cases within minutes
Hyperintense on DWI
Hypointense on ADC mapping
Mismatch between FLAIR & DWI – PENUMBRA
DWI negative strokes
 p MR - for at risk penumbra.
 DSA- For patients undergoing intraarterial thrombolysis or
mechanical thrombectomy.
SUBACUTE STROKE
 2 days - 2 weeks
 Increased edema , mass effect , hemorrhagic transformation
occurs
NECT- Wedge shaped hypodensity becomes well defined
Mass effect increases & then decreases with in 7-
10 days
Hemorrhagic transformation is seen as gyriform or
Cortical or basal ganglia hyperintensity -HT
CECT- 2-2-2 rule
patchy or gyriform hyperintensity at 2 days peaks
at 2 weeks disappears at 2 months
MRI-
T1WI-hypointensity (NH) or isointensity(HT) + mass effect +
sulcal effacement
T2WI- Hyperintensity to isointensity ( T2 fogging effect)
FLAIR-Hyperintensity.
T2*-blooming foci in HT
T1C+ - Leptomeningeal enhancement
DWI-restriction with hyperintensity on DWI & hypointensity on
ADC which gradually reverses.
DD:
 Neoplasms – no restriction on DWI & do not regress with
time
 Infections –no defined vascular distribution
FLAIR (left) and GRE (right) in the same case show HT in this example of subacute
stroke
AxialT1WI at 2 weeks after stroke onset shows
hemorrhagic BG transformation , persisting
gyral swelling with sulcal effacement
T1 C+ FS scan in the same patient shows
intense enhancement characteristic of subacute
infarction
CHRONIC INFARCTS
Volume loss with gliosis
 NECT- Well defined wedge shaped hypodensity that
involves both the GM & WM confined to the vascular
territory of the involved artery
Ipsilateral sulci are prominent & ventricle may be
dilated
 CECT- non enhancing
 MRI- CSF equivalent signal intensity on all
sequences with gliosis being hyperintense on FLAIR
& ADC
Encephalomalacia in the left MCA distribution .
Basal ganglia were spared.
T2WI shows hyperintensity in the same
distribution. (R) FLAIR shows the difference
between encephalomalacia , gliosis
MULTIPLE EMBOLIC INFARCTS
 Involves terminal cortical branches
 GM-WM interface most commonly effected
IMAGING
NECT:
 Low attenuation foci in wedge shaped distribution.
 Calcification in atherosclerotic emboli.
 Hemorrhage in septic infarcts.
CECT:
 Multiple ring enhancing lesions.
MRI:
 Multiple peripheral T2/FLAIR hyperintensities.
 Blooming on T2* sequences.
 Multiple punctate enhancing foci on T1C+.
 Small peripheral foci of diffusion restriction in
several different vascular distributions on DWI.
NECT scan in a patient with infected mitral valve, decreasing mental status shows 2
hemorrhagic foci at the GM-WM junctions of both occipital lobes. (Right) Scan
through the corona radiata shows additional hemorrhagic foci .
Findings suggest multiple septic emboli.
DWI shows multiple foci of restricted diffusion at the GM-WM junctions of both
hemispheres.
LACUNAR INFARCTS
 Secondary to lipohyalinosis & atherosclerotic occlusion of
perforating branches that arise from the circle of Willis &
peropheral cortical arteries
 Most commonly seen around the basal ganglia,thalami,
internal capsule, deep cerebral white matter & pons.
IMAGING FINDINGS
 Acute infarcts (< 1 week) may not be visible on NECT
 Chronic lacunae may appear as well-defined CSF like
holes .
 Acute lacunae may be visible only on T2W images.
 On T1W decreased signal intensity & on T2W increased
signal intensity is noted.
 On FLAIR fluid is suppressed where as the peripheral
gliosis gives a higher signal intensity
 Blooming is noticed on T2* if associated with chronic
hypertension.
 Acute lacunar infarcts restrict on DWI & may enhance on
T1C+.
Axial T1WI in a 43-year-old woman with a long history of drug abuse shows
multiple hypointensities in the basal ganglia, thalami, and deep cerebral white
matter .
Axial T2WI in the same patient demonstrates the characteristic hyperintensity
and irregular shape of typical lacunar infarcts
FLAIR scan in the same patient shows that older lacunae suppress
completely whereas more recent lesions have a hyperintense rim of gliotic
tissue surrounding a hypointense center that is not yet completely CSF-
like.
T2* GRE scan shows no evidence of hemorrhage
WATERSHED INFARCTS
 Occur at the junction between the two nonanastamosing
distal arterial distributions
External watershed zones:
 Frontal cortex( b/w ACA & PCA junction)
 Parietoocipital cortex ( b/w MCA & PCA junction)
 Paramedian subcortical white matter near the vertex.
Internal watershed zones:
 Junction b/w penetrating branches & major cerebral
vessels.
Axial FLAIR scan demonstrates typical findings of bilateral external (cortical)
watershed infarcts
Nearly symmetric confluent and punctate deep white matter hyperintensities
are seen above and behind the lateral ventricles .
FLAIR scan just above the previous image shows distinct bilateral rosary-like
white matter hyperintensities
ADC DWI FLAIR T1 T1 C T2
Early
hyperacute
Low High Variabl
e
Isointense Arterial
enhancement
f/b
parenchymal
Isointens
e
Loss of
flow void
Late
hyperacute
Low High High Low after 16
hrs
Arterial f/b
parenchymal
& meningeal
enhancement
Variable ;
High after
8 hrs
Acute Low High High Low
;hyperintens
e if cortical
necrosis
Arterial f/b
parenchymal
& meningeal
enhancement
High
Subacute Low f/b
pseudonor
malisation
f/b high
High
then
iso
to
hypo
then
hype
r
High Low Parenchymal
enhancement
High
Chronic High Vari
able
Low Low Parenchymal High
VENOUS INFARCT
 Secondary to venous obstruction which may be due to
cerebral venous thrombosis(M.C) ,trauma ,post surgical
ligation.
 Increased venous pressure due to any cause leads to
vasogenic edema ,if the process continues it may lead to
arterial infarction.
THROMBOSED AREA INFARCTED AREA
Sagittal sinus Para sagittal area
Labbe s vein Temporal lobe
Deep venous system B/L or U/L involvement of
thalami , basal ganglia ,
internal capsule
IMAGING MODALITIES
 CT
 MRI
CT:
 30% sensitive
NECT
 Hyperdensity of involved vein – cord sign
 Thrombosis of posteior portion of SSS –filled delta
sign/ dense triangle sign
 Ishemic area that crosses the arterial territory ,
involvement of subcortical area with sparing of cortical
areas with or with out hemorrhagic component .
CECT
 Enhancement of the dural lining with the filling defect.
 Central hypodensity due to slow or absent flow surrounded
by contrast enhancement in posterior aspect of SSS-
EMPTY DELTA SIGN
CT VENOGRAPHY:
 Direct visualization of thrombus as filling defect.
CORD SIGN
MRI
 Loss of flow void which is best depicted on T2,FLAIR.
 MR venography
Age T1 T2/FLAIR Other s
Acute Isointense Hypointense Enlarged & convex
margins
Subacute Hyperintense Hyperintense
Chronic Isointense Isointense Collateral drainage
Dura-arachnoid
thickening
ACUTE THROMBUS IN RT TS
SUBACUTE STAGE
HEMORRHAGIC STROKE
 Spontaneous (nontraumatic) primary intracranial
hemorrhage (pICH) causes about 15% of strokes.
GOALS OF IMAGING:
1. Detect & locate the bleed.
2. Age the bleed.
3. Determine the underlying etiology
ARTERIAL INFARCT VENOUS INFARCT
Don’t cross arterial territories Crosses arterial territory
Involves both grey & white matter Spares grey
HYPERTENSIVE ICH
 Acute manifestation of nontraumatic ICH secondary to
systemic hypertension (HTN)
 The putamen/external capsule (striatocapsular
hemorrhages) is MC f/b thalamus,pons & cerebellum
 Lobar hemorrhages-5-10%.
CEREBRALAMYLOIDANGIOPATHY
 1% of all strokes and 15-20% of primary intracranial bleeds
in patients over the age of 60 years.
 Mean age at onset is 73 years.
 Patients with CAA are usually normotensive and moderately
demented.
 Distribution of hemorrhages in CAA is typically lobar and
peripheral.
SUMMARY
 Imaging plays a key role in diagnosing the stroke
 It also plays a key role in guiding the further management.
 MRI is more sensitive than CT in detecting the early changes
which are often subtle on CT.
 Expedite MRI protocol which includes FLAIR ,T2*,DWI will
answer the all questions needed in an acute settting.
THANK YOU

Imaging in stroke

  • 1.
  • 2.
  • 3.
  • 4.
  • 5.
    ARTERIAL ISCHEMIC STROKE ASCO phenotypic system.  TOAST classification system.
  • 6.
     In acutestroke, there is a central, irreversibly infarcted tissue core surrounded by a peripheral region of stunned cells called the penumbra that receives a collateral blood supply from uninjured arterial and leptomeningeal territories .  The cells in the penumbra are potentially salvageable with early recanalization.
  • 7.
    CHRONOLOGY OF STROKE Early hyperacute-0-6 hrs  Late hyperacute-6-24 hrs  Acute-24 hrs-1 week  Subacute -1-3 weeks  Chronic -> 3weeks
  • 10.
     CBV isdefined as the volume of blood in a given amount of brain tissue, most commonly milliliters of blood per 100 g of brain tissue.  CBF is defined as the volume of blood passing through a given amount of brain tissue per unit of time, most commonly milliliters of blood per minute per 100g of brain tissue.  Mean transit time (MTT) corresponds to the average time, in seconds, that red blood cells spend within a determinate volume of capillary circulation.  MTT = cerebral blood volume (CBV) / cerebral blood flow
  • 11.
    IMAGING MODALITIES  Computedtomography,  Magnetic Resonance Imaging,  Duplex sonography.
  • 12.
  • 13.
    IMAGING IN STROKE <6hrs<24hrs >72hrs MRI SE 50% 80% 100% DWI 70% 100% 100% CT 30% 50% 95% SENSITIVITY
  • 14.
    GOALS OF IMAGING Parenchyma  Pipes  Perfusion  Penumbra NECT CT Angiography Perfusion CT & CT angiography Perfusion CT & CT angiography
  • 15.
    HYPER ACUTE &ACUTE STROKE  In 50-60% cases imaging helps NECT-  Dense MCA sign  Blurring with indistinctness of GM-WM junction  Insular ribbon sign  Disappearing basal ganglia sign  Wedge shaped parenchymal hypodensity with indistinct GM-WM borders & sulcal effacement  Malignant MCA infarct
  • 20.
    ASPECTS infarct scoringsystem  Two NECT slices  Ten regions  One point is detected for each area involved  <7 indicates > 1/3 MCA territory.
  • 23.
    CECT- Intravascular enhancementis noticed CT Angiography-  To assess intra& extra cranial circulation for occlusion  Triple rule out p CT –CBV,CBF,MTT are calculated  Color coding is done based on perfusion  Well perfused GM- red/yellow, WM- blue  Ishemia – blue/ purple  Non perfused – black  For MTT, the slower the transit time the closer to the red end of the scale
  • 24.
    CTA shows anabrupt “cutoff” with a meniscus of contrast in the proximal left MCA. Contrast in the distal M2 and M3 segments is caused by slow retrograde collateral flow from pial branches of the ACA across the watershed to M4 (cortical) branches .
  • 26.
    NECT shows hypodensityof the right basal ganglia compared to the normal. pCT was performed CBV shows markedly reduced blood volume in the right basal ganglia compared to the normal left side . CBV in the cortex overlying the basal ganglia infarct appears relatively normal.
  • 28.
    MRI Expedited protocol withonly FLAIR,T2*,DWI  T1WI- normal in first 3-6 hrs. subtle gyral swelling & hypointensity-12-24 hrs loss of flow void  T2WI-positive after 12-24 hrs  FLAIR- 30-50% positive with in 4 hours& positive in all cases by 7 hrs intraarterial hyperintensity early sign  T2* - Blooming hypointensity In older patients look for blooming black dots as they pose for subsequent anti-coagulant related hemmorhage
  • 29.
     DWI- Positivein > 95% cases within minutes Hyperintense on DWI Hypointense on ADC mapping Mismatch between FLAIR & DWI – PENUMBRA DWI negative strokes  p MR - for at risk penumbra.  DSA- For patients undergoing intraarterial thrombolysis or mechanical thrombectomy.
  • 32.
    SUBACUTE STROKE  2days - 2 weeks  Increased edema , mass effect , hemorrhagic transformation occurs NECT- Wedge shaped hypodensity becomes well defined Mass effect increases & then decreases with in 7- 10 days Hemorrhagic transformation is seen as gyriform or Cortical or basal ganglia hyperintensity -HT
  • 33.
    CECT- 2-2-2 rule patchyor gyriform hyperintensity at 2 days peaks at 2 weeks disappears at 2 months MRI- T1WI-hypointensity (NH) or isointensity(HT) + mass effect + sulcal effacement T2WI- Hyperintensity to isointensity ( T2 fogging effect) FLAIR-Hyperintensity.
  • 34.
    T2*-blooming foci inHT T1C+ - Leptomeningeal enhancement DWI-restriction with hyperintensity on DWI & hypointensity on ADC which gradually reverses. DD:  Neoplasms – no restriction on DWI & do not regress with time  Infections –no defined vascular distribution
  • 36.
    FLAIR (left) andGRE (right) in the same case show HT in this example of subacute stroke
  • 37.
    AxialT1WI at 2weeks after stroke onset shows hemorrhagic BG transformation , persisting gyral swelling with sulcal effacement T1 C+ FS scan in the same patient shows intense enhancement characteristic of subacute infarction
  • 38.
    CHRONIC INFARCTS Volume losswith gliosis  NECT- Well defined wedge shaped hypodensity that involves both the GM & WM confined to the vascular territory of the involved artery Ipsilateral sulci are prominent & ventricle may be dilated  CECT- non enhancing  MRI- CSF equivalent signal intensity on all sequences with gliosis being hyperintense on FLAIR & ADC
  • 39.
    Encephalomalacia in theleft MCA distribution . Basal ganglia were spared. T2WI shows hyperintensity in the same distribution. (R) FLAIR shows the difference between encephalomalacia , gliosis
  • 40.
    MULTIPLE EMBOLIC INFARCTS Involves terminal cortical branches  GM-WM interface most commonly effected IMAGING NECT:  Low attenuation foci in wedge shaped distribution.  Calcification in atherosclerotic emboli.  Hemorrhage in septic infarcts. CECT:  Multiple ring enhancing lesions.
  • 41.
    MRI:  Multiple peripheralT2/FLAIR hyperintensities.  Blooming on T2* sequences.  Multiple punctate enhancing foci on T1C+.  Small peripheral foci of diffusion restriction in several different vascular distributions on DWI.
  • 42.
    NECT scan ina patient with infected mitral valve, decreasing mental status shows 2 hemorrhagic foci at the GM-WM junctions of both occipital lobes. (Right) Scan through the corona radiata shows additional hemorrhagic foci . Findings suggest multiple septic emboli. DWI shows multiple foci of restricted diffusion at the GM-WM junctions of both hemispheres.
  • 43.
    LACUNAR INFARCTS  Secondaryto lipohyalinosis & atherosclerotic occlusion of perforating branches that arise from the circle of Willis & peropheral cortical arteries  Most commonly seen around the basal ganglia,thalami, internal capsule, deep cerebral white matter & pons.
  • 44.
    IMAGING FINDINGS  Acuteinfarcts (< 1 week) may not be visible on NECT  Chronic lacunae may appear as well-defined CSF like holes .  Acute lacunae may be visible only on T2W images.  On T1W decreased signal intensity & on T2W increased signal intensity is noted.  On FLAIR fluid is suppressed where as the peripheral gliosis gives a higher signal intensity  Blooming is noticed on T2* if associated with chronic hypertension.  Acute lacunar infarcts restrict on DWI & may enhance on T1C+.
  • 45.
    Axial T1WI ina 43-year-old woman with a long history of drug abuse shows multiple hypointensities in the basal ganglia, thalami, and deep cerebral white matter . Axial T2WI in the same patient demonstrates the characteristic hyperintensity and irregular shape of typical lacunar infarcts
  • 46.
    FLAIR scan inthe same patient shows that older lacunae suppress completely whereas more recent lesions have a hyperintense rim of gliotic tissue surrounding a hypointense center that is not yet completely CSF- like. T2* GRE scan shows no evidence of hemorrhage
  • 47.
    WATERSHED INFARCTS  Occurat the junction between the two nonanastamosing distal arterial distributions External watershed zones:  Frontal cortex( b/w ACA & PCA junction)  Parietoocipital cortex ( b/w MCA & PCA junction)  Paramedian subcortical white matter near the vertex. Internal watershed zones:  Junction b/w penetrating branches & major cerebral vessels.
  • 49.
    Axial FLAIR scandemonstrates typical findings of bilateral external (cortical) watershed infarcts
  • 50.
    Nearly symmetric confluentand punctate deep white matter hyperintensities are seen above and behind the lateral ventricles . FLAIR scan just above the previous image shows distinct bilateral rosary-like white matter hyperintensities
  • 51.
    ADC DWI FLAIRT1 T1 C T2 Early hyperacute Low High Variabl e Isointense Arterial enhancement f/b parenchymal Isointens e Loss of flow void Late hyperacute Low High High Low after 16 hrs Arterial f/b parenchymal & meningeal enhancement Variable ; High after 8 hrs Acute Low High High Low ;hyperintens e if cortical necrosis Arterial f/b parenchymal & meningeal enhancement High Subacute Low f/b pseudonor malisation f/b high High then iso to hypo then hype r High Low Parenchymal enhancement High Chronic High Vari able Low Low Parenchymal High
  • 52.
    VENOUS INFARCT  Secondaryto venous obstruction which may be due to cerebral venous thrombosis(M.C) ,trauma ,post surgical ligation.  Increased venous pressure due to any cause leads to vasogenic edema ,if the process continues it may lead to arterial infarction.
  • 53.
    THROMBOSED AREA INFARCTEDAREA Sagittal sinus Para sagittal area Labbe s vein Temporal lobe Deep venous system B/L or U/L involvement of thalami , basal ganglia , internal capsule
  • 54.
  • 56.
    CT:  30% sensitive NECT Hyperdensity of involved vein – cord sign  Thrombosis of posteior portion of SSS –filled delta sign/ dense triangle sign  Ishemic area that crosses the arterial territory , involvement of subcortical area with sparing of cortical areas with or with out hemorrhagic component .
  • 57.
    CECT  Enhancement ofthe dural lining with the filling defect.  Central hypodensity due to slow or absent flow surrounded by contrast enhancement in posterior aspect of SSS- EMPTY DELTA SIGN CT VENOGRAPHY:  Direct visualization of thrombus as filling defect.
  • 59.
  • 60.
    MRI  Loss offlow void which is best depicted on T2,FLAIR.  MR venography
  • 61.
    Age T1 T2/FLAIROther s Acute Isointense Hypointense Enlarged & convex margins Subacute Hyperintense Hyperintense Chronic Isointense Isointense Collateral drainage Dura-arachnoid thickening
  • 62.
  • 63.
  • 65.
    HEMORRHAGIC STROKE  Spontaneous(nontraumatic) primary intracranial hemorrhage (pICH) causes about 15% of strokes. GOALS OF IMAGING: 1. Detect & locate the bleed. 2. Age the bleed. 3. Determine the underlying etiology
  • 66.
    ARTERIAL INFARCT VENOUSINFARCT Don’t cross arterial territories Crosses arterial territory Involves both grey & white matter Spares grey
  • 67.
    HYPERTENSIVE ICH  Acutemanifestation of nontraumatic ICH secondary to systemic hypertension (HTN)  The putamen/external capsule (striatocapsular hemorrhages) is MC f/b thalamus,pons & cerebellum  Lobar hemorrhages-5-10%.
  • 68.
    CEREBRALAMYLOIDANGIOPATHY  1% ofall strokes and 15-20% of primary intracranial bleeds in patients over the age of 60 years.  Mean age at onset is 73 years.  Patients with CAA are usually normotensive and moderately demented.  Distribution of hemorrhages in CAA is typically lobar and peripheral.
  • 71.
    SUMMARY  Imaging playsa key role in diagnosing the stroke  It also plays a key role in guiding the further management.  MRI is more sensitive than CT in detecting the early changes which are often subtle on CT.  Expedite MRI protocol which includes FLAIR ,T2*,DWI will answer the all questions needed in an acute settting.
  • 72.