Download to read offline

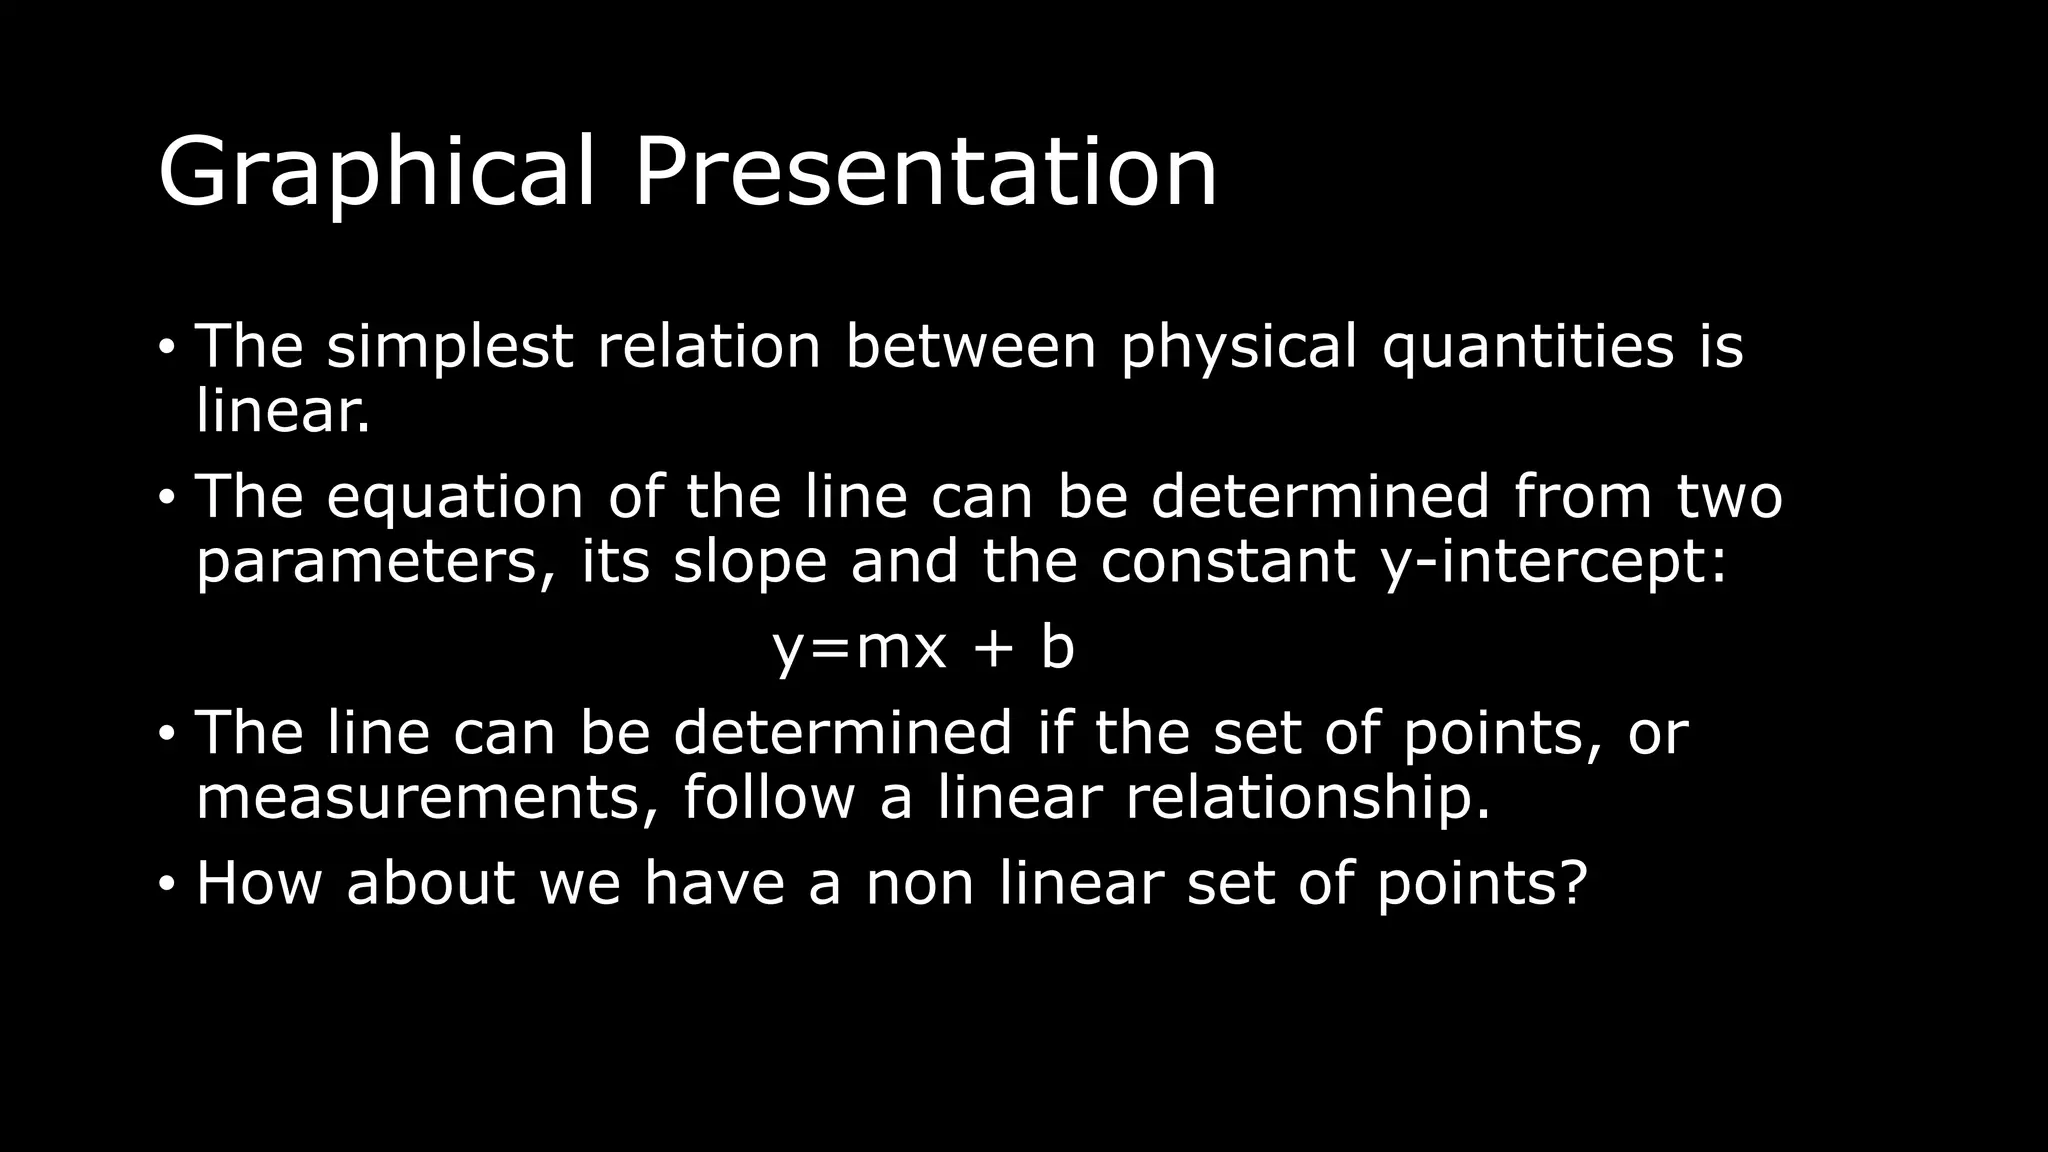
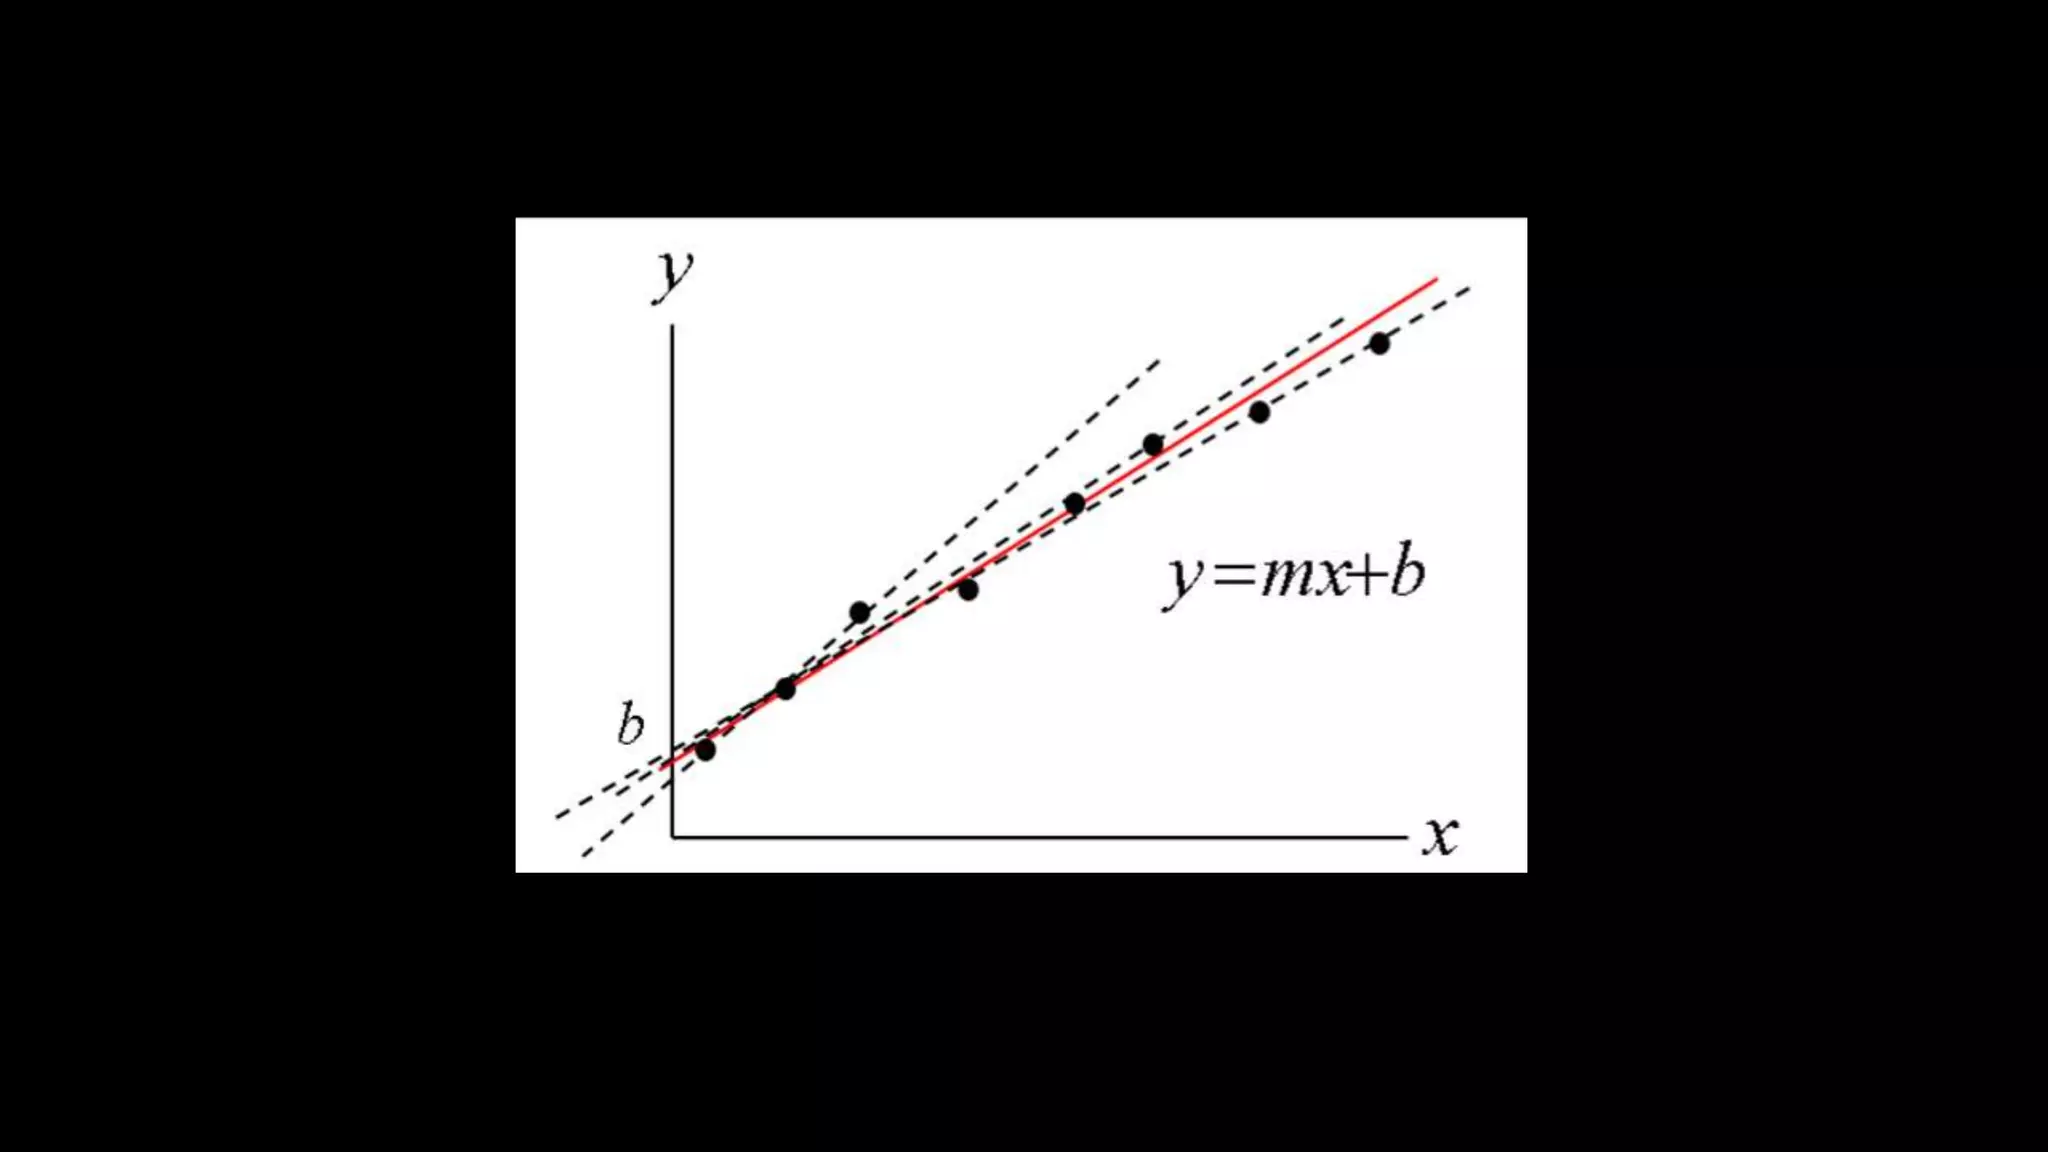
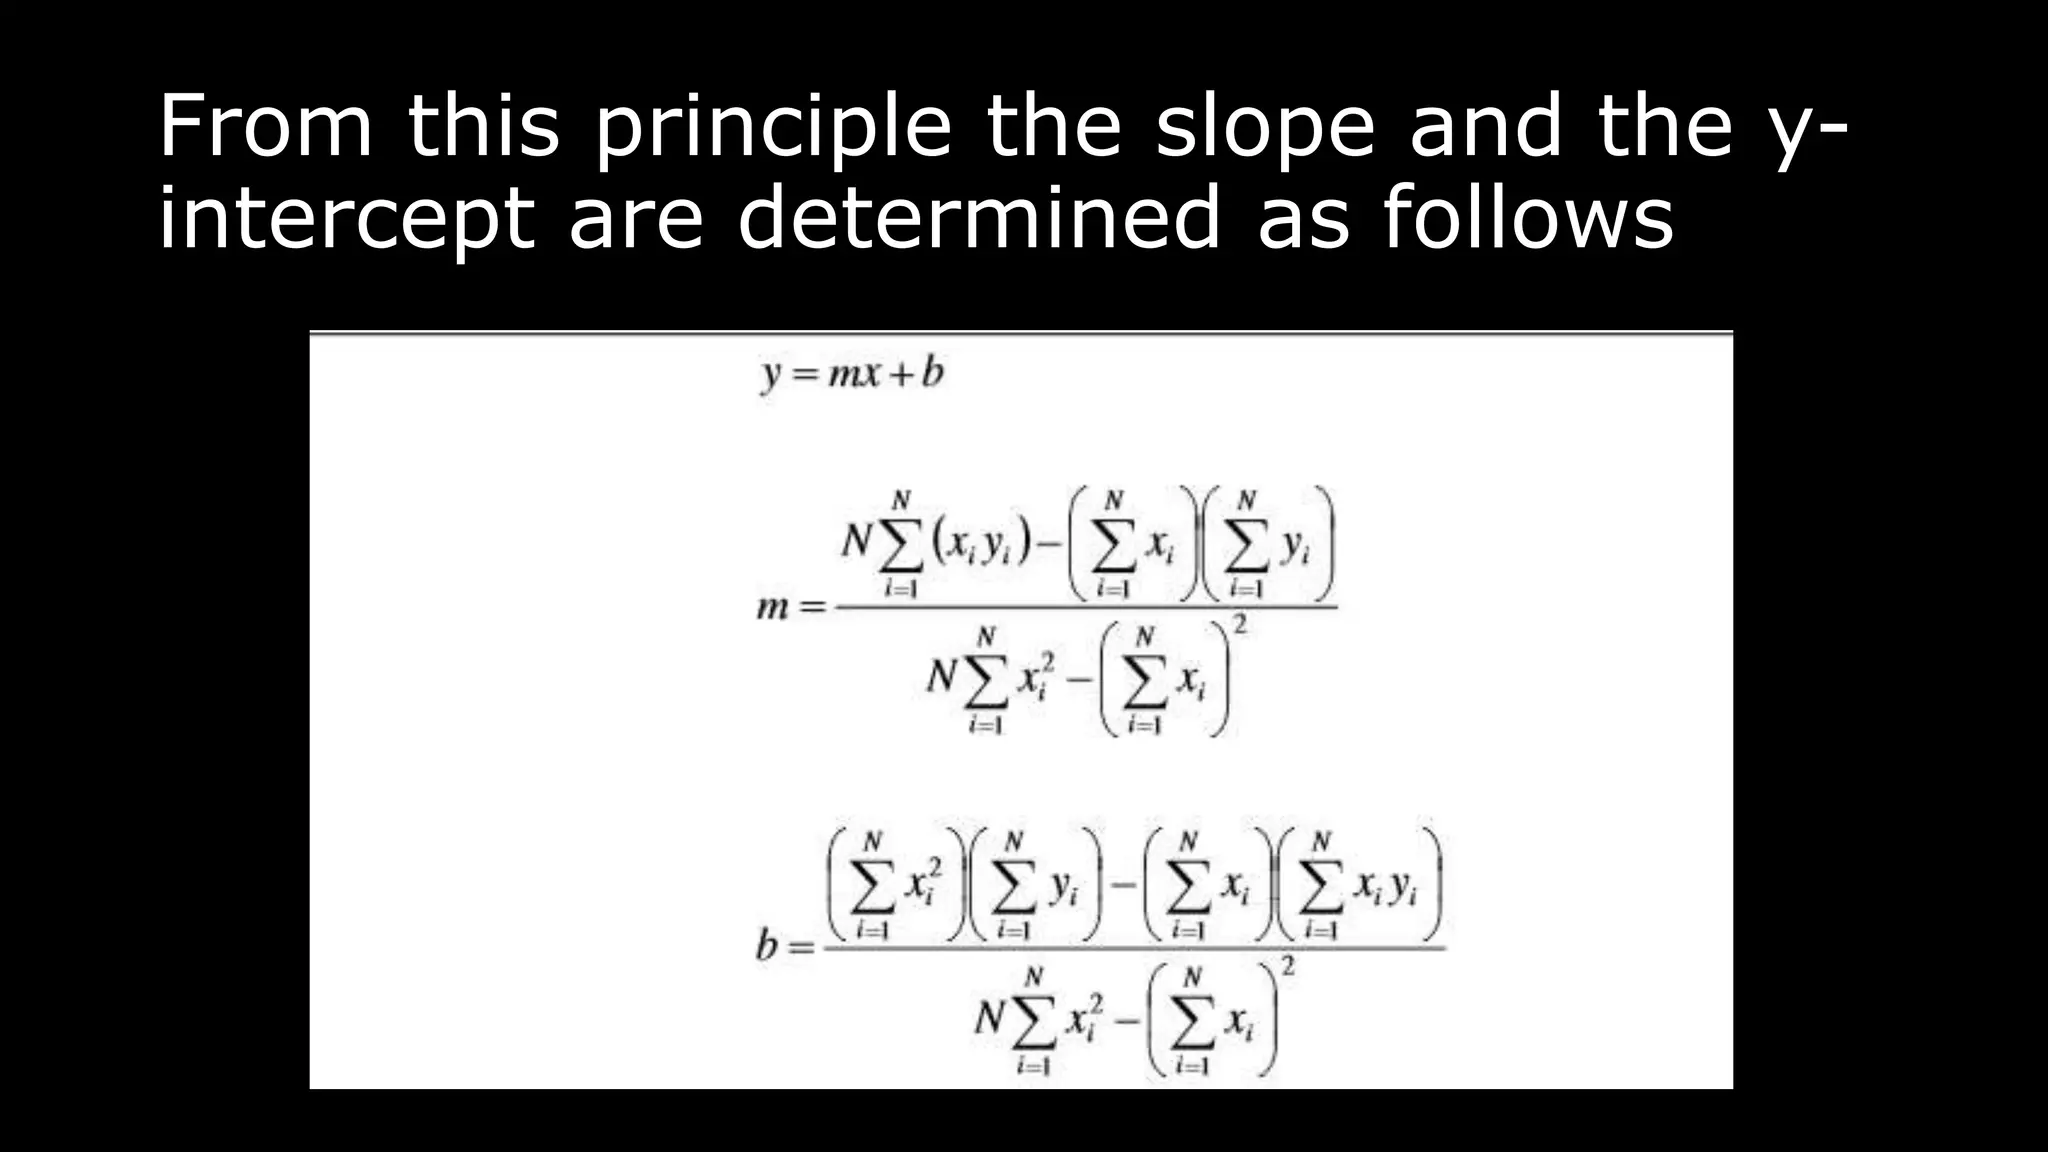

The document discusses graphical presentation and determining the best line of fit for data points. It explains that the simplest relationship between variables is linear and can be represented by the equation y=mx+b. For non-linear data points, the best fitting line minimizes the total distance to all points using the method of least squares, where the line that has the least sum of squared deviations is considered the best fit. The slope and y-intercept of this line can then be determined.