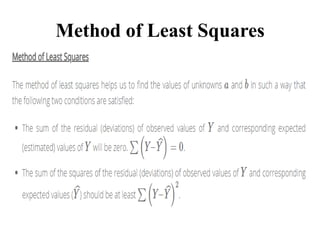
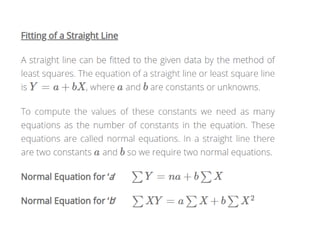
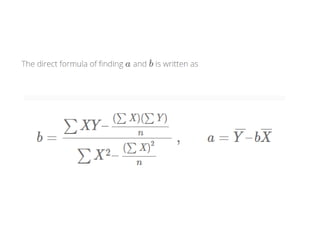
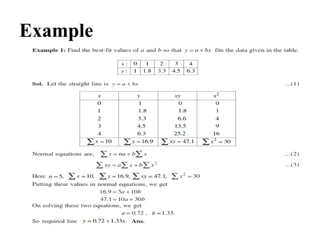
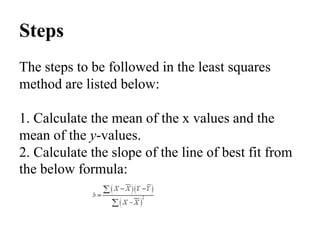
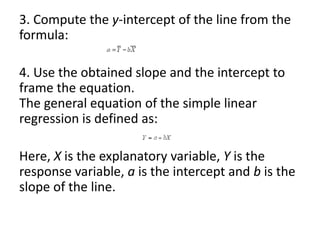
Curve Fitting
Dr. Liaquat Ahmad
Associate Professor/Chairman
Department of Statistics and Computer Science
Curve fitting
Curve fitting is the process of introducing
mathematical relationships between dependent and
independent variables in the form of an equation
for a given set of data.
The process of finding the equation of the curve of
best fit, which may be most suitable for predicting
the unknown values, is known as curve fitting.
Therefore, curve fitting means an exact
relationship between two variables by algebraic
equations. There are following methods for fitting
a curve.
I. Graphic method II. Method of group averages
III. Method of moments IV. Principle of least square.
Fitting A Straight Line
Fitting a straight line is a statistical procedure to
construct a straight line that best fits the series of
data points. The line of best fit can be roughly
drawn by a straight line on a scatter plot so that
the number of points that lie below the line and
above the line are equal and the line will pass
through as many points as probable. One of the
most accurate ways to find the best fit is the least
squares method.
Fitting A Straight Line
Construction of line of best fit is simple but it is
an important tool to shows the relationship
between the two given variables. The line of best
fit or the straight line constructed through the
points shows whether a correlation exists
between two variables and also helps to
determine whether there is any trend that occurs
within the data set. This line helps to predict the
future events based on the data studied. The
straight line for the provided data points can be
constructed either manually or using any
software which is easier.
Method of Least Squares
Example
Steps
The steps to be followed in the least squares
method are listed below:
1. Calculate the mean of the x values and the
mean of the y-values.
2. Calculate the slope of the line of best fit from
the below formula:
3. Compute the y-intercept of the line from the
formula:
4. Use the obtained slope and the intercept to
frame the equation.
The general equation of the simple linear
regression is defined as:
Here, X is the explanatory variable, Y is the
response variable, a is the intercept and b is the
slope of the line.

Curve Fitting detail explanation stat.pdf

  • 1.
    Curve Fitting Dr. LiaquatAhmad Associate Professor/Chairman Department of Statistics and Computer Science
  • 2.
    Curve fitting Curve fittingis the process of introducing mathematical relationships between dependent and independent variables in the form of an equation for a given set of data. The process of finding the equation of the curve of best fit, which may be most suitable for predicting the unknown values, is known as curve fitting. Therefore, curve fitting means an exact relationship between two variables by algebraic equations. There are following methods for fitting a curve. I. Graphic method II. Method of group averages III. Method of moments IV. Principle of least square.
  • 3.
    Fitting A StraightLine Fitting a straight line is a statistical procedure to construct a straight line that best fits the series of data points. The line of best fit can be roughly drawn by a straight line on a scatter plot so that the number of points that lie below the line and above the line are equal and the line will pass through as many points as probable. One of the most accurate ways to find the best fit is the least squares method.
  • 4.
    Fitting A StraightLine Construction of line of best fit is simple but it is an important tool to shows the relationship between the two given variables. The line of best fit or the straight line constructed through the points shows whether a correlation exists between two variables and also helps to determine whether there is any trend that occurs within the data set. This line helps to predict the future events based on the data studied. The straight line for the provided data points can be constructed either manually or using any software which is easier.
  • 5.
  • 8.
  • 9.
    Steps The steps tobe followed in the least squares method are listed below: 1. Calculate the mean of the x values and the mean of the y-values. 2. Calculate the slope of the line of best fit from the below formula:
  • 10.
    3. Compute they-intercept of the line from the formula: 4. Use the obtained slope and the intercept to frame the equation. The general equation of the simple linear regression is defined as: Here, X is the explanatory variable, Y is the response variable, a is the intercept and b is the slope of the line.