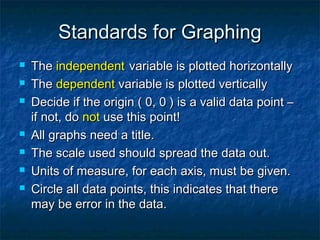
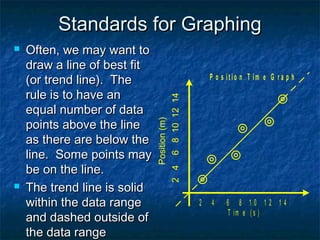
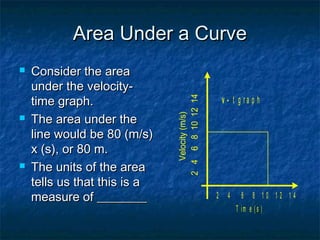
Drawing and Interpreting Graphs
GRADE 11 PHYSICS - SPH3UGRADE 11 PHYSICS - SPH3U
GraphingGraphing
 In science, we often perform experiments thatIn science, we often perform experiments that
result in the generation of data. By graphing theresult in the generation of data. By graphing the
data, we may be able to find a relationshipdata, we may be able to find a relationship
between the variables measured. We may alsobetween the variables measured. We may also
want to communicate our results with others . Inwant to communicate our results with others . In
order to do this, we must use a standard methodorder to do this, we must use a standard method
when plotting graphs.when plotting graphs.
Standards for GraphingStandards for Graphing
 TheThe independentindependent variable is plotted horizontallyvariable is plotted horizontally
 TheThe dependentdependent variable is plotted verticallyvariable is plotted vertically
 Decide if the origin ( 0, 0 ) is a valid data point –Decide if the origin ( 0, 0 ) is a valid data point –
if not, doif not, do notnot use this point!use this point!
 All graphs need a title.All graphs need a title.
 The scale used should spread the data out.The scale used should spread the data out.
 Units of measure, for each axis, must be given.Units of measure, for each axis, must be given.
 Circle all data points, this indicates that thereCircle all data points, this indicates that there
may be error in the data.may be error in the data.
Standards for GraphingStandards for Graphing
 This graph containsThis graph contains
circled data points,circled data points,
labeled axes, a title,labeled axes, a title,
units and a scaleunits and a scale
P o s it io n T im e G r a p h
2 4 6 8 1 0 1 2 1 4
Position(m)
2468101214
T im e ( s )
Standards for GraphingStandards for Graphing
 Often, we may want toOften, we may want to
draw a line of best fitdraw a line of best fit
(or trend line). The(or trend line). The
rule is to have anrule is to have an
equal number of dataequal number of data
points above the linepoints above the line
as there are below theas there are below the
line. Some points mayline. Some points may
be on the line.be on the line.
 The trend line is solidThe trend line is solid
within the data rangewithin the data range
and dashed outside ofand dashed outside of
the data rangethe data range
P o s it io n T im e G r a p h
2 4 6 8 1 0 1 2 1 4
Position(m)
2468101214
T im e ( s )
Standards for GraphingStandards for Graphing
 After creating our graph, we may want to use itAfter creating our graph, we may want to use it
to find values that are within the data range. Weto find values that are within the data range. We
call thiscall this interpolationinterpolation..
 If we want to find values outside of the dataIf we want to find values outside of the data
range, werange, we extrapolateextrapolate. This is where the dashed. This is where the dashed
line is.line is.
 Once the trend line is created, we no longerOnce the trend line is created, we no longer
make use of individual data points. Formake use of individual data points. For
example, the circled point (8,10) would beexample, the circled point (8,10) would be
replaced by point (8,8) – which is on the trendreplaced by point (8,8) – which is on the trend
line - point (8,10) is assumed to have error.line - point (8,10) is assumed to have error.
Other Types of RelationshipsOther Types of Relationships
y v e r s u s x
y
y = 1 /x
T h is is a n
in v e r s e
r e la t io n s h ip
b e t w e e n y a n d
x
x
x
y v e r s u s x
2 4 6 8 1 0 1 2 1 4
y
2468101214
y = a x 2
+ k
T h is is a
q u a d r a t ic
e q u a t io n
( s h a p e is a
p a r a b o la )
Area Under a CurveArea Under a Curve
 Consider the areaConsider the area
under the velocity-under the velocity-
time graph.time graph.
 The area under theThe area under the
line would be 80 (m/s)line would be 80 (m/s)
x (s), or 80 m.x (s), or 80 m.
 The units of the areaThe units of the area
tells us that this is atells us that this is a
measure of ________measure of ________
v - t g r a p h
2 4 6 8 1 0 1 2 1 4
Velocity(m/s)
2468101214
T im e ( s )
HomeworkHomework
 Handout (Handout (Page 767 from McGraw-Hill, Physics 11) #1-) #1-
3, use MS-Excel to graph 1,23, use MS-Excel to graph 1,2
 See File: Excel-Graph-Instructions for tips on how to use
Excel (found on class website)
 Read Section A6.5 (page 654) for linear equations and
slope of a line.
 Required Math Skills: Read pages 652-653Read pages 652-653
((Section A6.4 of Nelson Textbook). This is a review). This is a review
ofof required formulas, geometry andformulas, geometry and
trigonometry. (Ensure that you know these!)trigonometry. (Ensure that you know these!)

Grade 11, U0-L3-Graphing

  • 1.
    Drawing and InterpretingGraphs GRADE 11 PHYSICS - SPH3UGRADE 11 PHYSICS - SPH3U
  • 2.
    GraphingGraphing  In science,we often perform experiments thatIn science, we often perform experiments that result in the generation of data. By graphing theresult in the generation of data. By graphing the data, we may be able to find a relationshipdata, we may be able to find a relationship between the variables measured. We may alsobetween the variables measured. We may also want to communicate our results with others . Inwant to communicate our results with others . In order to do this, we must use a standard methodorder to do this, we must use a standard method when plotting graphs.when plotting graphs.
  • 3.
    Standards for GraphingStandardsfor Graphing  TheThe independentindependent variable is plotted horizontallyvariable is plotted horizontally  TheThe dependentdependent variable is plotted verticallyvariable is plotted vertically  Decide if the origin ( 0, 0 ) is a valid data point –Decide if the origin ( 0, 0 ) is a valid data point – if not, doif not, do notnot use this point!use this point!  All graphs need a title.All graphs need a title.  The scale used should spread the data out.The scale used should spread the data out.  Units of measure, for each axis, must be given.Units of measure, for each axis, must be given.  Circle all data points, this indicates that thereCircle all data points, this indicates that there may be error in the data.may be error in the data.
  • 4.
    Standards for GraphingStandardsfor Graphing  This graph containsThis graph contains circled data points,circled data points, labeled axes, a title,labeled axes, a title, units and a scaleunits and a scale P o s it io n T im e G r a p h 2 4 6 8 1 0 1 2 1 4 Position(m) 2468101214 T im e ( s )
  • 5.
    Standards for GraphingStandardsfor Graphing  Often, we may want toOften, we may want to draw a line of best fitdraw a line of best fit (or trend line). The(or trend line). The rule is to have anrule is to have an equal number of dataequal number of data points above the linepoints above the line as there are below theas there are below the line. Some points mayline. Some points may be on the line.be on the line.  The trend line is solidThe trend line is solid within the data rangewithin the data range and dashed outside ofand dashed outside of the data rangethe data range P o s it io n T im e G r a p h 2 4 6 8 1 0 1 2 1 4 Position(m) 2468101214 T im e ( s )
  • 6.
    Standards for GraphingStandardsfor Graphing  After creating our graph, we may want to use itAfter creating our graph, we may want to use it to find values that are within the data range. Weto find values that are within the data range. We call thiscall this interpolationinterpolation..  If we want to find values outside of the dataIf we want to find values outside of the data range, werange, we extrapolateextrapolate. This is where the dashed. This is where the dashed line is.line is.  Once the trend line is created, we no longerOnce the trend line is created, we no longer make use of individual data points. Formake use of individual data points. For example, the circled point (8,10) would beexample, the circled point (8,10) would be replaced by point (8,8) – which is on the trendreplaced by point (8,8) – which is on the trend line - point (8,10) is assumed to have error.line - point (8,10) is assumed to have error.
  • 7.
    Other Types ofRelationshipsOther Types of Relationships y v e r s u s x y y = 1 /x T h is is a n in v e r s e r e la t io n s h ip b e t w e e n y a n d x x x y v e r s u s x 2 4 6 8 1 0 1 2 1 4 y 2468101214 y = a x 2 + k T h is is a q u a d r a t ic e q u a t io n ( s h a p e is a p a r a b o la )
  • 8.
    Area Under aCurveArea Under a Curve  Consider the areaConsider the area under the velocity-under the velocity- time graph.time graph.  The area under theThe area under the line would be 80 (m/s)line would be 80 (m/s) x (s), or 80 m.x (s), or 80 m.  The units of the areaThe units of the area tells us that this is atells us that this is a measure of ________measure of ________ v - t g r a p h 2 4 6 8 1 0 1 2 1 4 Velocity(m/s) 2468101214 T im e ( s )
  • 9.
    HomeworkHomework  Handout (Handout(Page 767 from McGraw-Hill, Physics 11) #1-) #1- 3, use MS-Excel to graph 1,23, use MS-Excel to graph 1,2  See File: Excel-Graph-Instructions for tips on how to use Excel (found on class website)  Read Section A6.5 (page 654) for linear equations and slope of a line.  Required Math Skills: Read pages 652-653Read pages 652-653 ((Section A6.4 of Nelson Textbook). This is a review). This is a review ofof required formulas, geometry andformulas, geometry and trigonometry. (Ensure that you know these!)trigonometry. (Ensure that you know these!)
  • 10.
    HomeworkHomework  Handout (Handout(Page 767 from McGraw-Hill, Physics 11) #1-) #1- 3, use MS-Excel to graph 1,23, use MS-Excel to graph 1,2  See File: Excel-Graph-Instructions for tips on how to use Excel (found on class website)  Read Section A6.5 (page 654) for linear equations and slope of a line.  Required Math Skills: Read pages 652-653Read pages 652-653 ((Section A6.4 of Nelson Textbook). This is a review). This is a review ofof required formulas, geometry andformulas, geometry and trigonometry. (Ensure that you know these!)trigonometry. (Ensure that you know these!)