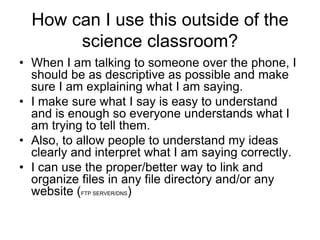
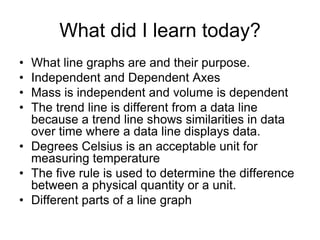
Blog Entries
    By:
      Pranay Gupta
11-15-11
Quantitative Data
   Analysis
What did I learn today?
• I should use labels and answer what is being ask in the
  question.
• I learned to always be specific to what quantities you use
  so that your reader knows what units you are talking about.
• You use the delta mark to show difference of values.
  Also, Subtraction is Final Value – Initial Value = Answer.
• I know you need to know and understand all values in order
  to answer a question
• You need to know what the terms being used in the
  question mean in order to accurately answer what is being
  asked.
• I also learned how to use delta and how to correctly
  write/type it
• How to properly organize files in a directory or computer.
How did I learn it?
• I learned to answer the question specifically, use labels, understand
  the question and how to accurately answer the question.
• This I learned by analyzing a paper in class.
• We analyzed the Pros and Cons of the answer.
• We realized that being specific is extremely important and using
  correct values and definitions plays a major role in answer questions
  in a science class.
• Showing us the parts done incorrectly, a standard for quality work
  was set.
• We were given explanation of what you should do and what you
  shouldn’t do when a question is asked through deep analysis of
  answers of our classmates.
• I learned it by looking at our answers in 4.1 and how Eva described
  clock reading and position in her data table.
• I learned what physical quantities and units are.
• By overlooking our mistakes on our group’s blog.
How did I use it in class?
• I analyzed my paper that I did and made sure I didn’t
  make any mistakes and answer everything specifically
  and accurately.
• I made sure all my units were correctly labeled and I
  understood all the terms mentioned in the question and
  overview.
• I can use physical quantities and units to find units for
  items such as medicine or cooking items (Consumer
  Foods class).
• I can find patterns in real life like Eva did while observing
  the motion of the ball.
• I used the organization technique with two other
  websites I made.
How can I use this outside of the
       science classroom?
• When I am talking to someone over the phone, I
  should be as descriptive as possible and make
  sure I am explaining what I am saying.
• I make sure what I say is easy to understand
  and is enough so everyone understands what I
  am trying to tell them.
• Also, to allow people to understand my ideas
  clearly and interpret what I am saying correctly.
• I can use the proper/better way to link and
  organize files in any file directory and/or any
  website (FTP SERVER/DNS)
11-16-11

Line Graphs
What did I learn today?
• What line graphs are and their purpose.
• Independent and Dependent Axes
• Mass is independent and volume is dependent
• The trend line is different from a data line
  because a trend line shows similarities in data
  over time where a data line displays data.
• Degrees Celsius is an acceptable unit for
  measuring temperature
• The five rule is used to determine the difference
  between a physical quantity or a unit.
• Different parts of a line graph
How did I learn it?
• Studying the line graph given to us in class on
  the worksheet.
• Deeply locking and understand the line graph
  parts and details.
• The interactive learning course which Mr.
  Thomas guided us through.
• The Guidelines given to us.
• The explanations that were presented to us in
  class and the expectations were set for quality
  work.
How did I use it in class?
• I can understand line graphs better now in
  class.
• I can accurately make and organize line
  graphs the correct way
• I can read and analyze data in a line graph
  with great detail
• I can also see trends in data by creating a
  line graph
How can I use this outside of the
       science classroom?
• I will be able to read line graphs for various
  types of data displayed in the form of a line
  graph.
• I can look a stock graph or a diverse population
  line graph.
• I can tell the difference between a trend line and
  a data line.
• I can find similarities between data types and
  displays.
• Almost always, I can use my knowledge to make
  and determine the purpose of a line graph.
11-17-11
Applying Line
  Graphs
What did I learn today?
• How to use our understanding of line
  graphs to make a line graph.
• Applying our knowledge from 3.2 and
  recreate a similar experiment in 4.3.
• Line Graphs can show various data types.
How did I learn it?
• We performed a similar experiment in 4.3 as we
  did in 3.2.
• We stacked three books on top of each other
  and led a ramp down.
• We rolled a ball down the ramp and dropped a
  sandbag at the position at which the ball was
  every second.
• We recorded out data and measured the
  distance traveled by the ball using a meter stick
  where the sandbags were dropped every
  second.
How did I use it in class?
• I used my data table to plot points on a line
  graph.
• I used my previous knowledge of increments,
  intervals, axes and trend lines to display my data
• Line Graphs can be used to show relationships
  (Time vs Position) or patterns(2 cm/second)
• They show data (visually) in a way that you can
  understand it with great detail and analyze it
  better than a data table (a bunch of numbers)
How can I use it outside the
         science classroom?
• If I experiment again, my data can be shown on
  a line graph to be albe to identify trends, rise in
  data, drop in data, or any other patterns.
• If I am given a line graph, I can find trends,
  relationships, independent and dependant
  variables.
• I can use line graphs to show (position vs time)
  relativity or recurring trends and/or data.
• I can understand changes in stock markets or
  my GPA using the graphs provided to me (rise,
  drop or no change).
11-18-11
 Applying what we
  learned about line
graphs to experiments
What did I learn today?
• I learned to use line graphs to determine
  patterns and make inferences.
• I learned that if tick marks are not at equal
  distance apart, your line graph could be
  considered misleading and you will not be
  able to find accurate patterns.
• I learned that you need to use a ruler to
  make a line graph
How did I learn it?
• I made a graph in class and analyzed it
  with the rubric and expectations.
• We analyzed group 1’s graph and realized
  what we shouldn't do.
• We should not make our own intervals of
  our data points as it messes up our graph.
• You need to overlook you graph and data
  and see if they match.
How did I use it in class?
• I fixed our group’s graph putting a data table into
  the graph.
• I used it on my homework to make an accurate
  line graph with eqaully distances tick marks and
  staright lines made with a ruler.
• I italicized the t and the x in the labels.
• I made sure my data table was in my graph at
  the top right hand corner and it showed every
  data point I plotted.
How can I use it outside the
        science classroom?
• I can determine if a graph is misleading
  when I see one.
• Be careful of advertisers who make their
  graphs misleading to grab more attention.
• I will not make misleading graphs and will
  be able to analyze them more effectively.
11-21-11
 Applying what we
  learned about line
graphs to experiments
What did I learn today?
• I learned that make many types line graphs but
  data points are always plotted in the same way.
• I also learned that if we can graph any type of
  data on a line graph then we can determine
  many different kinds of trends and patterns.
• A data line has to be accurate and identifiable so
  readers can determine the proper patterns and
  formations.
How did I learn it?
• We learned that we have to have arrows
  on the dependable axis since the data is
  variant and can be used in different
  methods.
• Mr.Thomas showed us misrakes in our
  group’s graph and we realized how much
  change a inaccurate line can bring to
  patterns.
How did I use it in class?
• I made my graphs data lines and points
  accurate and identifiable so people can
  use my data correctly.
• I corrected our group’s graph to make it
  accurate and look better (visually)
How can I use it outside the
       science classroom?
• I can determine patterns in a graph and
  understand graphs better and more
  efficiently.
• I learned to determine mistakes and avoid
  them to understand a visual display of
  data (line graph)
11-22-11
Using what we looked
 at to apply to line
       graphs
What did I learn today?
• I learned how a graph would look like depending
  on it's distance traveled over time.
• I learned what displacement is used for.
• Direction, magnitude, and units 3 sections that
  make a physical quantity
• I also learned what a path length is
• The unit we will usually always use for class is
  meters
• the difference between a coordinate plane and a
  line graph and what a bar graph is.
How did I learn it?
• I learned it by applying previous
  knowledge to understand the topic that
  was given to us beforehand.
How did I use it in class?
• I used meters to identify postions/distance.
• I used it so that I know to identify graphs
  on a quiz or a worksheet.
• Direction, magnitude, and units can help
  me label the graph and show changes in
  position.
• I can use displacement when I am creating
  a data table.
How can I use it outside the
        science classroom?
• I can use my understanding of graphs to
  improve them even more.
• I know the correct definitions of terms and
  the difference between other graphs so I
  can label everything correctly
  without making a mistake.
• I know to analyze data using physical
  quantities and its 3 parts.
11-28-11
What did I learn today?
• I learned to look at graphs without labels
  and identify the data being shown.
• I learned to formulate our own labels
  depending on what we understand about
  the graph.
How did I learn it?
• Learning what to do in 4.5 and formulating
  the labels and data in 4.5
How did I use it in class?
• I did 4.5 and identified the labels.
• I used my previous knowledge to identify
  patterns and speed calculations
  (meters/second)
• I can use a data line and make a graph
  using my understanding.
How can I use it outside the
        science classroom?
• I can construct a fully functional graph out
  of a data line without labels.
• I can identify patterns without looking at
  numerical values labeled in a graph.
• Idtify patterns faster and more efficently.
11-29-11
  Revising Models
using Data Analysis
What did I learn today?
•   We learned about the four basic types of models.
•   Mental Models- Use words
•   Mathematical Models- Use math
•   Physical Models- Physical objects that explain the relationship
    between things
•   Computer Models- Uses many different mathematical models and
    mental models
•   We also learned that the Learning Cycle is Data Analysis Identify
    Patterns Creating Models How Test Prediction.
•   An object was move towards the origin and there are two origins
    Time Origin and Position Origin.
•   A data line can have an increasing or decreasing speed while
    moving in a negative or positive direction.
•   A graph can have many different visual representations for one data
    set and can have different orientations to view the data.
How did I learn it?
• I learned it when we analyzed the graphs
  in 5.2
• We tested our class model for 4.5 and
  they were proved to be too general
How did I use it in class?
• I formulated a better explanation and
  model for 5.2 and I made my model not
  too general or too specific.
• I replicated a better understanding of the
  idea of models and how there are many
  types.
How can I use it outside the
        science classroom?
• I can formulate a better understanding if
  the object is moving towards the origin or
  away from it in a negative or positive
  direction.
• I can determine if an object is decreasing
  speed or increasing speed based on my
  new model (revised in 5.2)

Blog Entries

  • 1.
    Blog Entries By: Pranay Gupta
  • 2.
  • 3.
    What did Ilearn today? • I should use labels and answer what is being ask in the question. • I learned to always be specific to what quantities you use so that your reader knows what units you are talking about. • You use the delta mark to show difference of values. Also, Subtraction is Final Value – Initial Value = Answer. • I know you need to know and understand all values in order to answer a question • You need to know what the terms being used in the question mean in order to accurately answer what is being asked. • I also learned how to use delta and how to correctly write/type it • How to properly organize files in a directory or computer.
  • 4.
    How did Ilearn it? • I learned to answer the question specifically, use labels, understand the question and how to accurately answer the question. • This I learned by analyzing a paper in class. • We analyzed the Pros and Cons of the answer. • We realized that being specific is extremely important and using correct values and definitions plays a major role in answer questions in a science class. • Showing us the parts done incorrectly, a standard for quality work was set. • We were given explanation of what you should do and what you shouldn’t do when a question is asked through deep analysis of answers of our classmates. • I learned it by looking at our answers in 4.1 and how Eva described clock reading and position in her data table. • I learned what physical quantities and units are. • By overlooking our mistakes on our group’s blog.
  • 5.
    How did Iuse it in class? • I analyzed my paper that I did and made sure I didn’t make any mistakes and answer everything specifically and accurately. • I made sure all my units were correctly labeled and I understood all the terms mentioned in the question and overview. • I can use physical quantities and units to find units for items such as medicine or cooking items (Consumer Foods class). • I can find patterns in real life like Eva did while observing the motion of the ball. • I used the organization technique with two other websites I made.
  • 6.
    How can Iuse this outside of the science classroom? • When I am talking to someone over the phone, I should be as descriptive as possible and make sure I am explaining what I am saying. • I make sure what I say is easy to understand and is enough so everyone understands what I am trying to tell them. • Also, to allow people to understand my ideas clearly and interpret what I am saying correctly. • I can use the proper/better way to link and organize files in any file directory and/or any website (FTP SERVER/DNS)
  • 7.
  • 8.
    What did Ilearn today? • What line graphs are and their purpose. • Independent and Dependent Axes • Mass is independent and volume is dependent • The trend line is different from a data line because a trend line shows similarities in data over time where a data line displays data. • Degrees Celsius is an acceptable unit for measuring temperature • The five rule is used to determine the difference between a physical quantity or a unit. • Different parts of a line graph
  • 9.
    How did Ilearn it? • Studying the line graph given to us in class on the worksheet. • Deeply locking and understand the line graph parts and details. • The interactive learning course which Mr. Thomas guided us through. • The Guidelines given to us. • The explanations that were presented to us in class and the expectations were set for quality work.
  • 10.
    How did Iuse it in class? • I can understand line graphs better now in class. • I can accurately make and organize line graphs the correct way • I can read and analyze data in a line graph with great detail • I can also see trends in data by creating a line graph
  • 11.
    How can Iuse this outside of the science classroom? • I will be able to read line graphs for various types of data displayed in the form of a line graph. • I can look a stock graph or a diverse population line graph. • I can tell the difference between a trend line and a data line. • I can find similarities between data types and displays. • Almost always, I can use my knowledge to make and determine the purpose of a line graph.
  • 12.
  • 13.
    What did Ilearn today? • How to use our understanding of line graphs to make a line graph. • Applying our knowledge from 3.2 and recreate a similar experiment in 4.3. • Line Graphs can show various data types.
  • 14.
    How did Ilearn it? • We performed a similar experiment in 4.3 as we did in 3.2. • We stacked three books on top of each other and led a ramp down. • We rolled a ball down the ramp and dropped a sandbag at the position at which the ball was every second. • We recorded out data and measured the distance traveled by the ball using a meter stick where the sandbags were dropped every second.
  • 15.
    How did Iuse it in class? • I used my data table to plot points on a line graph. • I used my previous knowledge of increments, intervals, axes and trend lines to display my data • Line Graphs can be used to show relationships (Time vs Position) or patterns(2 cm/second) • They show data (visually) in a way that you can understand it with great detail and analyze it better than a data table (a bunch of numbers)
  • 16.
    How can Iuse it outside the science classroom? • If I experiment again, my data can be shown on a line graph to be albe to identify trends, rise in data, drop in data, or any other patterns. • If I am given a line graph, I can find trends, relationships, independent and dependant variables. • I can use line graphs to show (position vs time) relativity or recurring trends and/or data. • I can understand changes in stock markets or my GPA using the graphs provided to me (rise, drop or no change).
  • 17.
    11-18-11 Applying whatwe learned about line graphs to experiments
  • 18.
    What did Ilearn today? • I learned to use line graphs to determine patterns and make inferences. • I learned that if tick marks are not at equal distance apart, your line graph could be considered misleading and you will not be able to find accurate patterns. • I learned that you need to use a ruler to make a line graph
  • 19.
    How did Ilearn it? • I made a graph in class and analyzed it with the rubric and expectations. • We analyzed group 1’s graph and realized what we shouldn't do. • We should not make our own intervals of our data points as it messes up our graph. • You need to overlook you graph and data and see if they match.
  • 20.
    How did Iuse it in class? • I fixed our group’s graph putting a data table into the graph. • I used it on my homework to make an accurate line graph with eqaully distances tick marks and staright lines made with a ruler. • I italicized the t and the x in the labels. • I made sure my data table was in my graph at the top right hand corner and it showed every data point I plotted.
  • 21.
    How can Iuse it outside the science classroom? • I can determine if a graph is misleading when I see one. • Be careful of advertisers who make their graphs misleading to grab more attention. • I will not make misleading graphs and will be able to analyze them more effectively.
  • 22.
    11-21-11 Applying whatwe learned about line graphs to experiments
  • 23.
    What did Ilearn today? • I learned that make many types line graphs but data points are always plotted in the same way. • I also learned that if we can graph any type of data on a line graph then we can determine many different kinds of trends and patterns. • A data line has to be accurate and identifiable so readers can determine the proper patterns and formations.
  • 24.
    How did Ilearn it? • We learned that we have to have arrows on the dependable axis since the data is variant and can be used in different methods. • Mr.Thomas showed us misrakes in our group’s graph and we realized how much change a inaccurate line can bring to patterns.
  • 25.
    How did Iuse it in class? • I made my graphs data lines and points accurate and identifiable so people can use my data correctly. • I corrected our group’s graph to make it accurate and look better (visually)
  • 26.
    How can Iuse it outside the science classroom? • I can determine patterns in a graph and understand graphs better and more efficiently. • I learned to determine mistakes and avoid them to understand a visual display of data (line graph)
  • 27.
    11-22-11 Using what welooked at to apply to line graphs
  • 28.
    What did Ilearn today? • I learned how a graph would look like depending on it's distance traveled over time. • I learned what displacement is used for. • Direction, magnitude, and units 3 sections that make a physical quantity • I also learned what a path length is • The unit we will usually always use for class is meters • the difference between a coordinate plane and a line graph and what a bar graph is.
  • 29.
    How did Ilearn it? • I learned it by applying previous knowledge to understand the topic that was given to us beforehand.
  • 30.
    How did Iuse it in class? • I used meters to identify postions/distance. • I used it so that I know to identify graphs on a quiz or a worksheet. • Direction, magnitude, and units can help me label the graph and show changes in position. • I can use displacement when I am creating a data table.
  • 31.
    How can Iuse it outside the science classroom? • I can use my understanding of graphs to improve them even more. • I know the correct definitions of terms and the difference between other graphs so I can label everything correctly without making a mistake. • I know to analyze data using physical quantities and its 3 parts.
  • 32.
  • 33.
    What did Ilearn today? • I learned to look at graphs without labels and identify the data being shown. • I learned to formulate our own labels depending on what we understand about the graph.
  • 34.
    How did Ilearn it? • Learning what to do in 4.5 and formulating the labels and data in 4.5
  • 35.
    How did Iuse it in class? • I did 4.5 and identified the labels. • I used my previous knowledge to identify patterns and speed calculations (meters/second) • I can use a data line and make a graph using my understanding.
  • 36.
    How can Iuse it outside the science classroom? • I can construct a fully functional graph out of a data line without labels. • I can identify patterns without looking at numerical values labeled in a graph. • Idtify patterns faster and more efficently.
  • 37.
    11-29-11 RevisingModels using Data Analysis
  • 38.
    What did Ilearn today? • We learned about the four basic types of models. • Mental Models- Use words • Mathematical Models- Use math • Physical Models- Physical objects that explain the relationship between things • Computer Models- Uses many different mathematical models and mental models • We also learned that the Learning Cycle is Data Analysis Identify Patterns Creating Models How Test Prediction. • An object was move towards the origin and there are two origins Time Origin and Position Origin. • A data line can have an increasing or decreasing speed while moving in a negative or positive direction. • A graph can have many different visual representations for one data set and can have different orientations to view the data.
  • 39.
    How did Ilearn it? • I learned it when we analyzed the graphs in 5.2 • We tested our class model for 4.5 and they were proved to be too general
  • 40.
    How did Iuse it in class? • I formulated a better explanation and model for 5.2 and I made my model not too general or too specific. • I replicated a better understanding of the idea of models and how there are many types.
  • 41.
    How can Iuse it outside the science classroom? • I can formulate a better understanding if the object is moving towards the origin or away from it in a negative or positive direction. • I can determine if an object is decreasing speed or increasing speed based on my new model (revised in 5.2)