Download to read offline

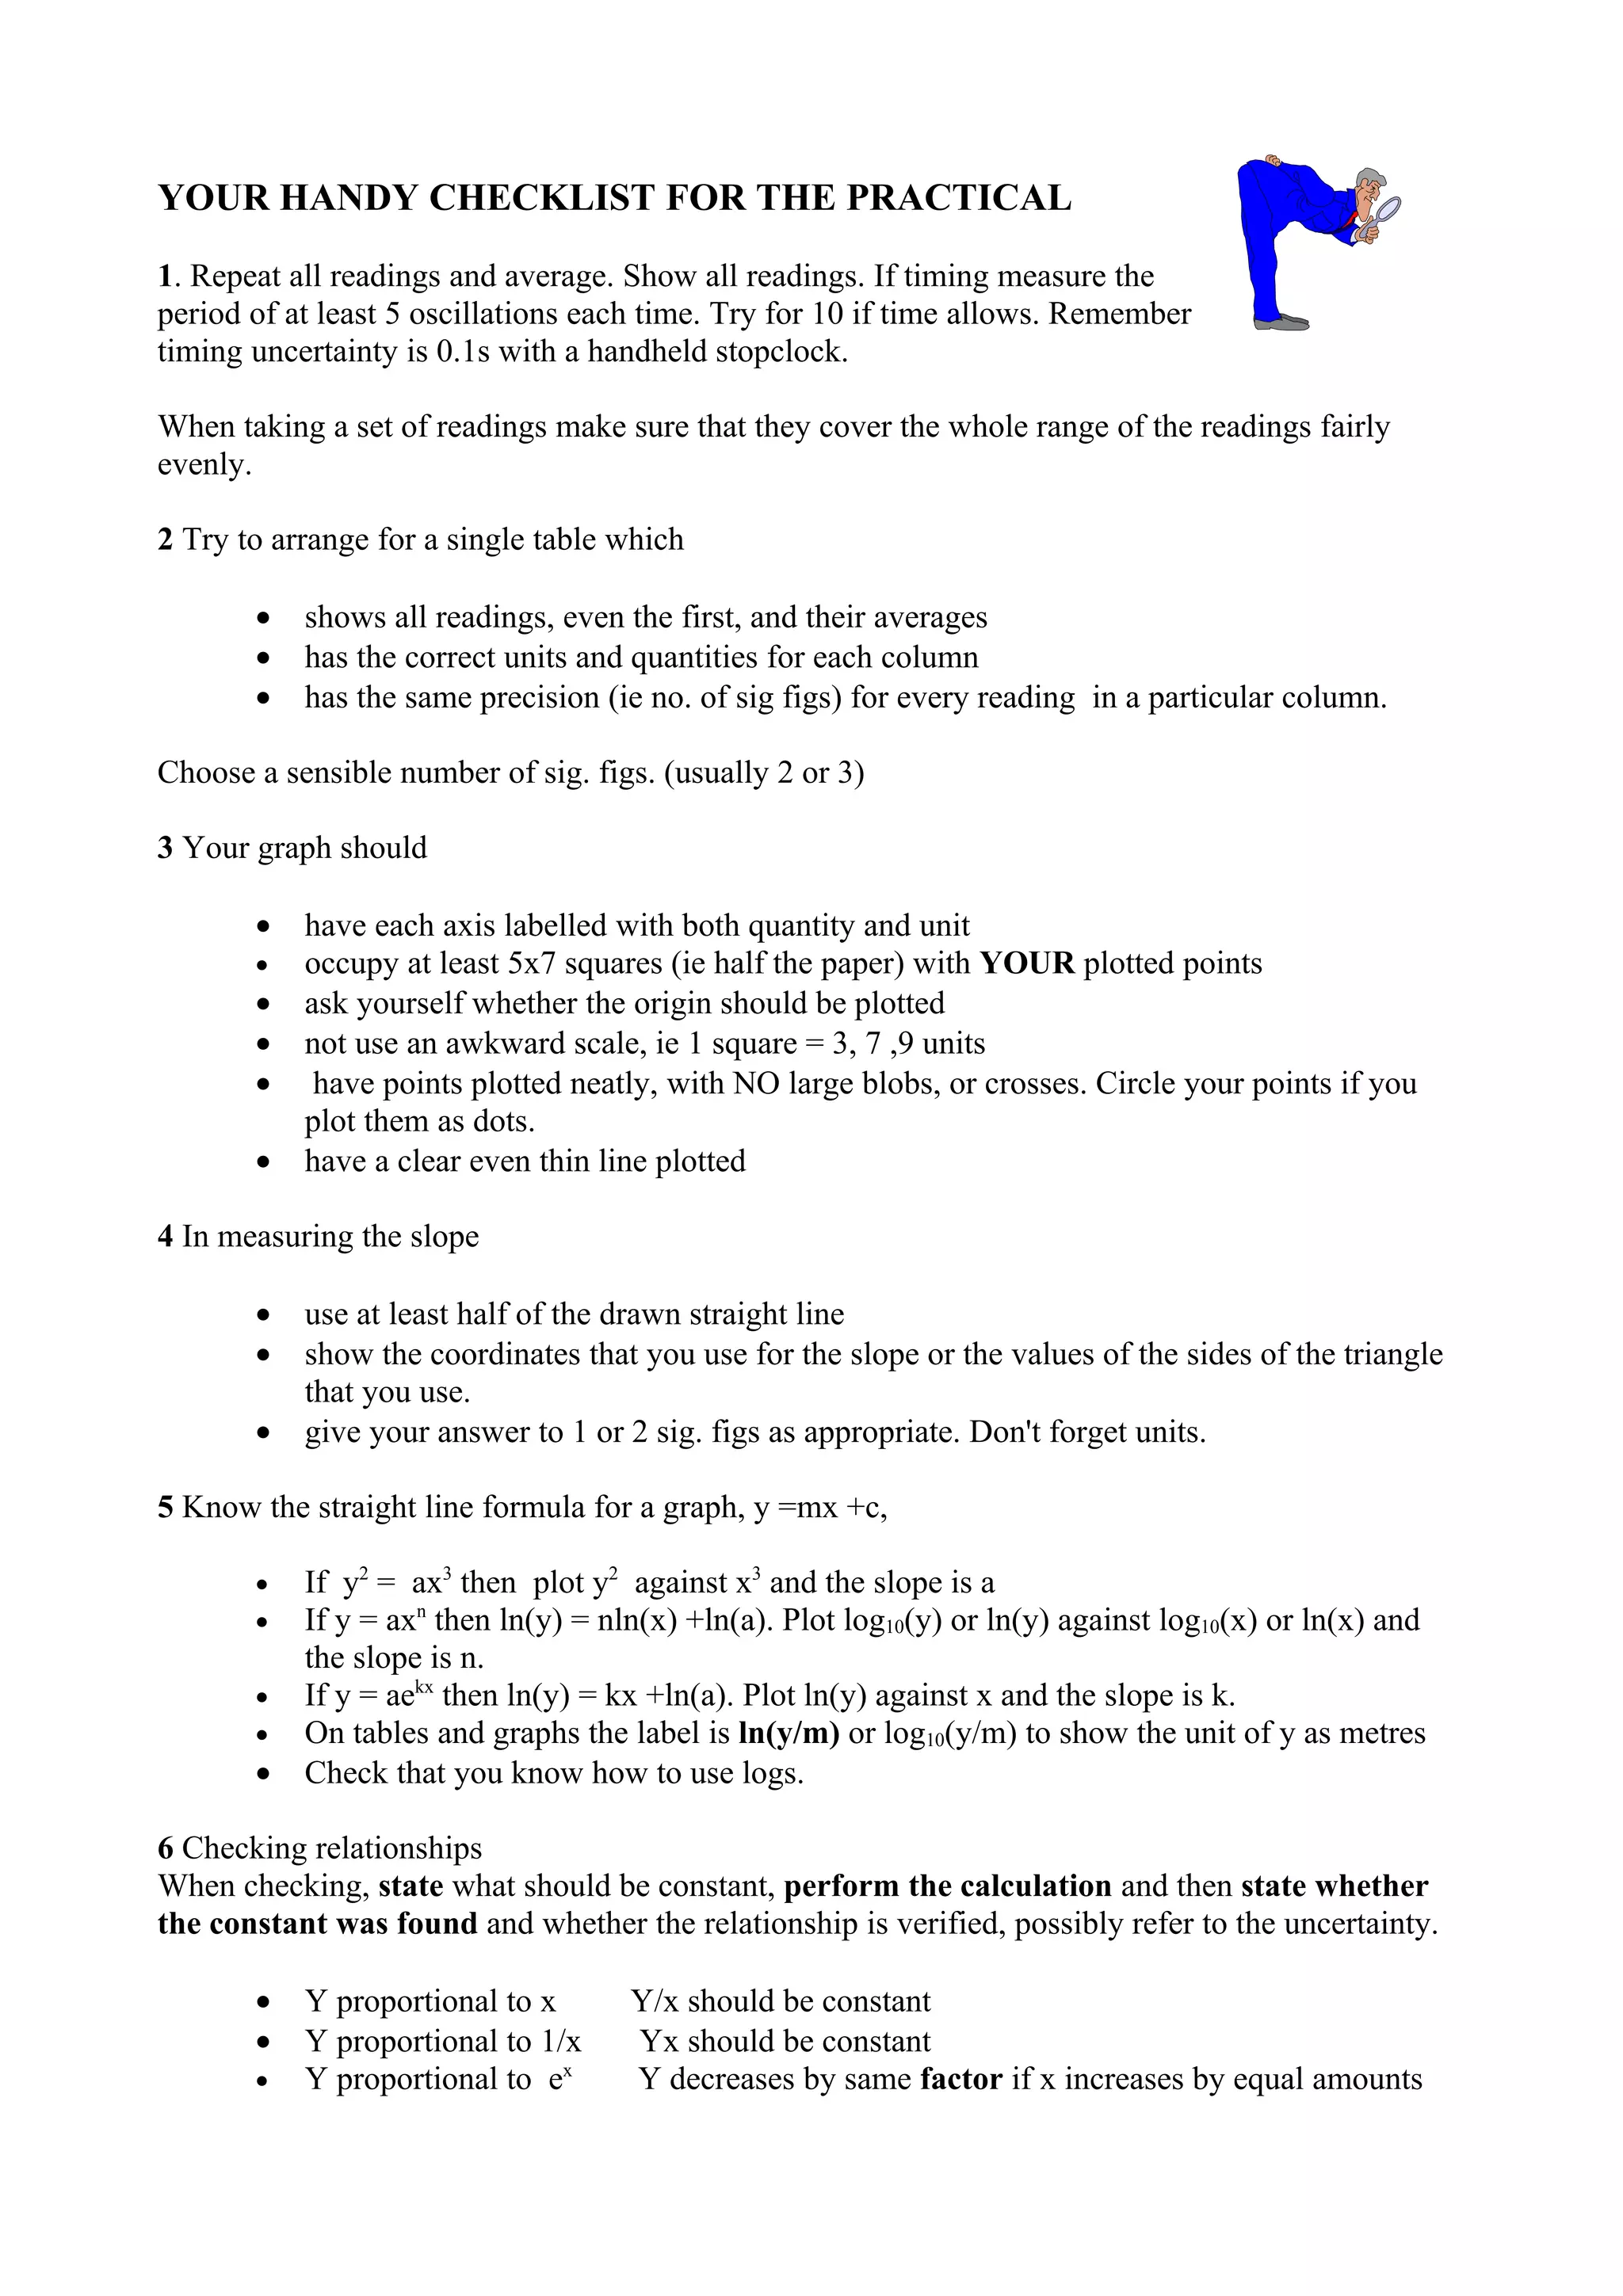
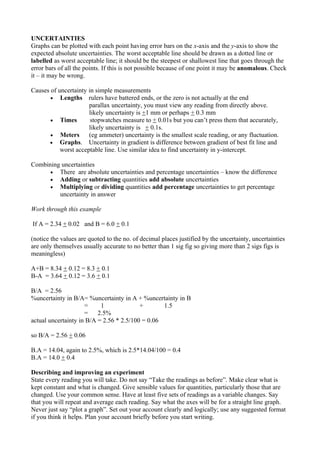

1. When taking measurements, take multiple readings and average them. Show all raw data and averages in a clear table with proper units and precision. 2. Graph your data neatly, with labeled axes including units. The points should fill at least half the page without awkward scaling. 3. Measure the slope of the best-fit line using at least half the data points. Show your work and report the slope with the appropriate number of significant figures and units. 4. Account for uncertainties in measurements and calculated values. Show error bars on graphs and identify the range permitted by uncertainties. Report results with precision justified by the uncertainty.