Downloaded 242 times

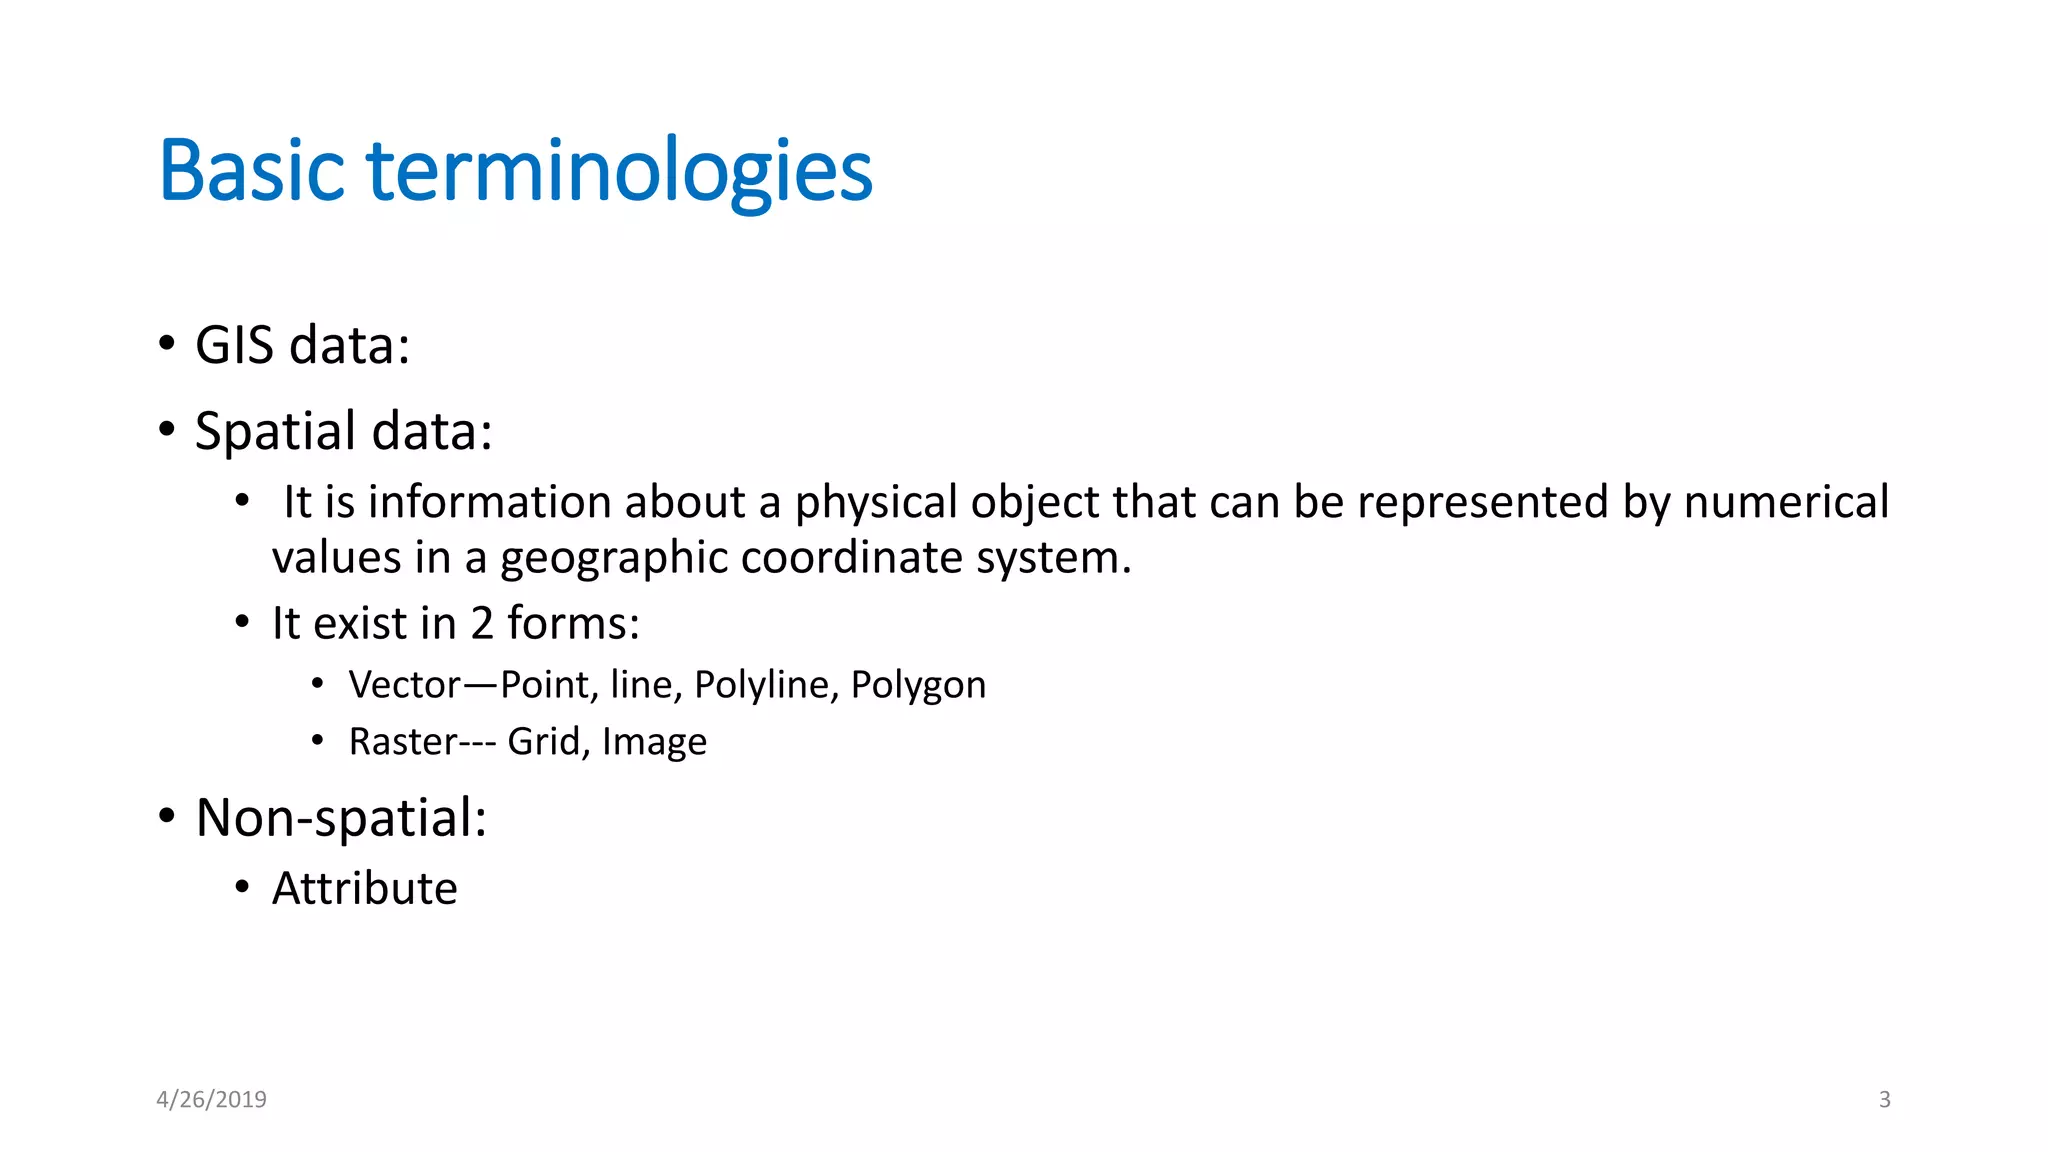


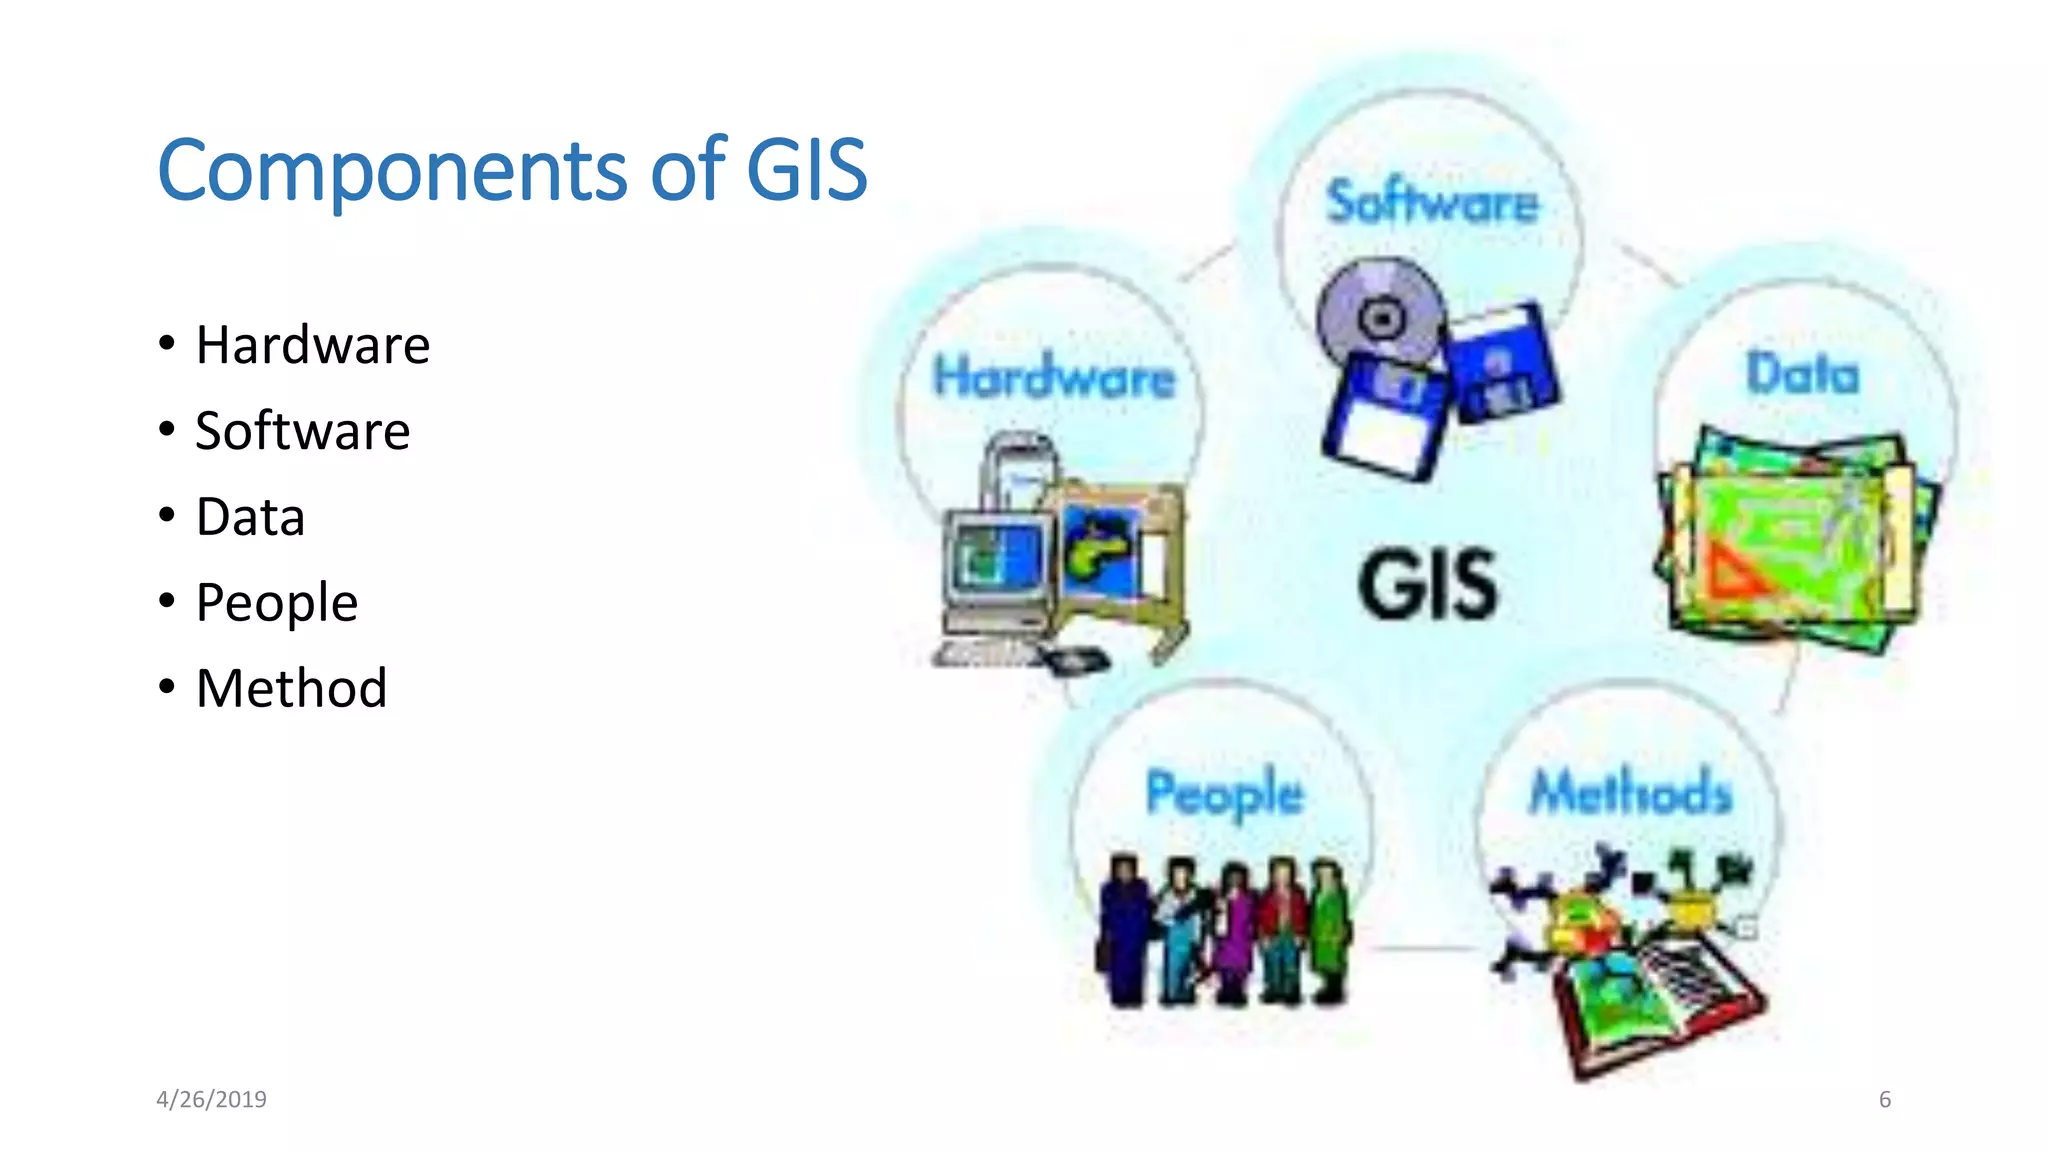


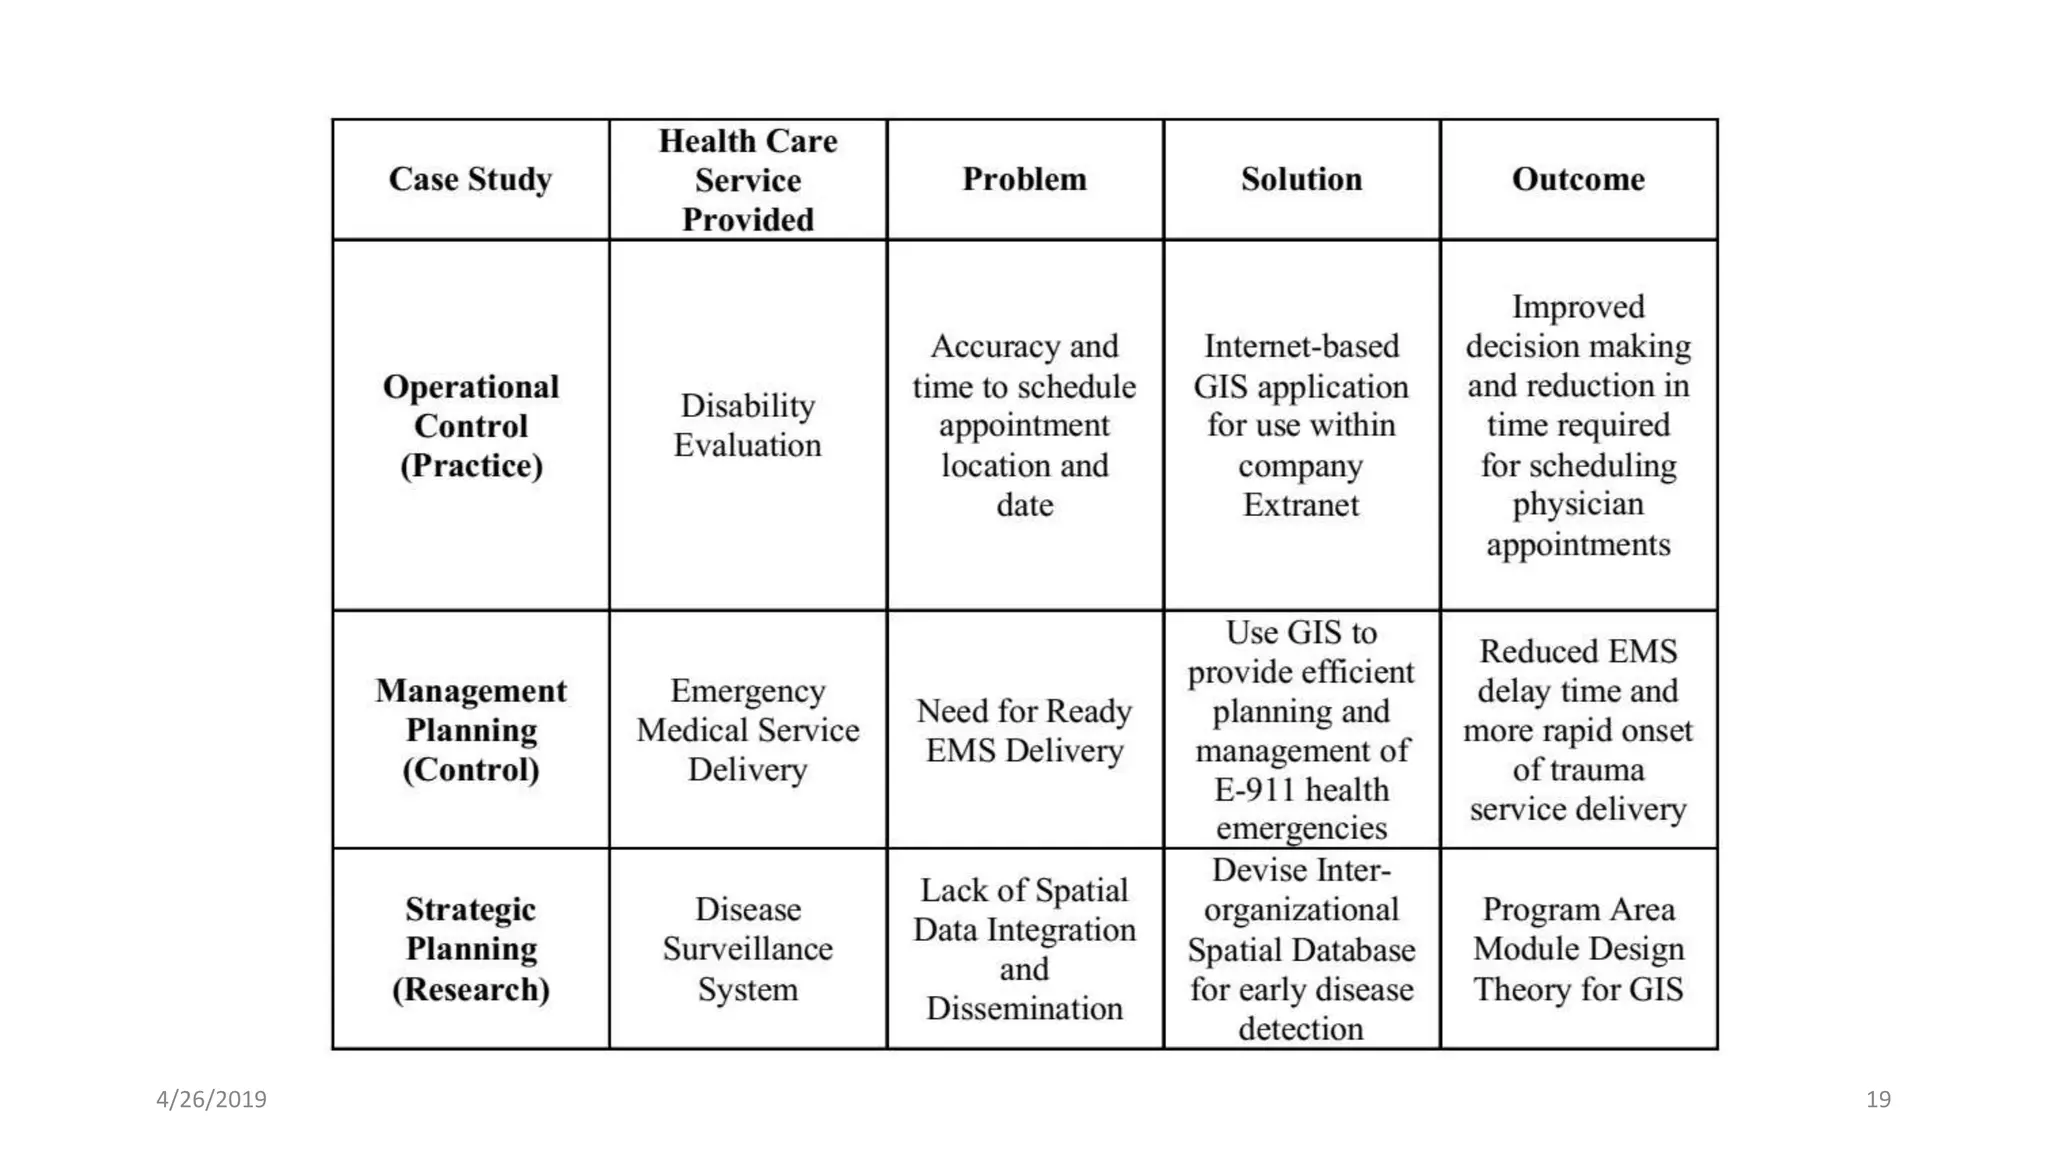


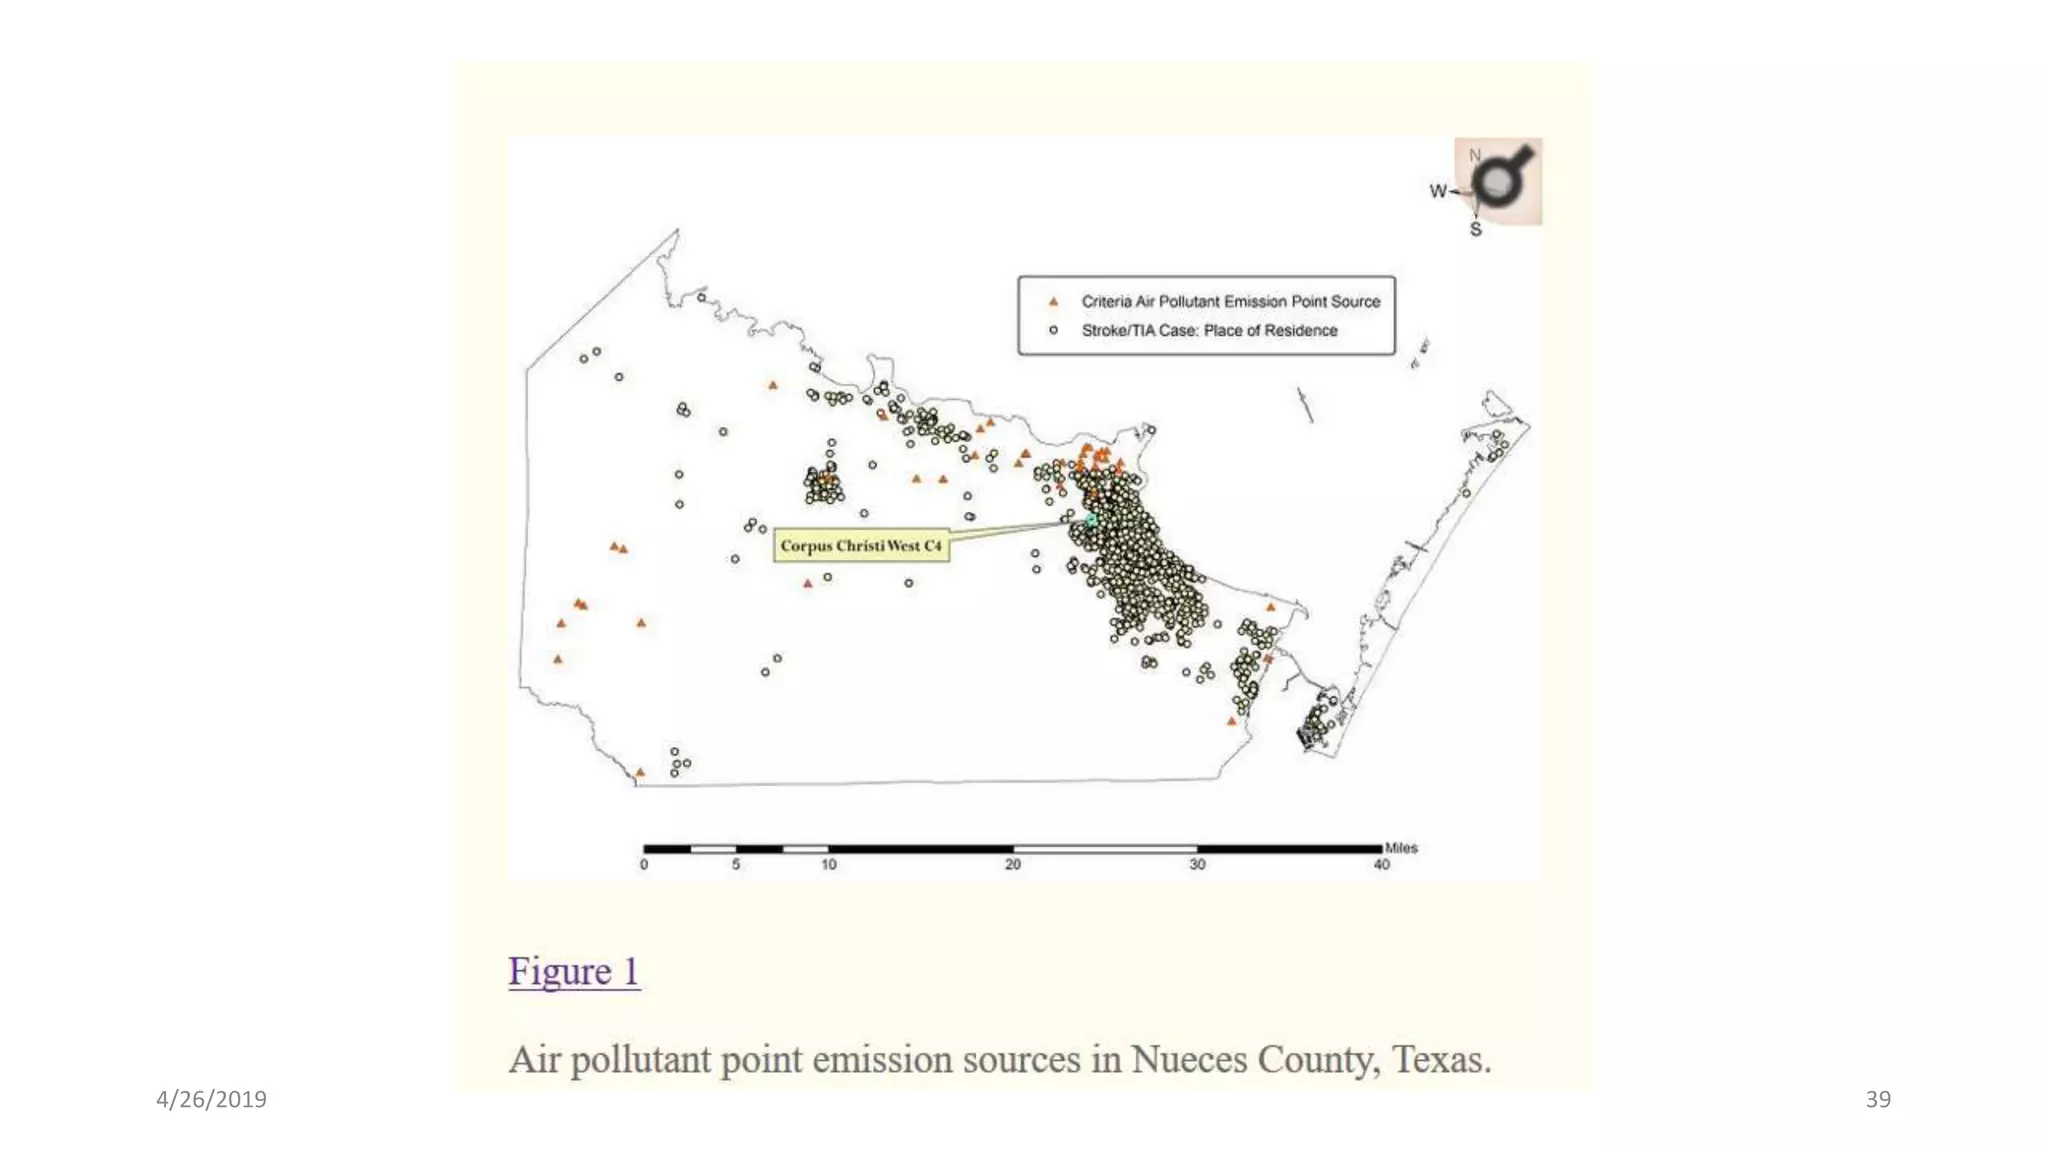


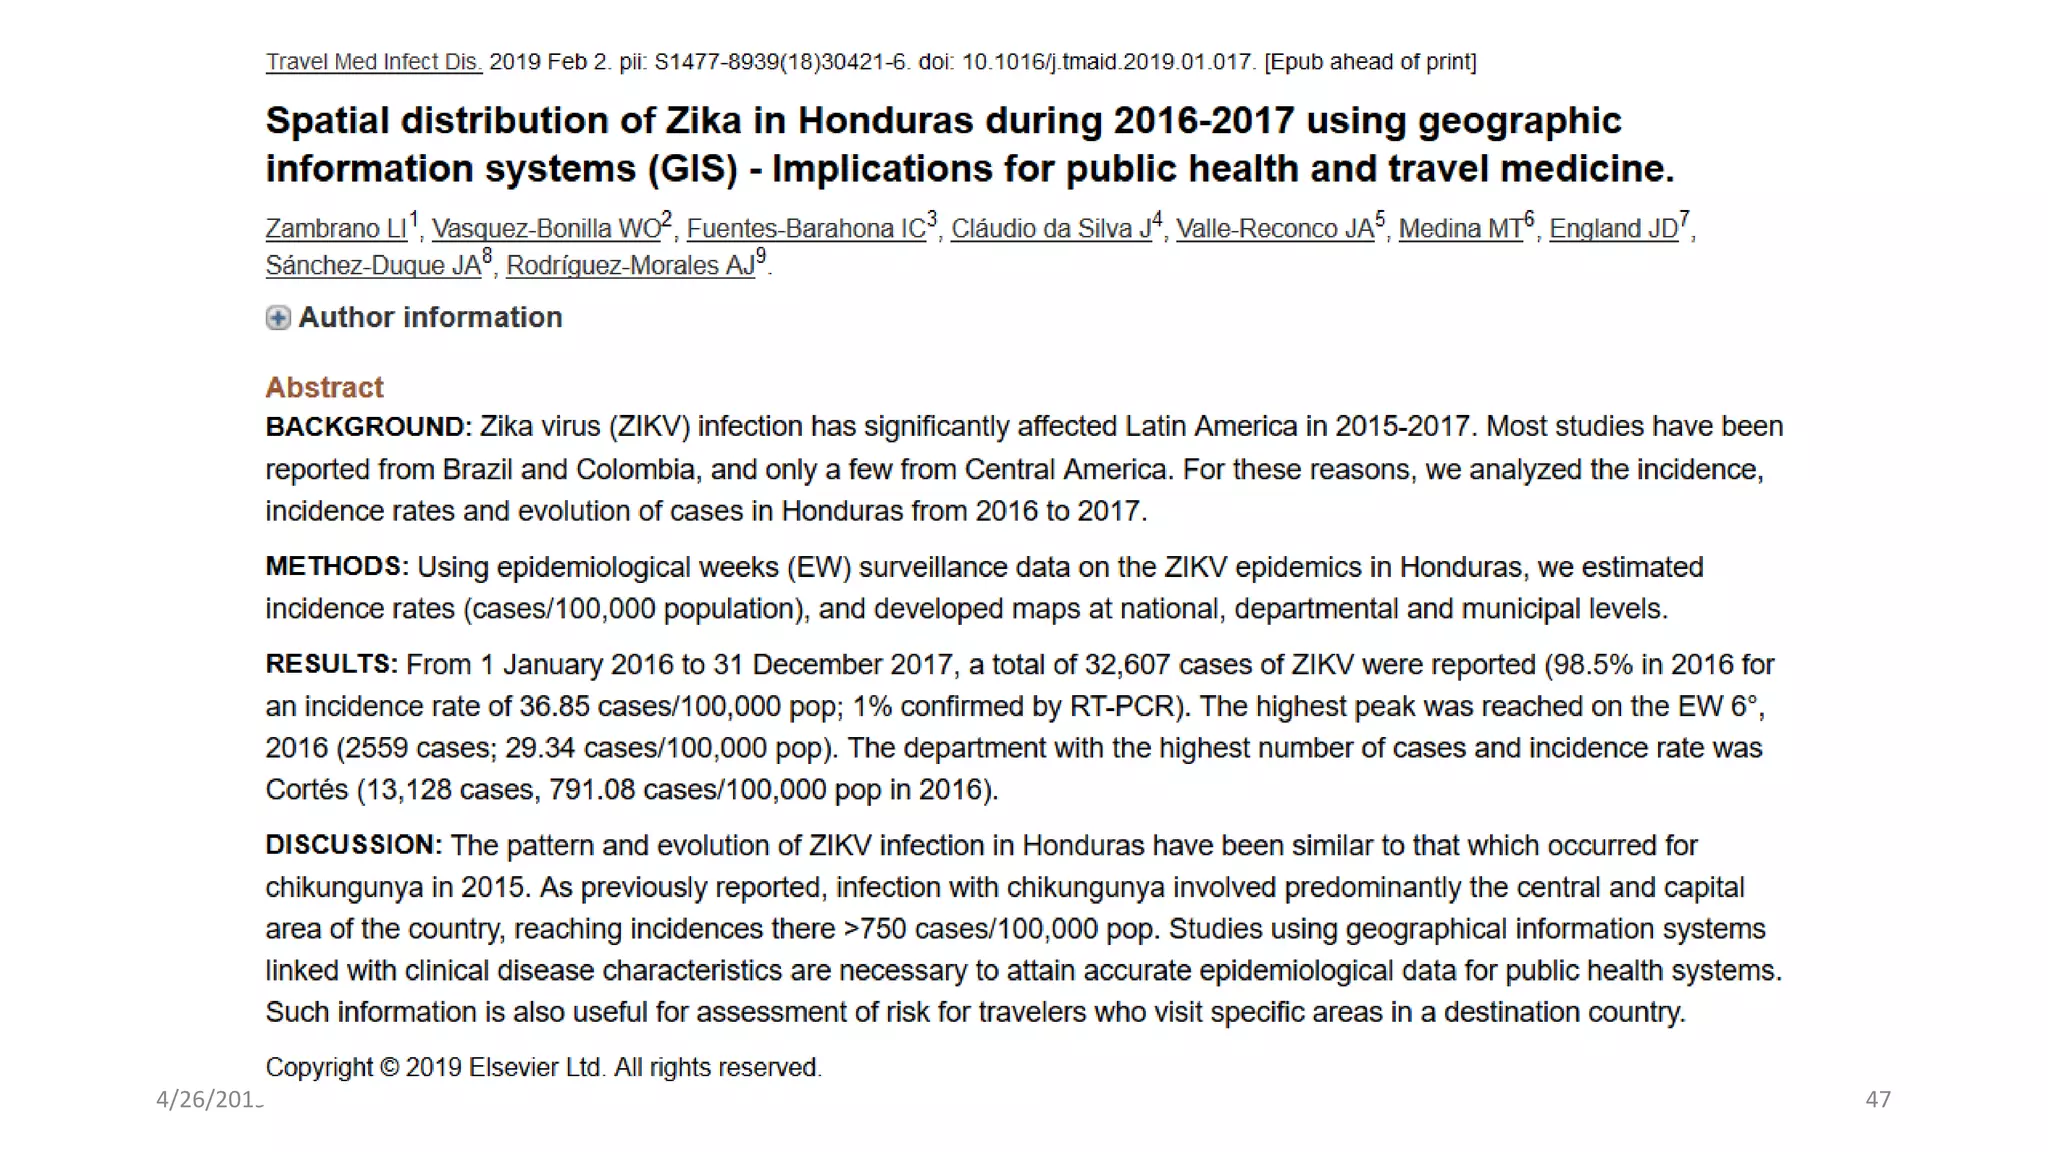

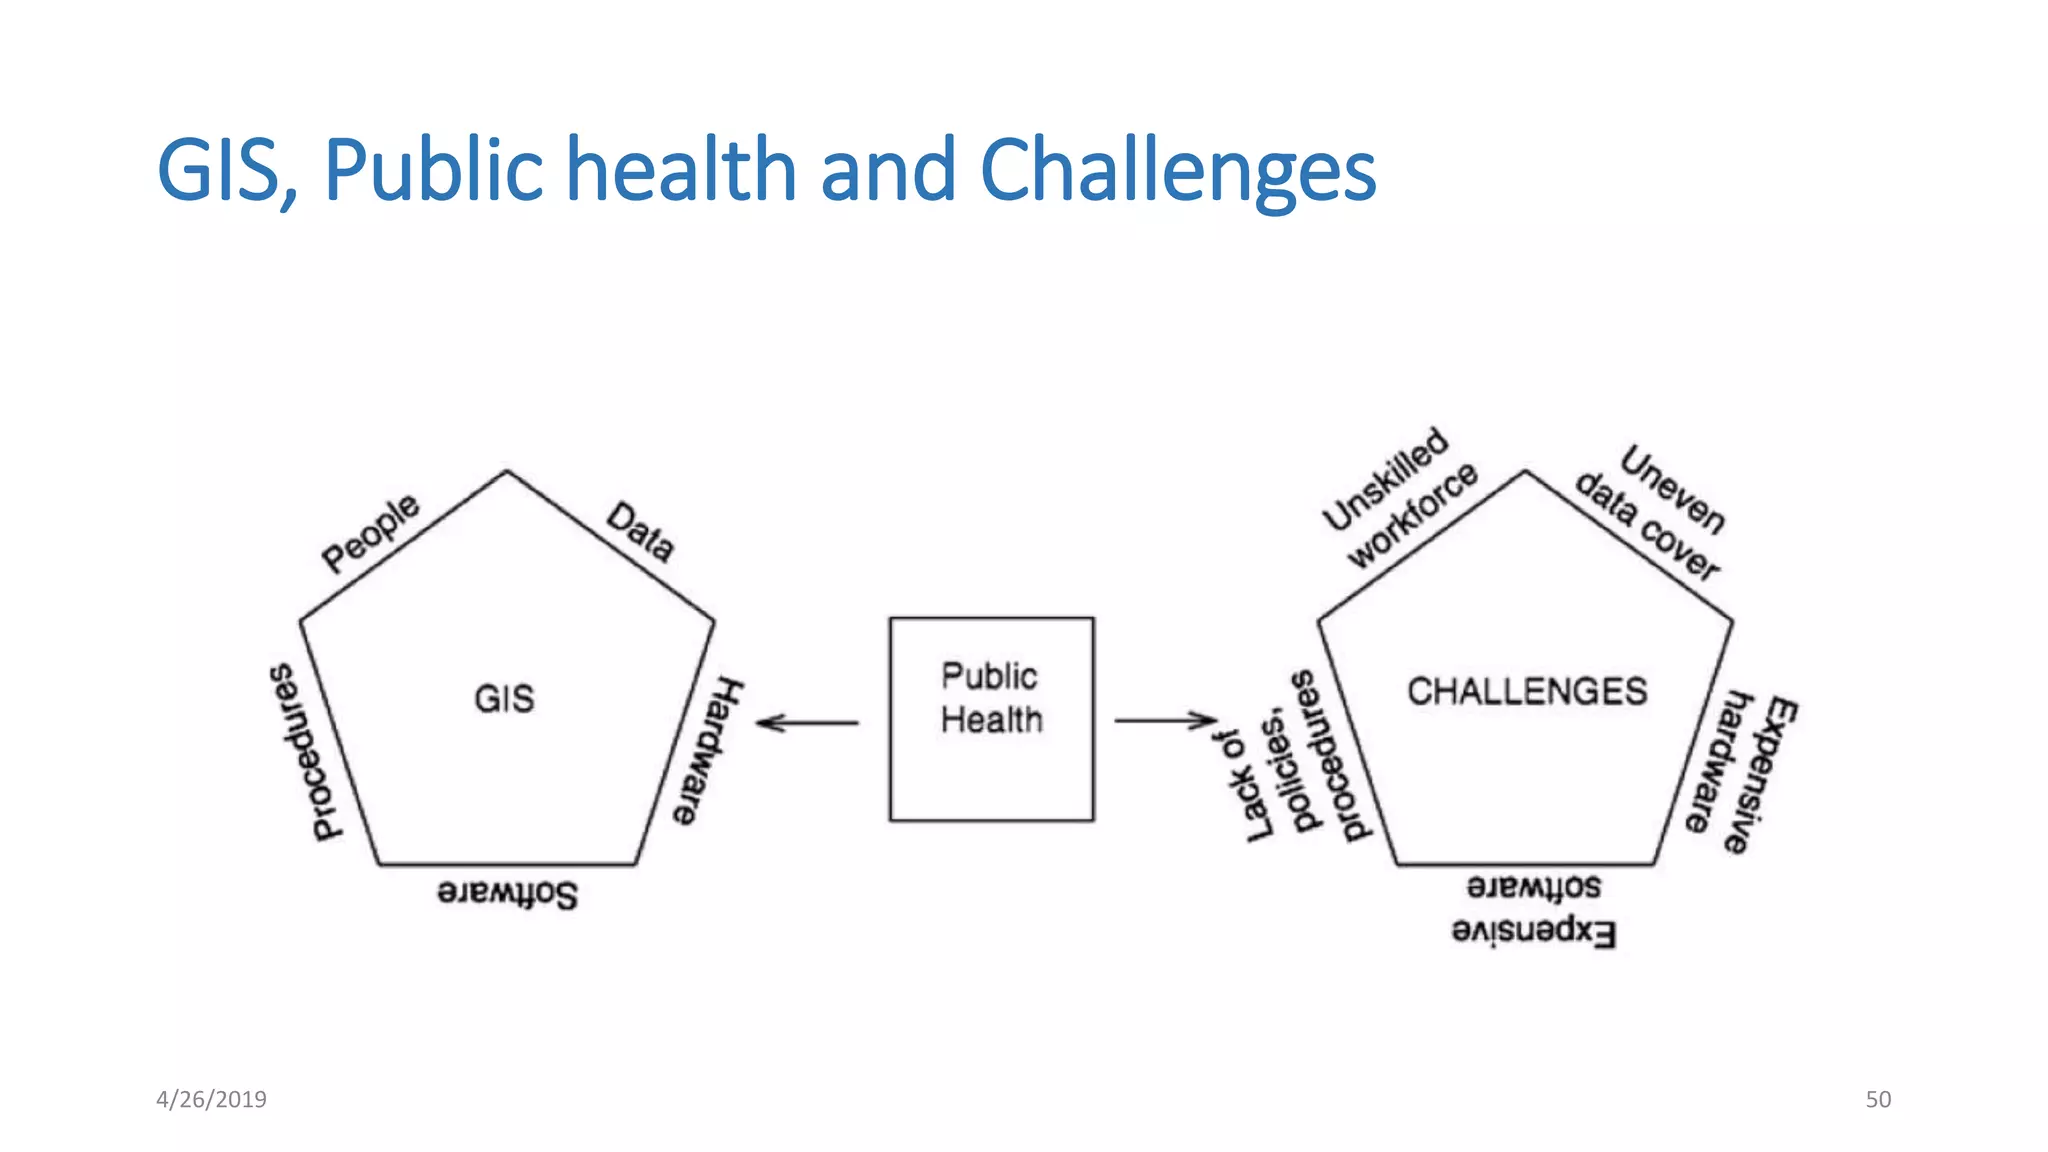


The document provides an overview of a presentation on the use of geographic information systems (GIS) in public health. It discusses the history of GIS and its applications in areas such as disease surveillance, vaccine trials, mapping of infectious diseases, and analyzing access to health services. The presentation covers basic GIS concepts and terminology, components of a GIS, its functions, and examples of how GIS has been used to study and monitor health issues.


