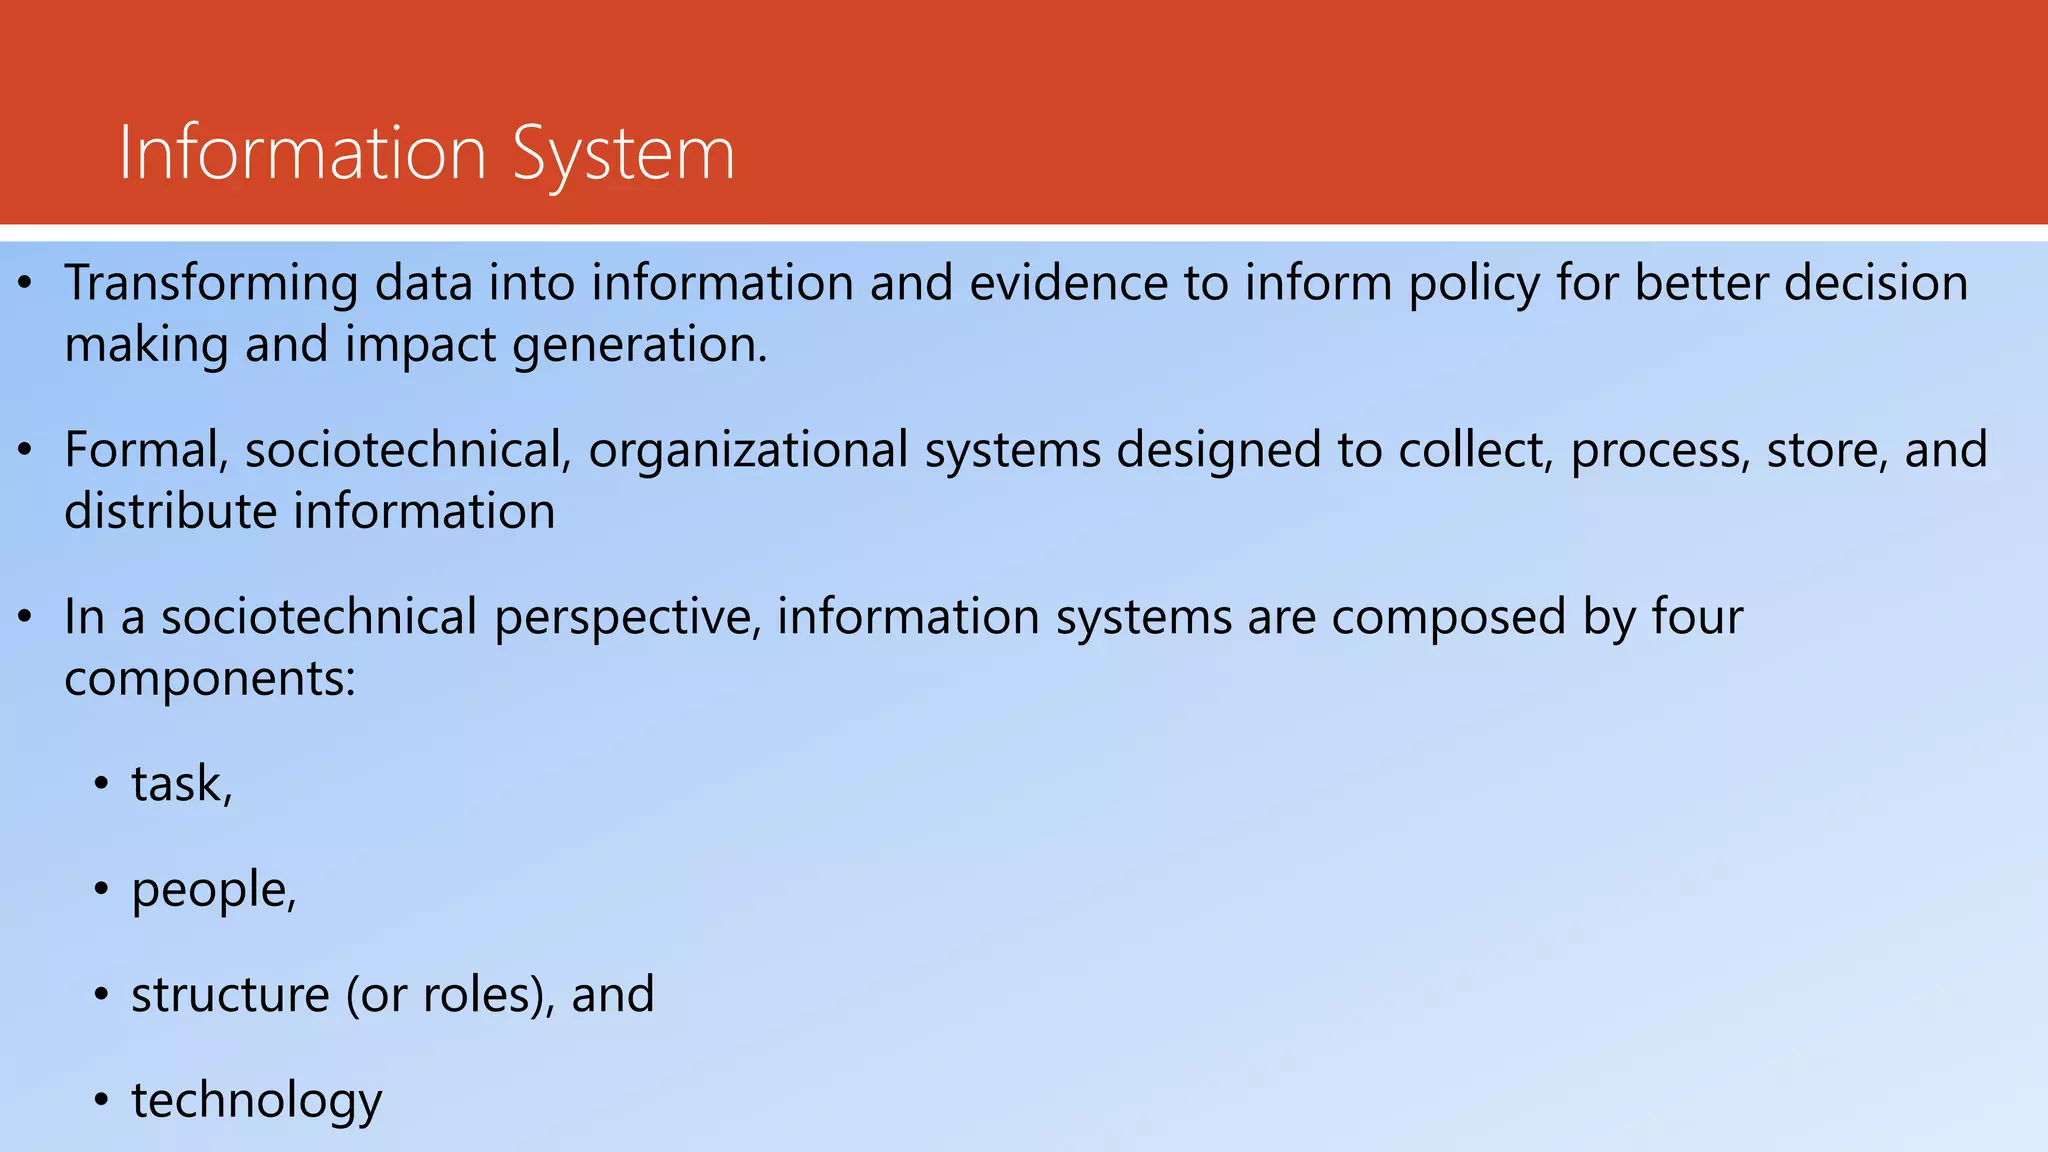
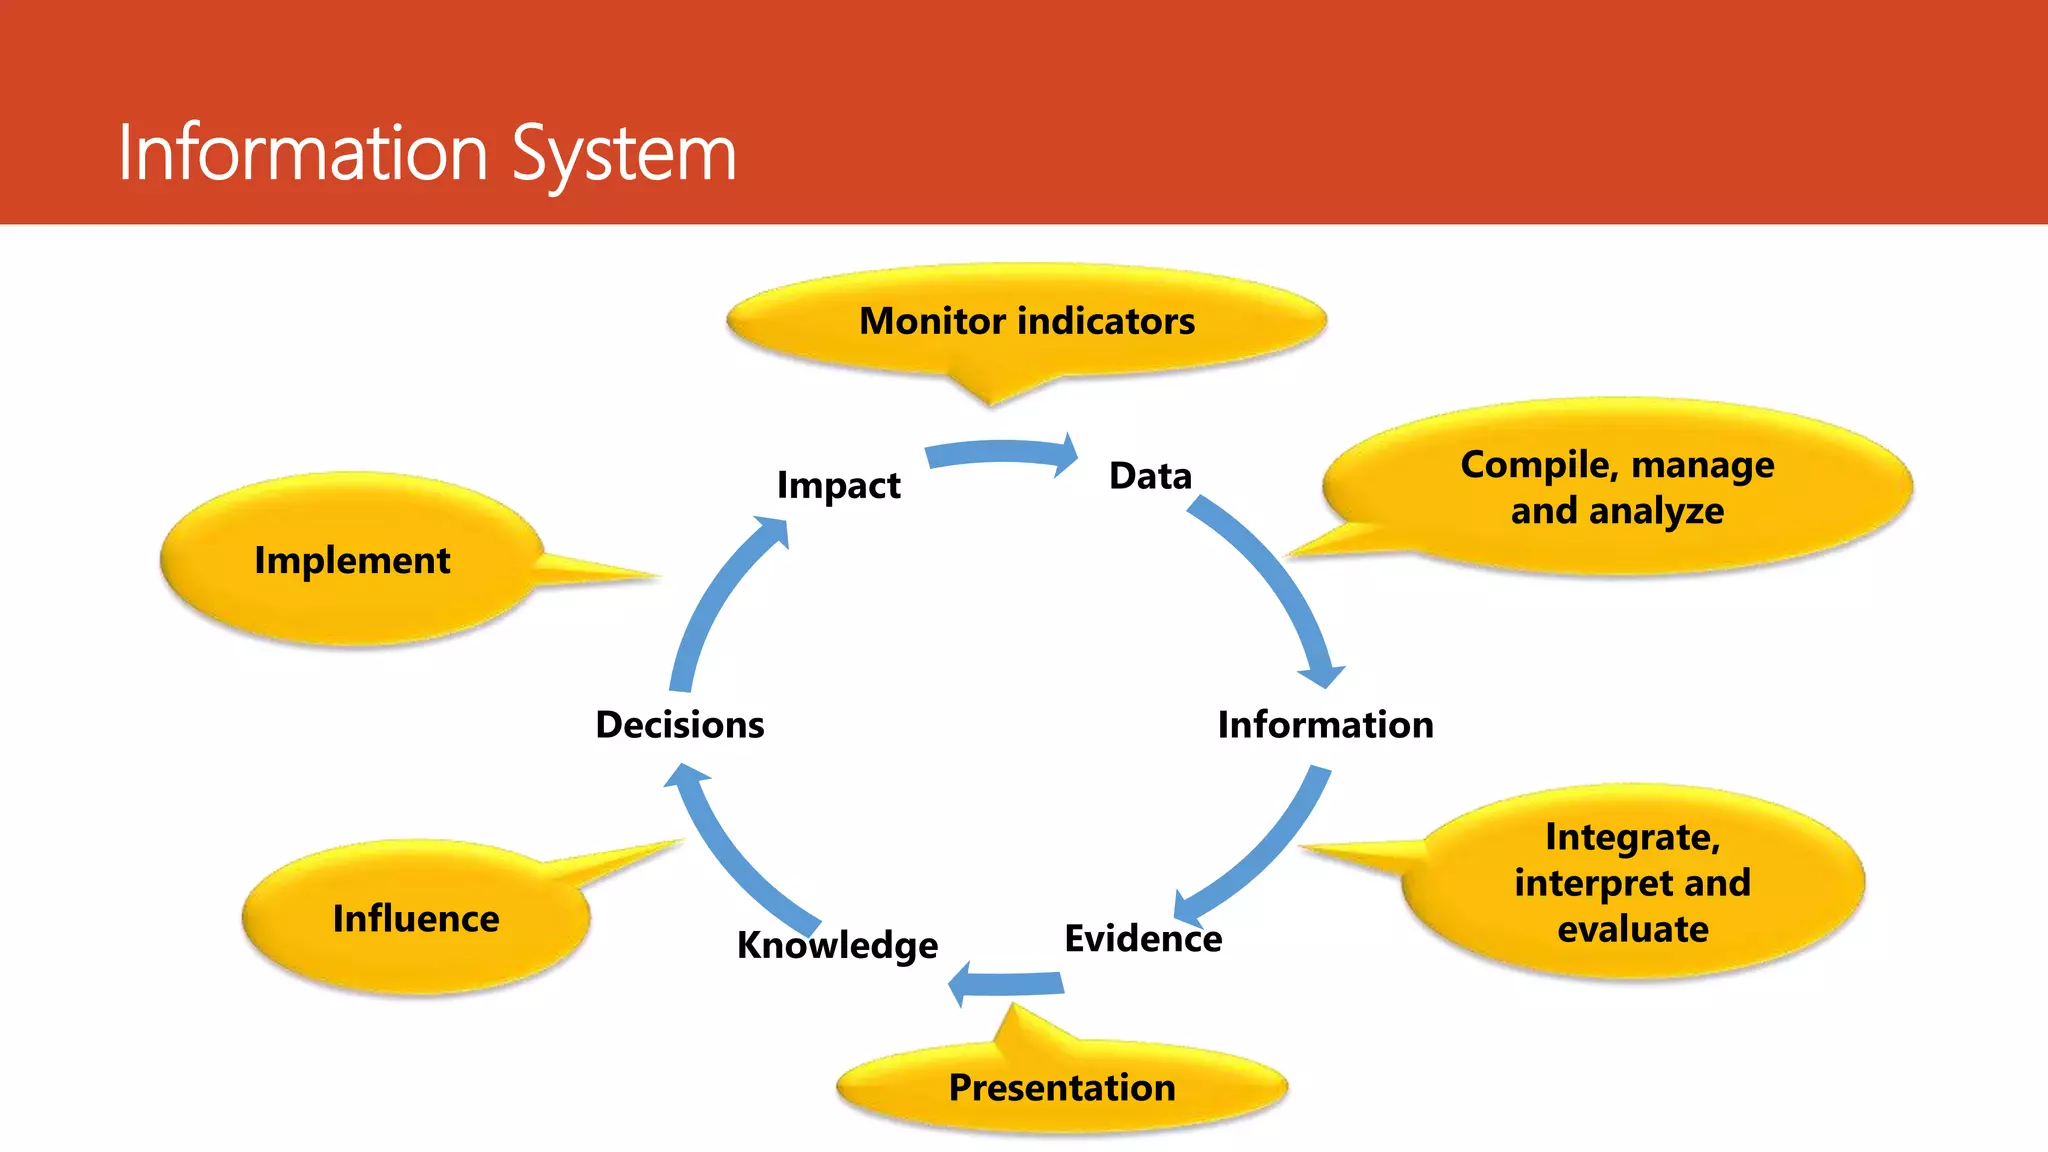
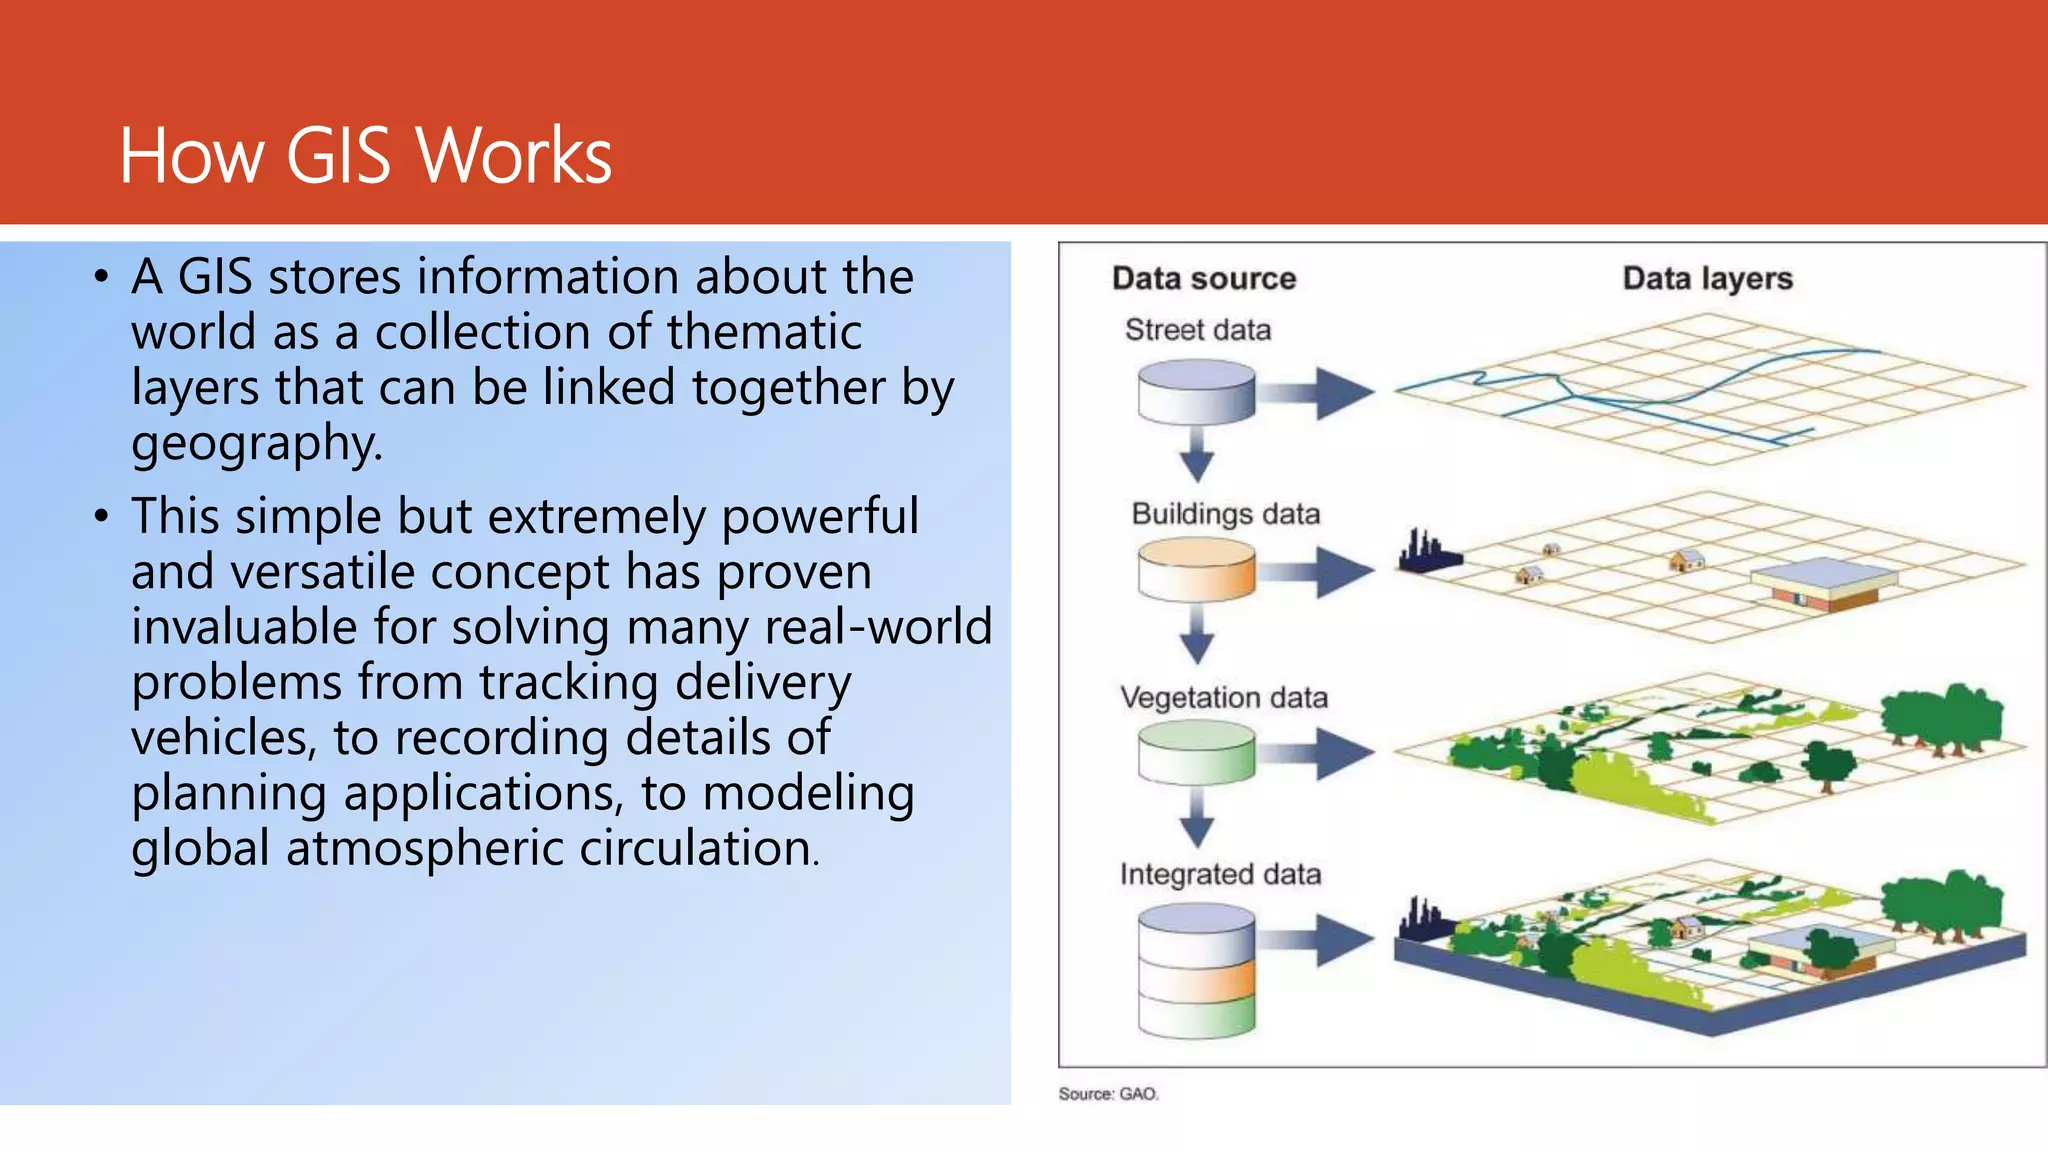
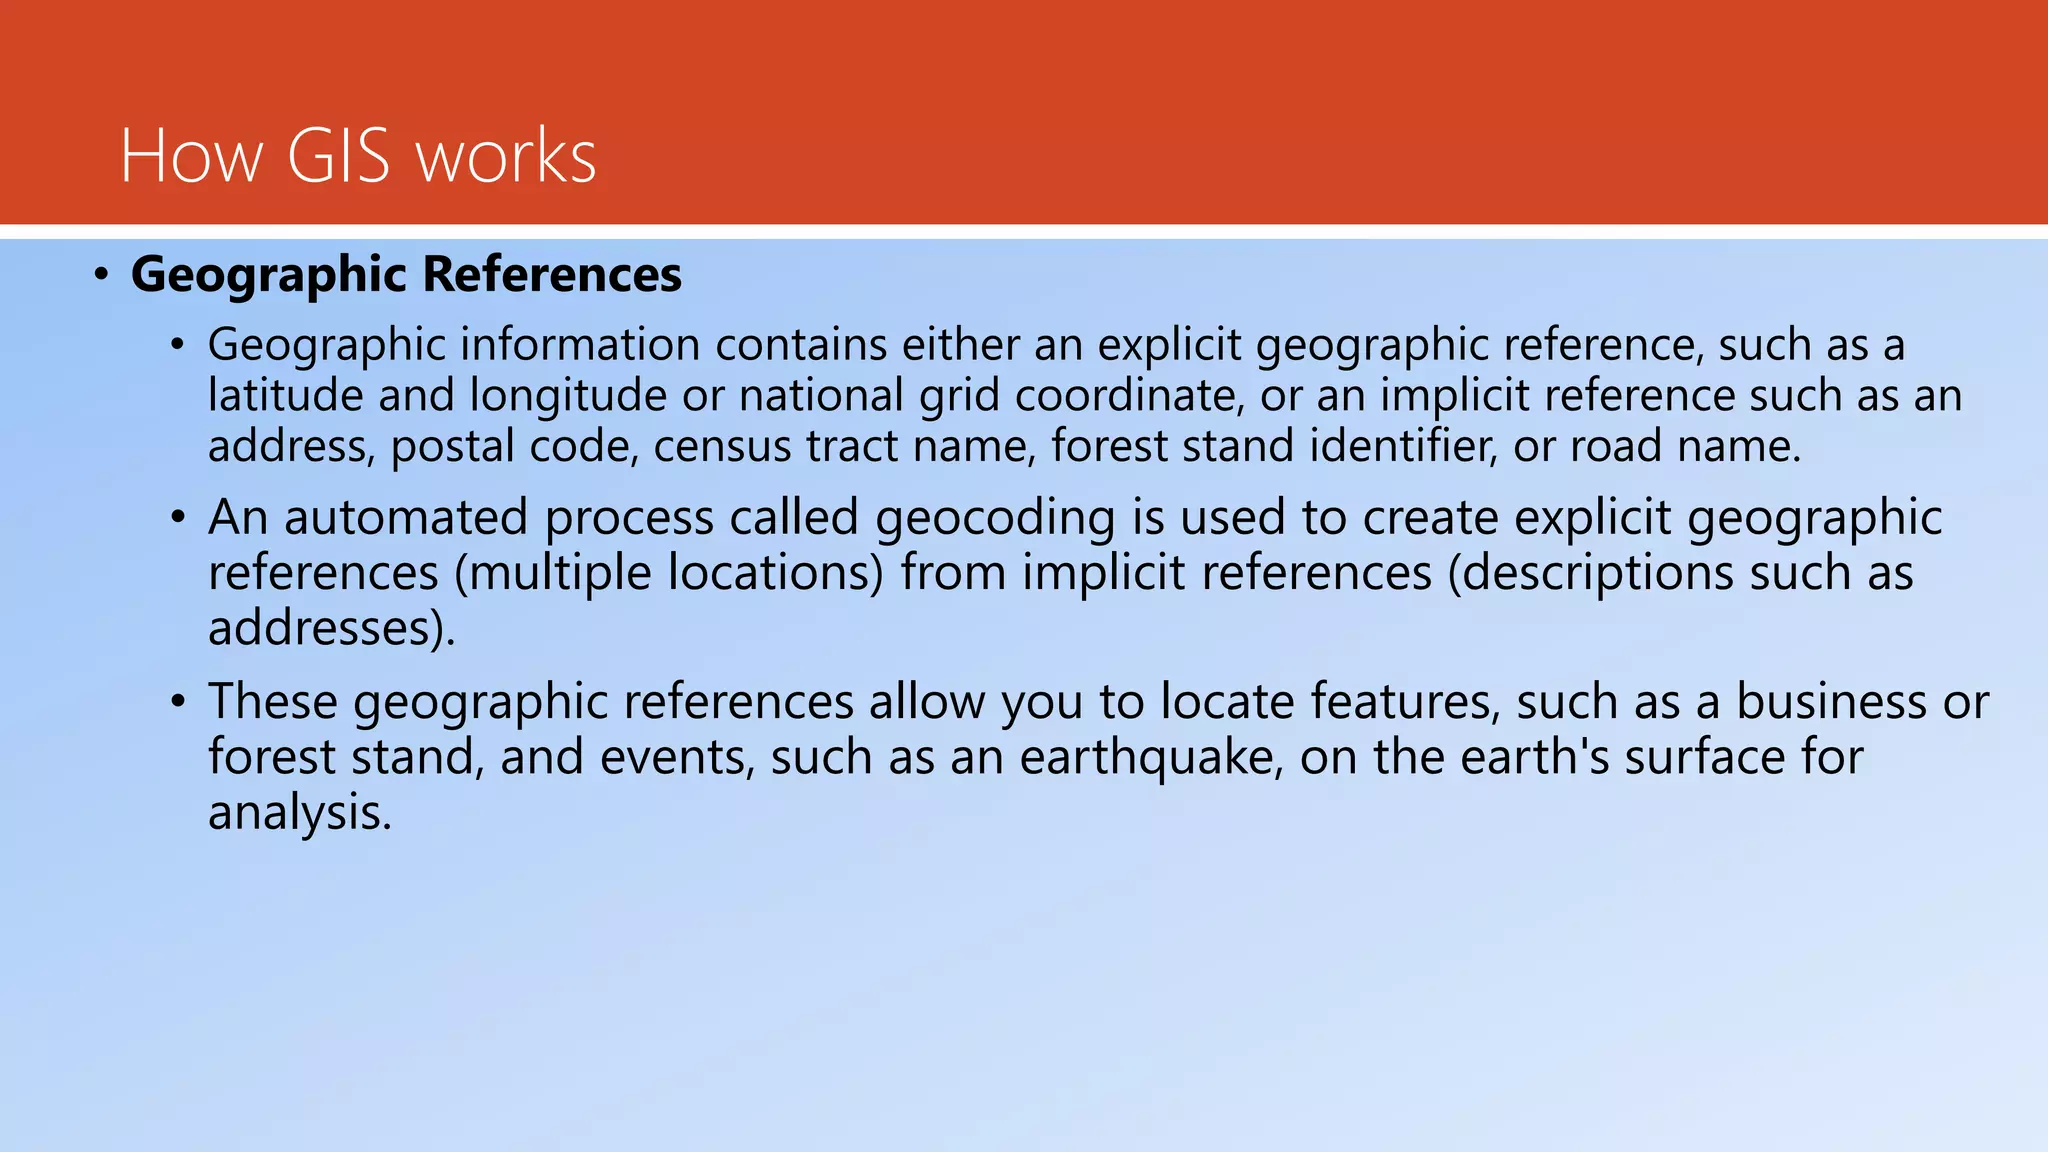
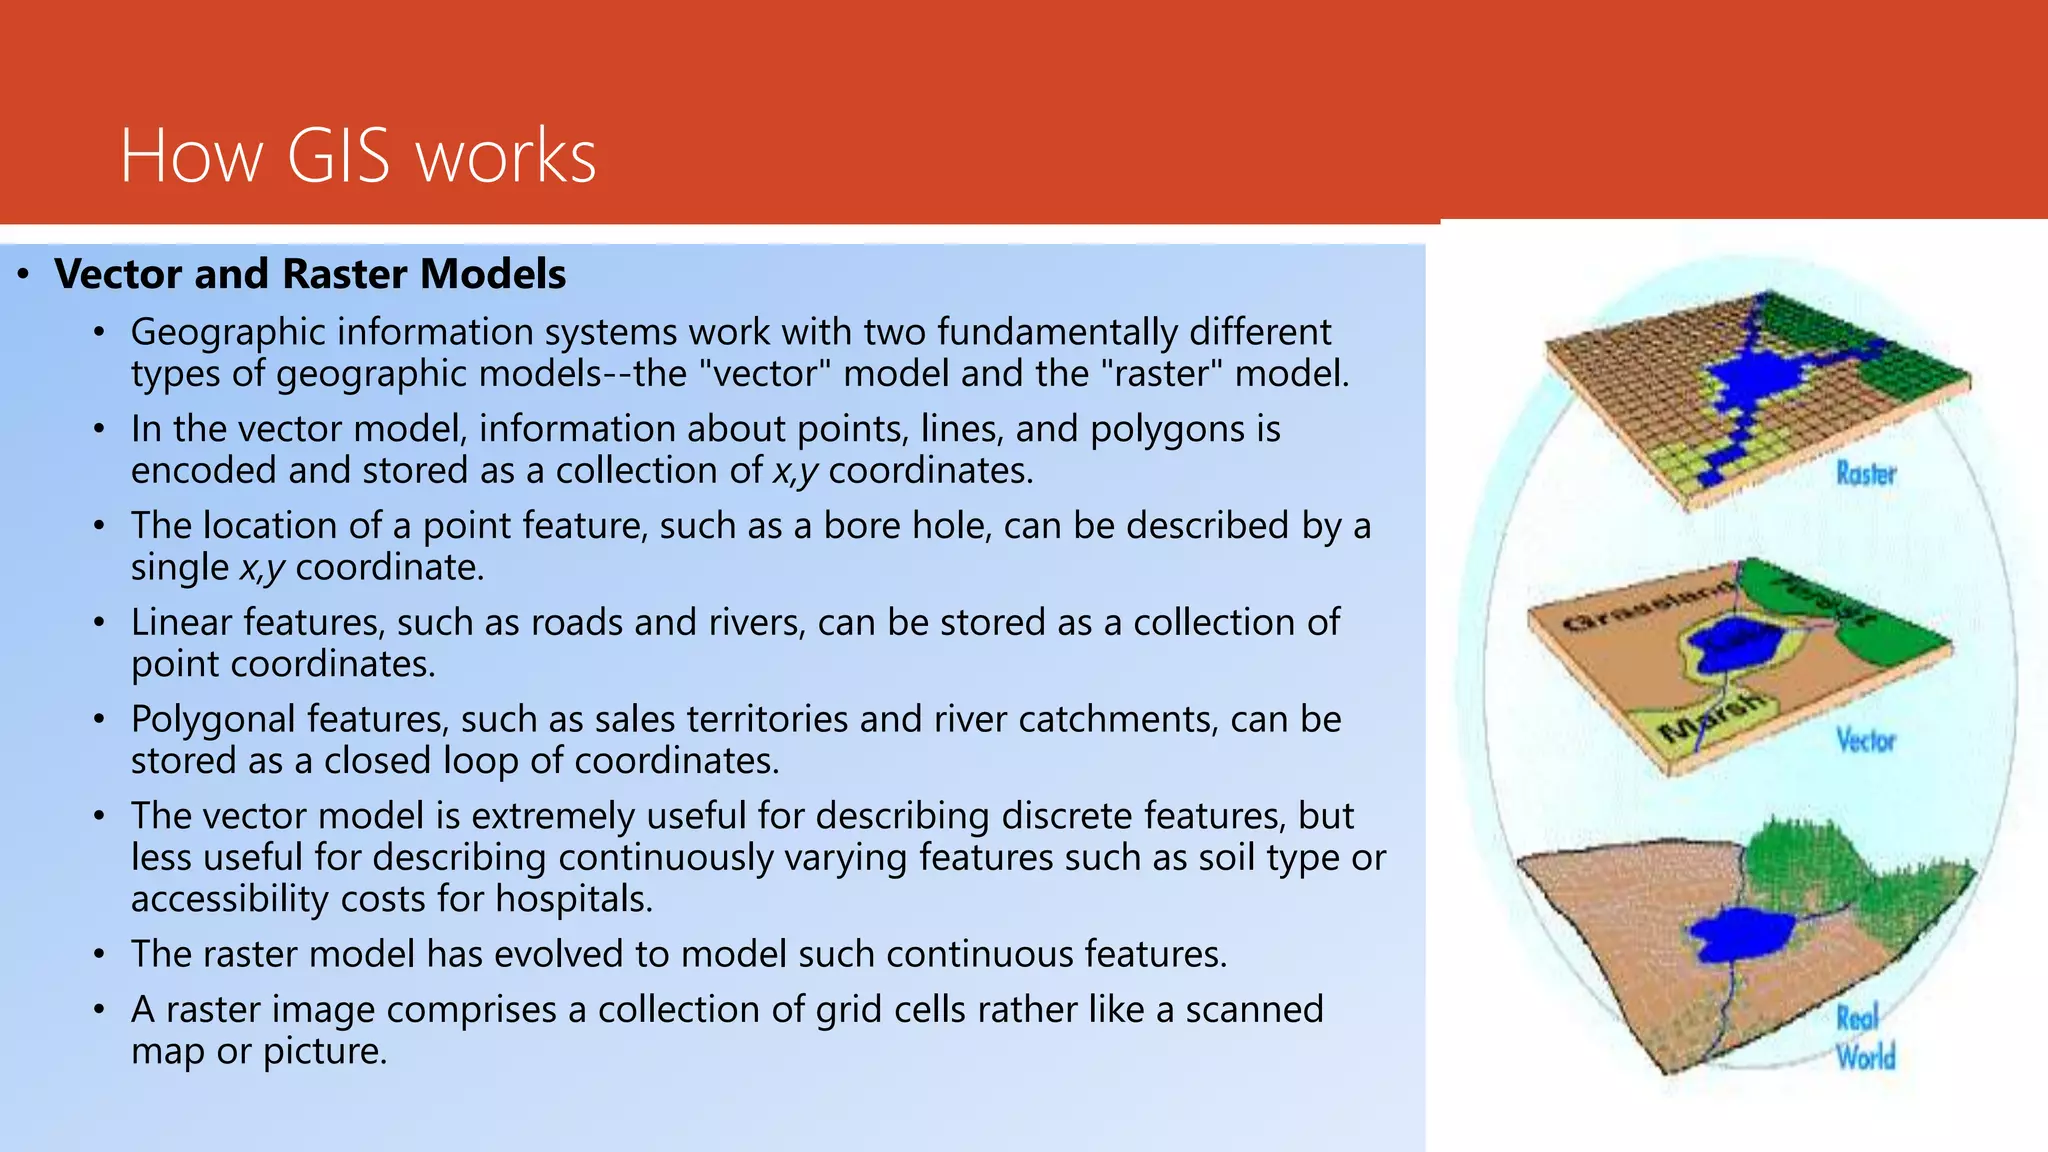
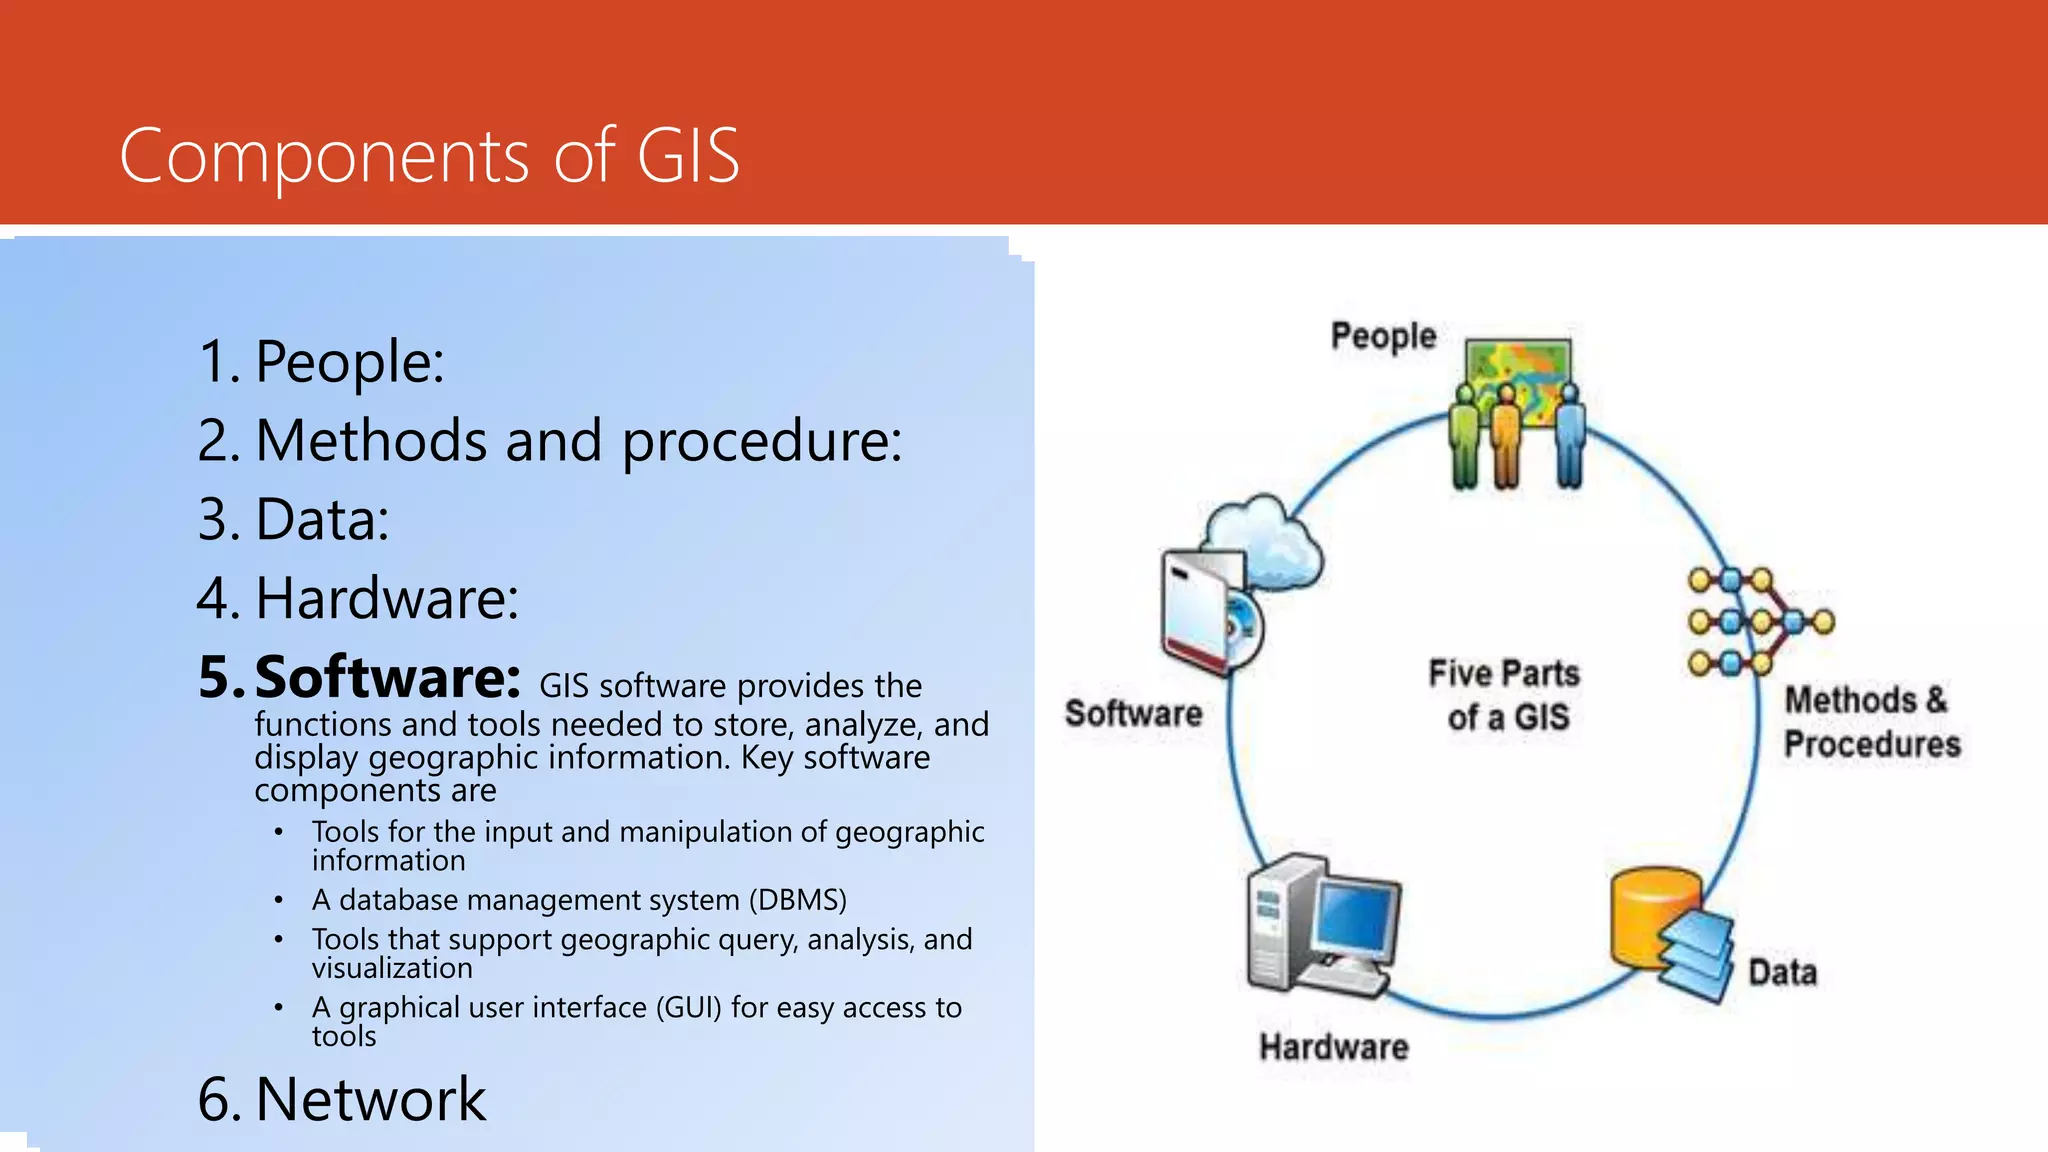
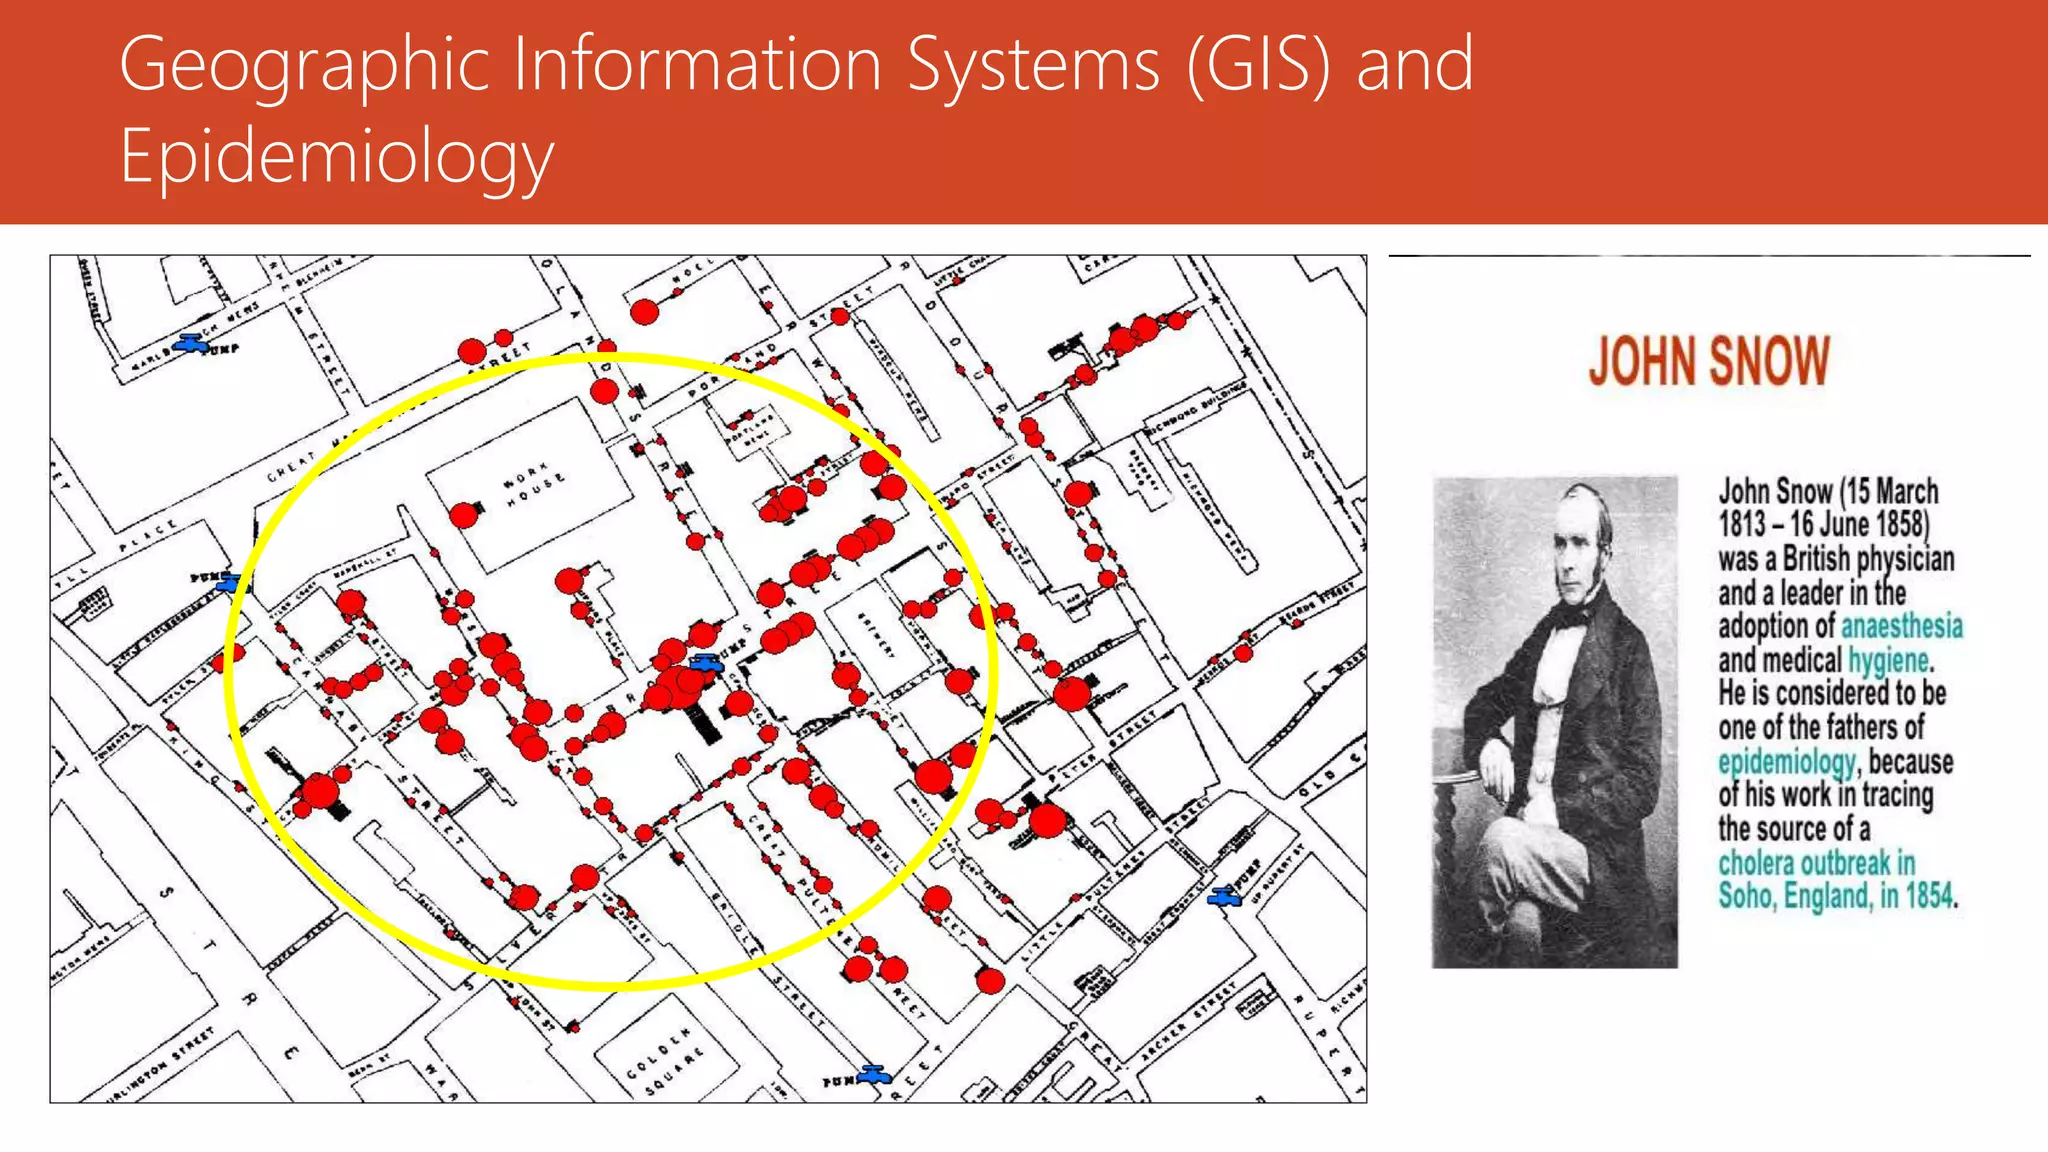
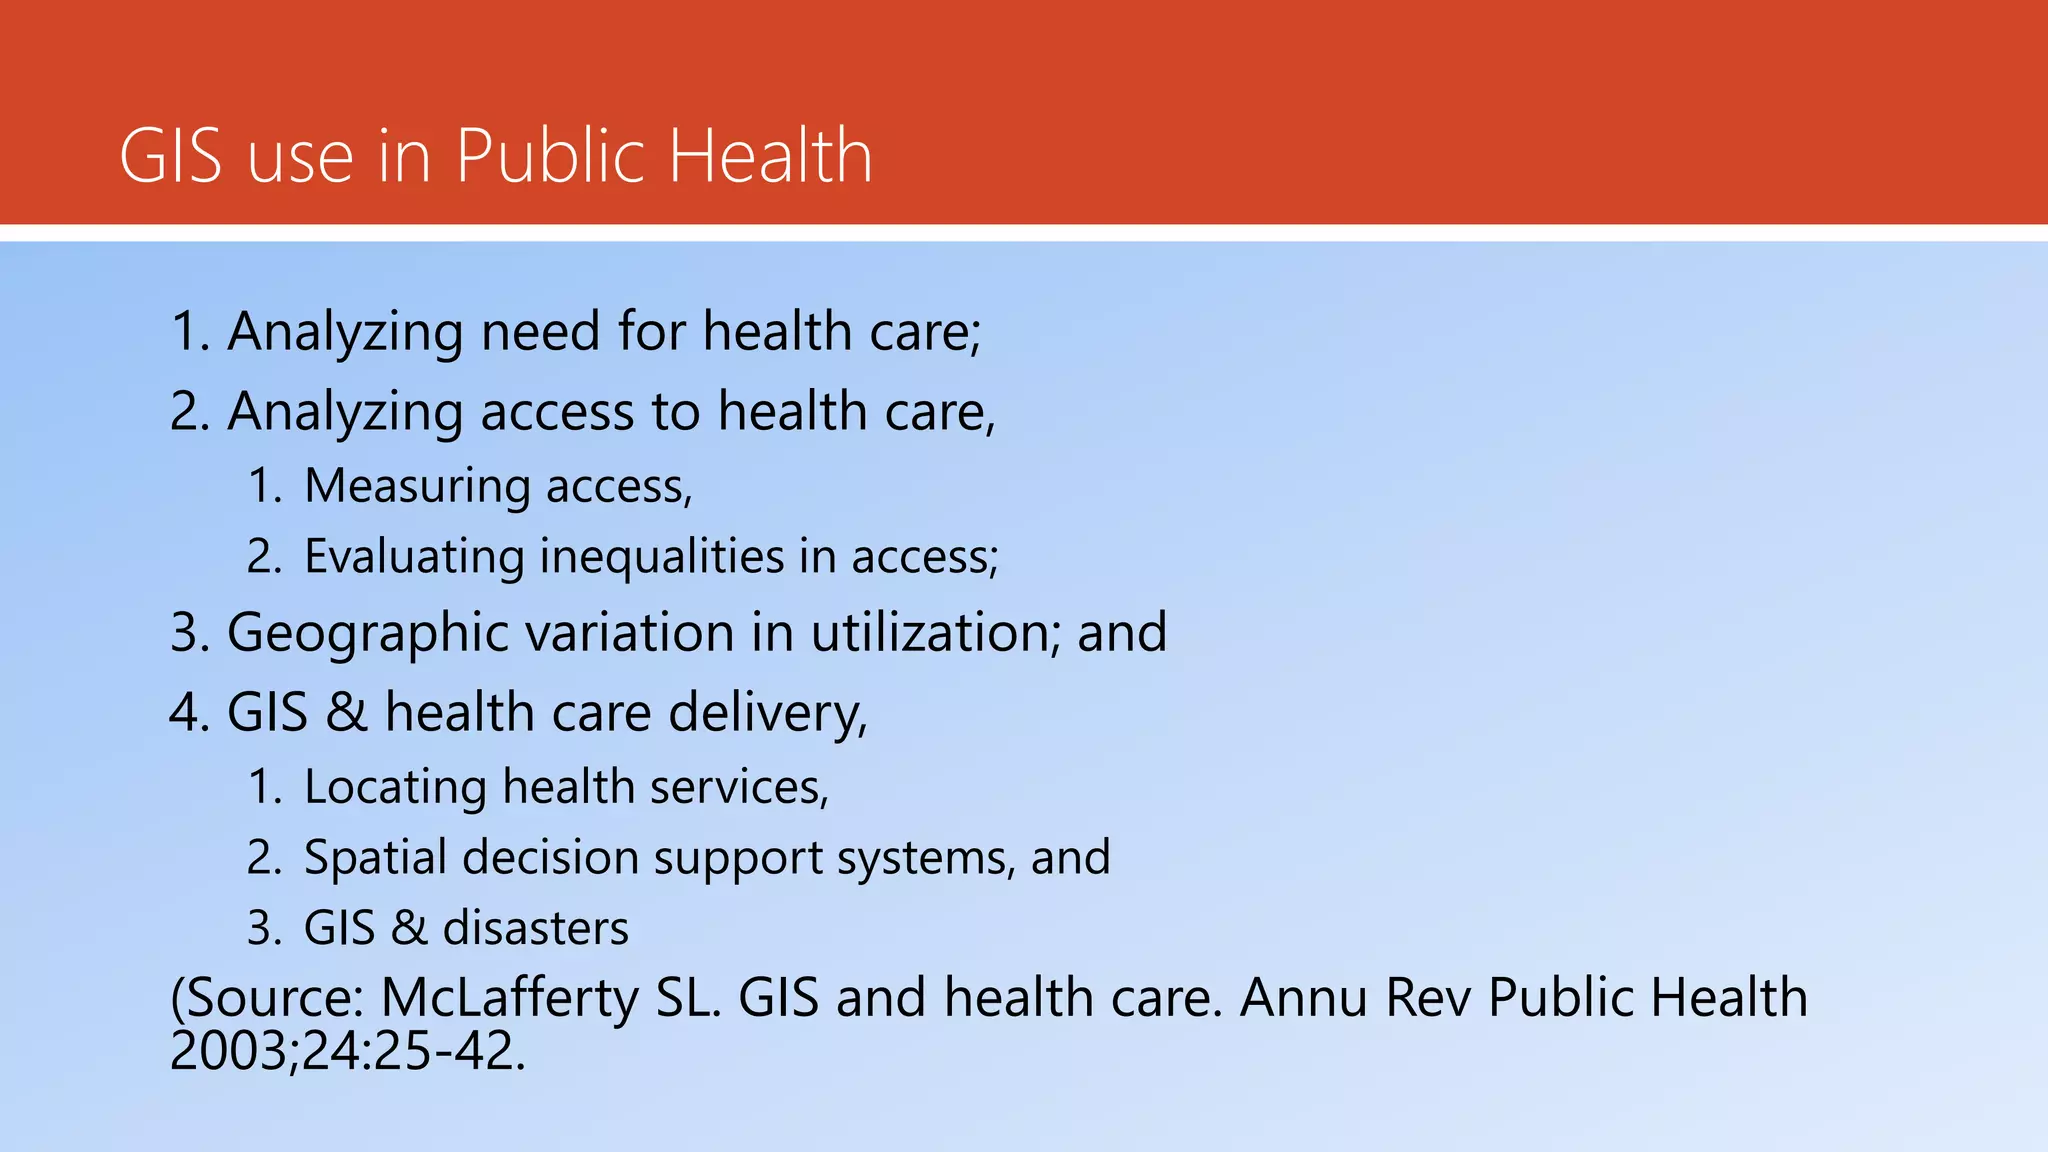
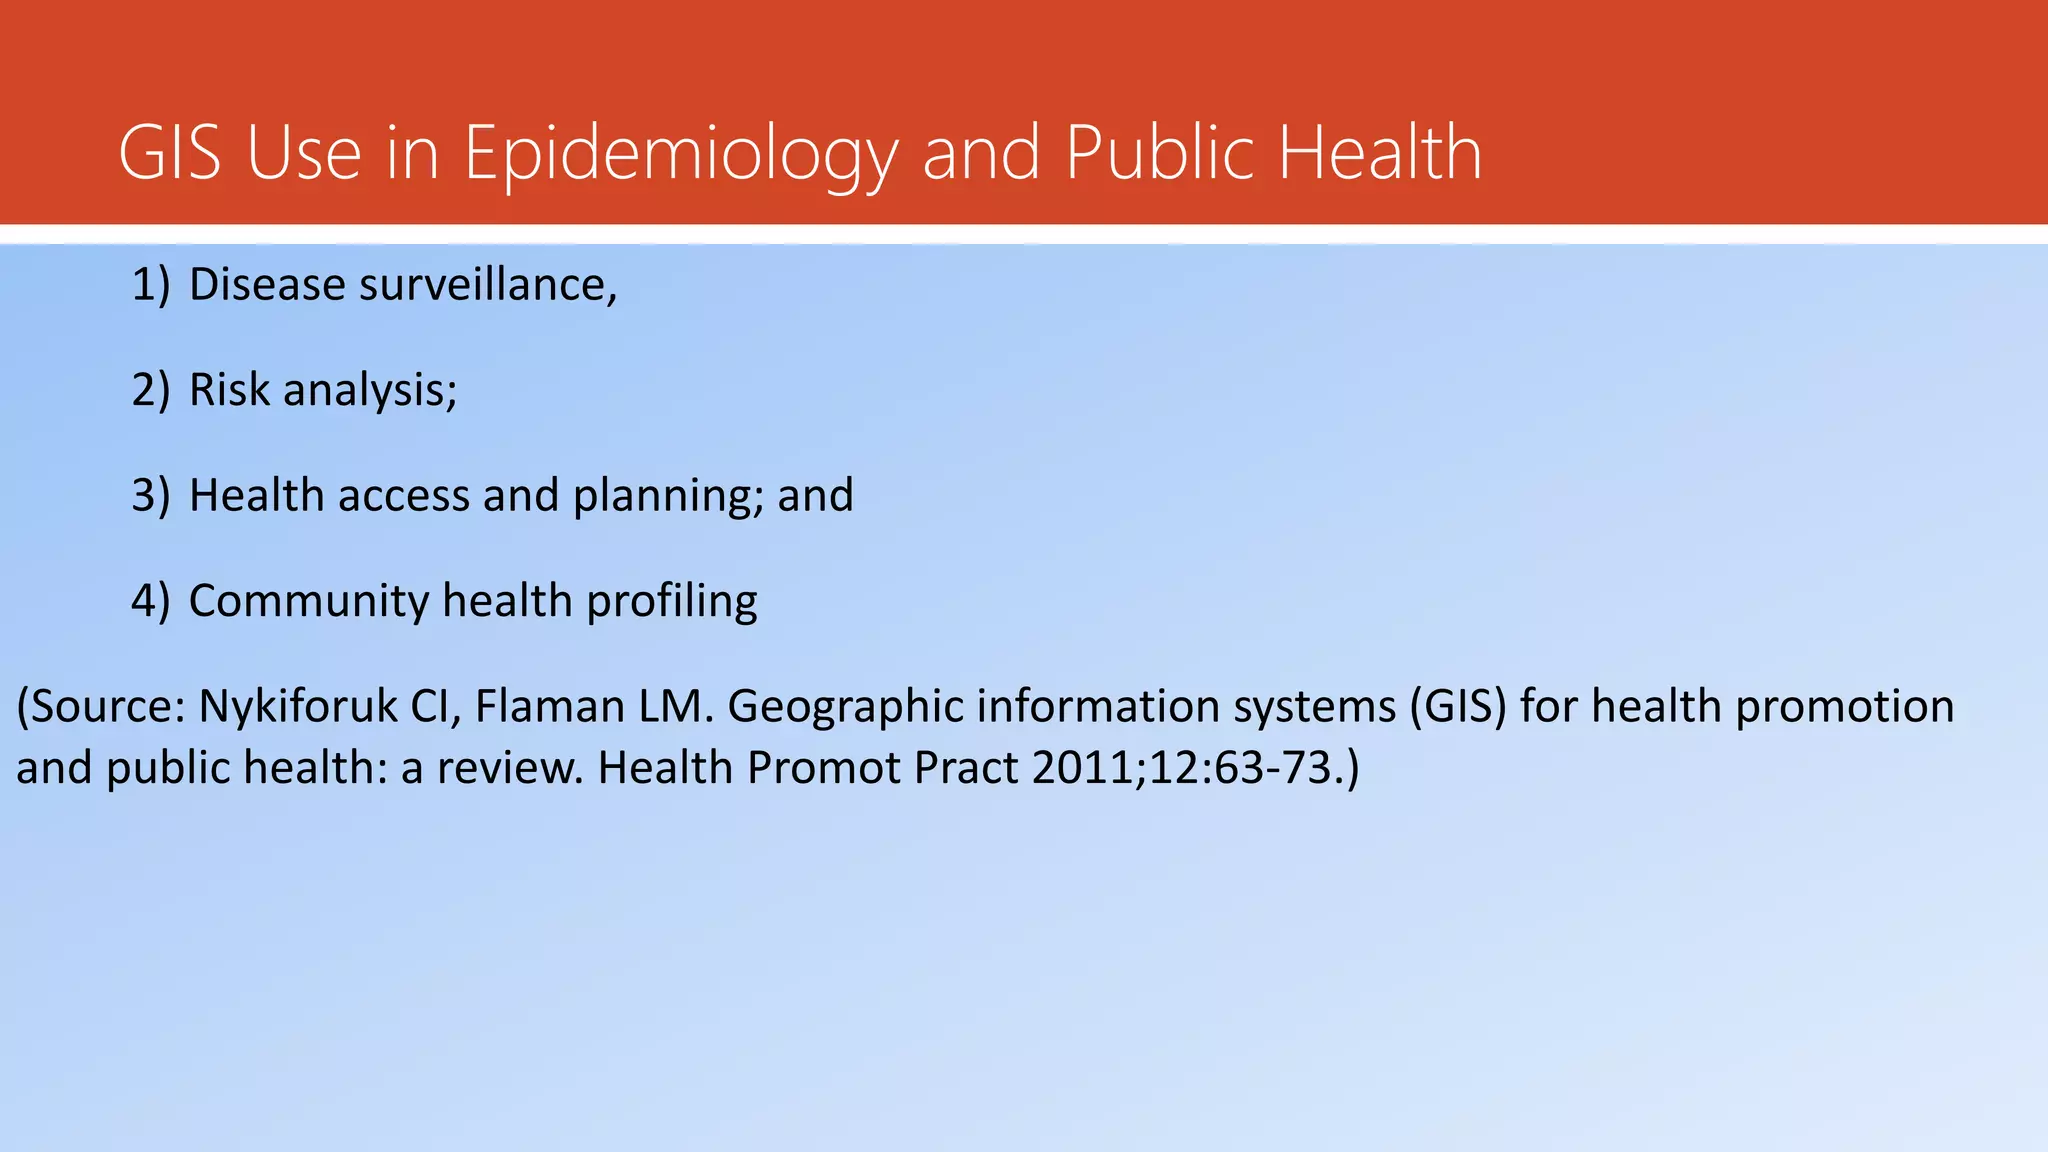
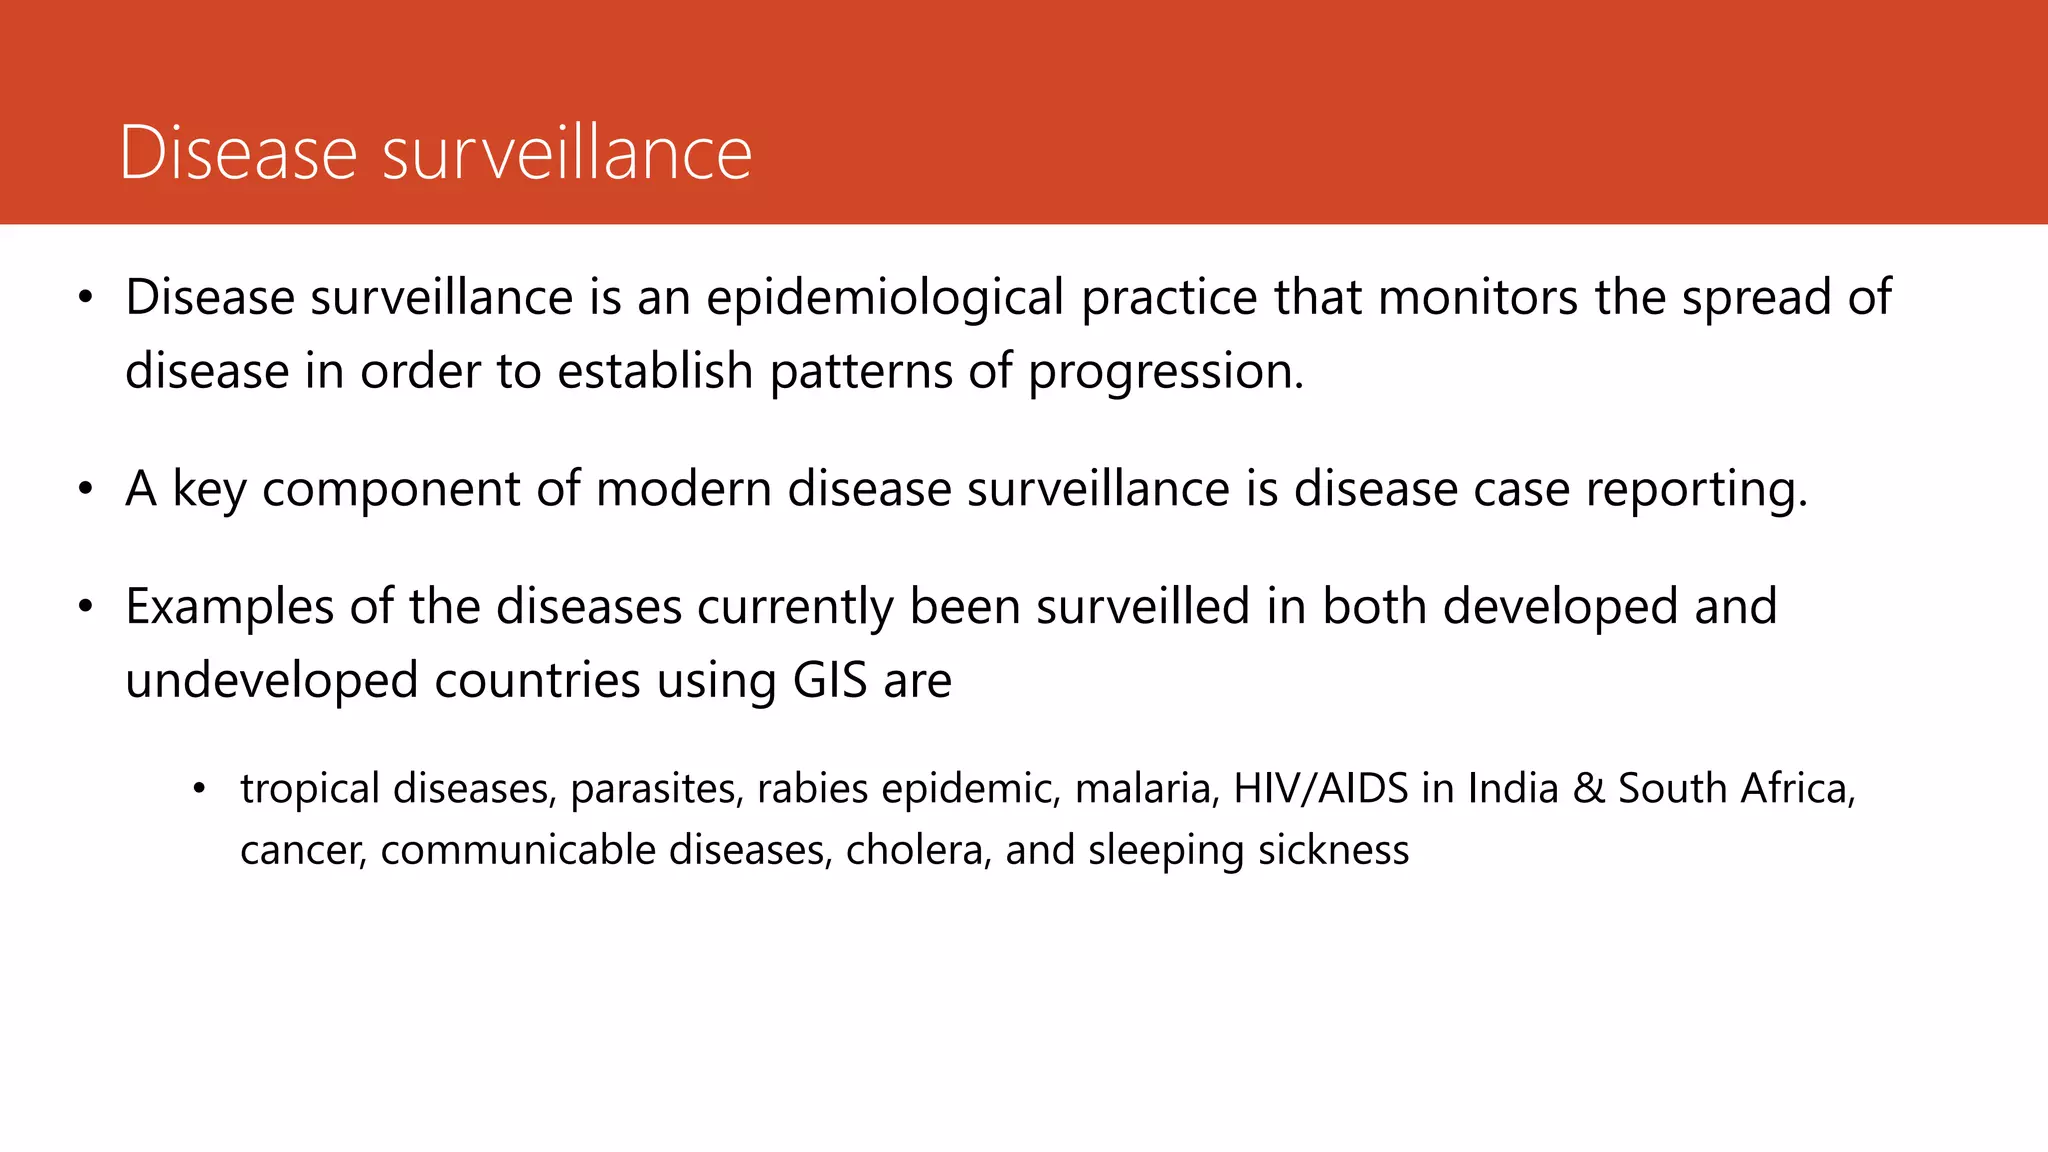
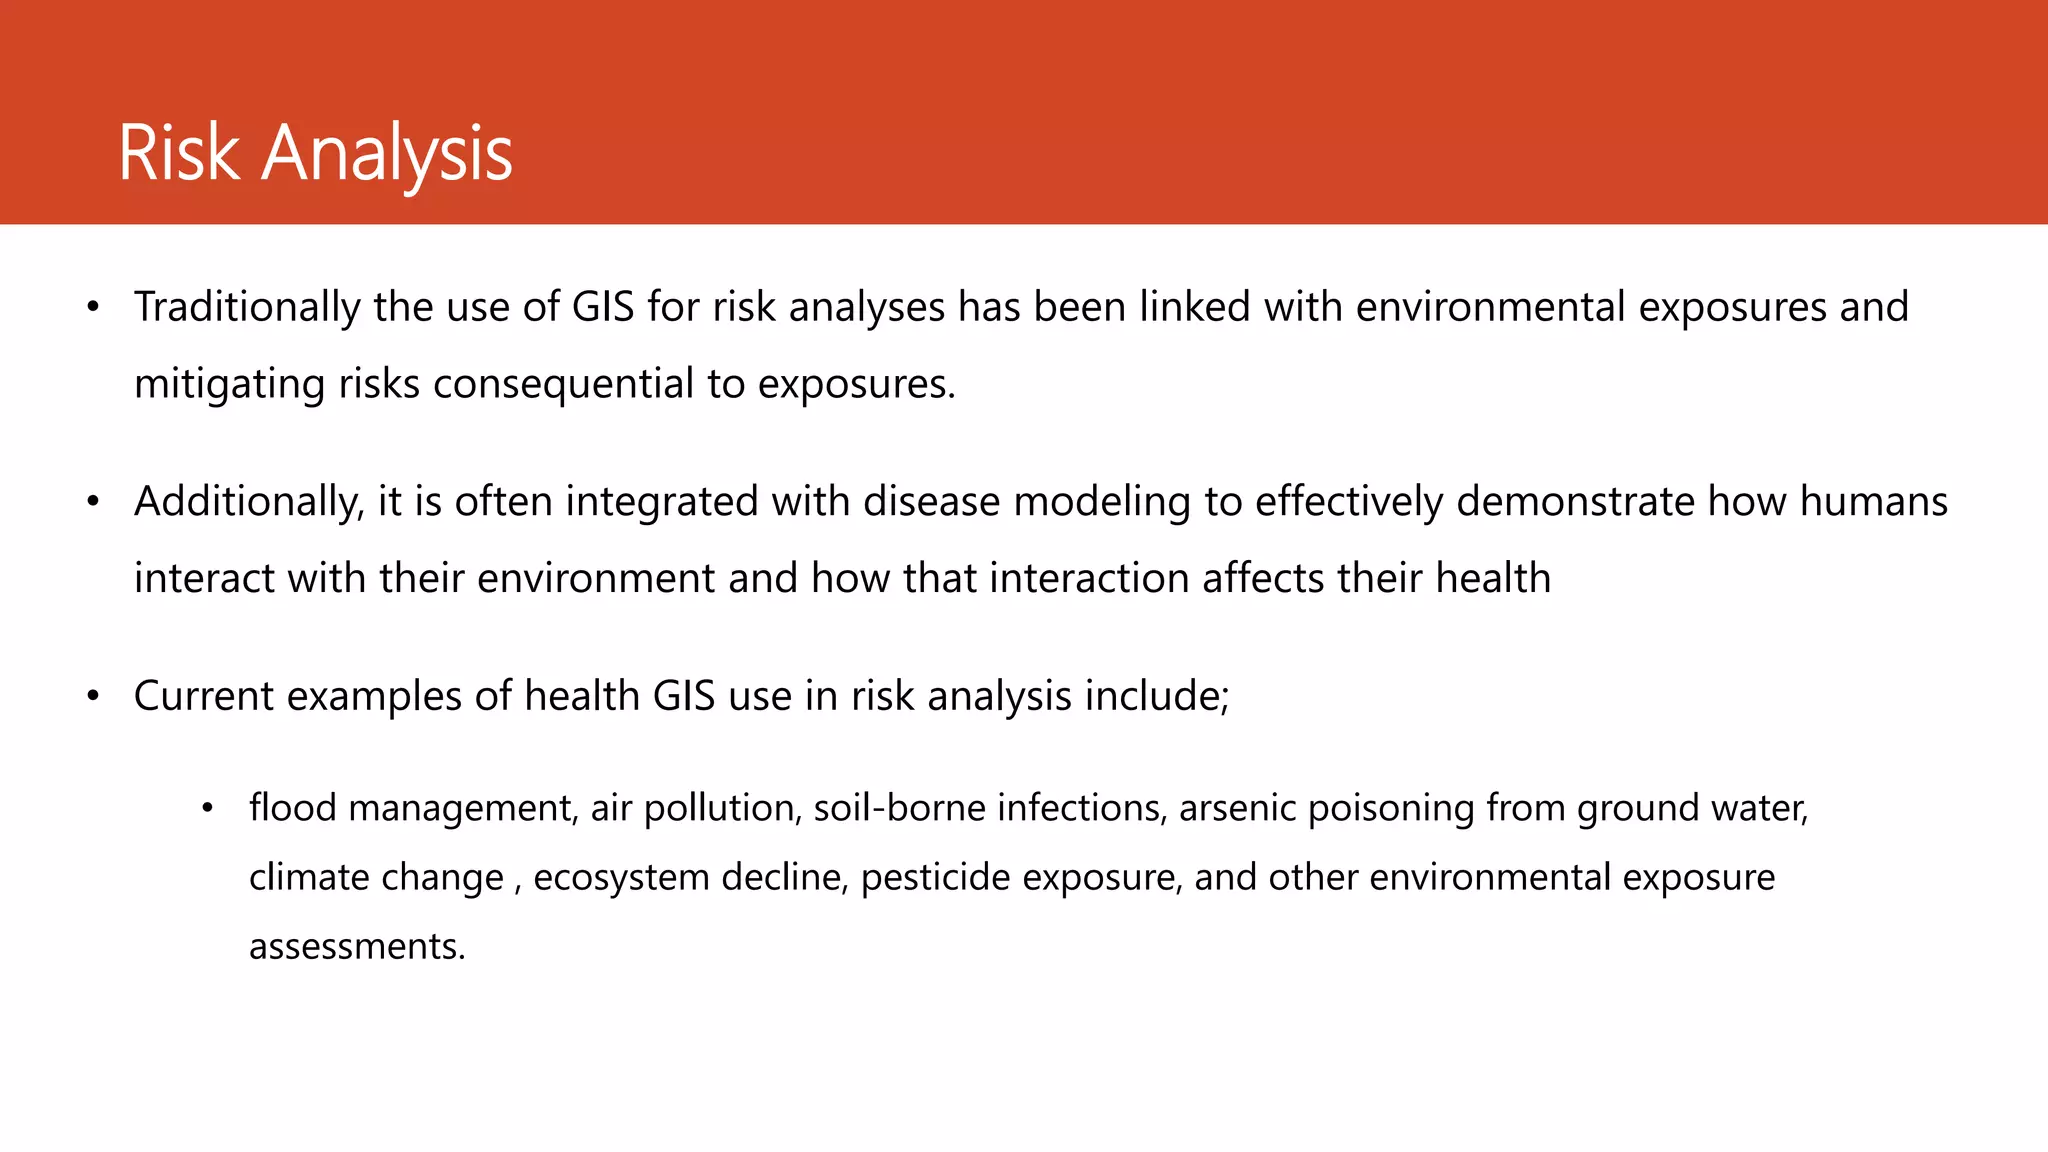
Geographic Information System
(GIS) and Epidemiology
Shailendra Kumar Singh
MPH, MA, MPA (Tribhuvan University), BPH
📧 withshailendra@gmail.com
✆ 9842354302
Information
• Data put into context
• Data
• raw, unorganized facts that need to be processed
• can be something simple and seemingly random and
useless until it is organized
• Information
• When data is processed, organized, structured or
presented in a given context so as to make it useful, it is
called information
Information System
• Transforming data into information and evidence to inform policy for better decision
making and impact generation.
• Formal, sociotechnical, organizational systems designed to collect, process, store, and
distribute information
• In a sociotechnical perspective, information systems are composed by four
components:
• task,
• people,
• structure (or roles), and
• technology
Data
Information
EvidenceKnowledge
Decisions
Impact
Compile, manage
and analyze
Integrate,
interpret and
evaluate
Presentation
Influence
Implement
Monitor indicators
Information System
Geography
• Geography (from Greek, geographia, literally "earth description") is a field of science devoted to the study of the
lands, features, inhabitants, and phenomena of the Earth and planet
• Geography is often defined in terms of two branches: human geography and physical geography.
• Human geography deals with the study of people and their communities, cultures, economies, and interactions
with the environment by studying their relations with and across space and place.
• Physical geography deals with the study of processes and patterns in the natural environment like
the atmosphere, hydrosphere, biosphere, and geosphere.
• The interdisciplinary nature of the geographical approach depends on an attentiveness to the relationship between
physical and human phenomena and its spatial patterns
Geographic Information System (GIS)
• A Geographic Information System (GIS) is a
system designed to capture, store, manipulate,
analyze, manage, and present spatial
or geographic data.
• “A geographical information system (GIS) is a
computer system for capturing, storing, checking,
integrating, manipulating, analyzing and
displaying data related to positions on the Earth's
surface. It is thus a way of linking databases with
maps, to display information, perform spatial
analyses or develop and apply spatial model.”
-WHO
Geographic Information Systems (GIS)
• Geographic Information Systems (GIS) are a set that consists of
equipment, software, databases which contain a satisfactory collection,
storage, information, management, analysis and presentation of all
types of geographic information.
• It is attached to many operations and has many applications related to
engineering, planning, management, transport/logistics, insurance,
telecommunications, and business.
• GIS can relate unrelated information by using location as the key index
variable.
• Locations or extents in the Earth space–time may be recorded as
dates/times of occurrence, and x, y, and
z coordinates representing, longitude, latitude, and elevation,
respectively.
Geographic Information System (GIS)
• These abilities distinguish GIS from other information systems and make it valuable to a
wide range of public and private enterprises for explaining events, predicting outcomes,
and planning strategies.
• The component parts of a GIS include not just a database, but also spatial or map
information and some mechanism to link them together.
• GIS can use any information that includes location. The location can be expressed in many
different ways, such as latitude and longitude, address, or ZIP code.
• Mapmaking and geographic analysis are not new, but a GIS performs these tasks better
and faster than do the old manual methods.
How GIS Works
• A GIS stores information about the
world as a collection of thematic
layers that can be linked together by
geography.
• This simple but extremely powerful
and versatile concept has proven
invaluable for solving many real-world
problems from tracking delivery
vehicles, to recording details of
planning applications, to modeling
global atmospheric circulation.
How GIS works
• Geographic References
• Geographic information contains either an explicit geographic reference, such as a
latitude and longitude or national grid coordinate, or an implicit reference such as an
address, postal code, census tract name, forest stand identifier, or road name.
• An automated process called geocoding is used to create explicit geographic
references (multiple locations) from implicit references (descriptions such as
addresses).
• These geographic references allow you to locate features, such as a business or
forest stand, and events, such as an earthquake, on the earth's surface for
analysis.
How GIS works
• Vector and Raster Models
• Geographic information systems work with two fundamentally different
types of geographic models--the "vector" model and the "raster" model.
• In the vector model, information about points, lines, and polygons is
encoded and stored as a collection of x,y coordinates.
• The location of a point feature, such as a bore hole, can be described by a
single x,y coordinate.
• Linear features, such as roads and rivers, can be stored as a collection of
point coordinates.
• Polygonal features, such as sales territories and river catchments, can be
stored as a closed loop of coordinates.
• The vector model is extremely useful for describing discrete features, but
less useful for describing continuously varying features such as soil type or
accessibility costs for hospitals.
• The raster model has evolved to model such continuous features.
• A raster image comprises a collection of grid cells rather like a scanned
map or picture.
Components of GIS
1.People: range from
technical specialists who
design and maintain the
system to those who use it
2. Methods and procedure
3. Data
4. Hardware:
5. Software:
6. Network
1. People:
2.Methods and procedure:
operates according to a
well-designed plan and
business rules, which are the
models and operating
practices unique to each
organization.
3. Data
4. Hardware:
5. Software:
6. Network
1. People:
2. Methods and procedure:
3.Data: Possibly the most
important component of a
GIS is the data. Geographic
data and related tabular
data can be collected in-
house or purchased from a
commercial data provider.
4. Hardware:
5. Software:
6. Network
1. People:
2. Methods and procedure:
3. Data:
4. Hardware: the computer on
which a GIS operates. Today,
GIS software runs on a wide
range of hardware types, from
centralized computer servers
to desktop computers used in
stand-alone or networked
configurations
5. Software:
6. Network
1. People:
2. Methods and procedure:
3. Data:
4. Hardware:
5.Software: GIS software provides the
functions and tools needed to store, analyze, and
display geographic information. Key software
components are
• Tools for the input and manipulation of geographic
information
• A database management system (DBMS)
• Tools that support geographic query, analysis, and
visualization
• A graphical user interface (GUI) for easy access to
tools
6. Network
Uses of GIS
1. Map Where Things Are:
2. Map Quantities
3. Map Densities
4. Find out What’s Inside
5. Find What’s Nearby
6. Map Changes
Map Where Things Are:
• Their most basic use
• Whether that be merely to identify an individual feature is, such as the
location of an emergency room, or to look at the distribution of
features on a map to more clearly visualize the emergence of patterns.
Map Quantities
• We can map quantities, such as where the most, and least, of
something is to find places that meet specified criteria and
take action.
• For example, we could look at which jurisdiction in a country has the
highest percentage of children classified
as obese or overweight.
• However, knowing which area has the greatest problem with obesity
in children is helpful but not really enough to aid us in planning
services.
Map Densities
• By mapping density we can map areas with different populations on an equivalent
basis.
• That is, we can map areas which may vary greatly in size but have smaller numbers
of people against smaller geographic areas that have larger numbers of people to
see the true density of the feature we are looking at.
• Although we must be careful again to truly understand what we are mapping.
• For example, health care maps will almost always show concentrations of disease
around major urban settings.
• This doesn’t necessarily mean that urban settings have a causal link with that
disease, but more likely that families with chronically ill members will actually move
into those urban settings in order to access specialized care.
Find out What’s Inside
• With GIS we can also look at what’s happening inside a specific area;
such as mapping the movement of equipment, staff and patients as
they move around within a hospital to help with the tracking of
infection
Find What’s Nearby
• Likewise, we can map what’s occurring within a set distance of a
feature.
• If we see increased mortality in a specific area we can look to see what
might be causing that.
• It could be as simple as there being a palliative care facility in the area
Map Change
• We can map the change in an area to anticipate future conditions,
decide on a course of action, or to evaluate
the results of an action or policy.
• For example, we can study how emergency patterns change from day
to day to help decide where to standby ambulances.
Geographic Information Systems (GIS) and
Epidemiology
Geographic Information System and Epidemiology
Muhammad ibn Zakariya al-Razi (854–925 CE), was
a Persian polymath, physician, alchemist, philosopher, and important
figure in the history of medicine.
• As health phenomena have revealed strong spatial aspects, maps can show
spatial distribution and spatial patterns of diseases.
• Epidemiologists, public health professionals, medical geographers have
traditionally used maps when analyzing associations between location,
environment, and disease.
• Analyzing and mapping the spatial aspects of disease can improve our
understanding of disease etiology, facilitate work with therapists to educate
the public, and enhance decision making on programs that aim to prevent
illnesses.
• Recent advances in Geographical Information System and Mapping
Technologies and increased awareness have created new opportunities for
public health administrators to enhance their planning, analysis and
monitoring capabilities
Geographic Information System and Epidemiology
• Remote sensing and GIS are becoming essential tools in public health,
being used not only to map the spatial distribution of disease
prevalence but also for disease surveillance, epidemiological research,
and providing the guidelines for decision making.
• Applied GIS and remote sensing are becoming essential tools in
mapping epidemiological information, disease surveillance, health
monitoring, surveying, sampling design, disease control programs and
predicting disease transmission.
• It has become a significant decision making tool in public health
epidemiology.
Geographic Information System and Epidemiology
• GIS has in-built facilities of conventional and the scientific knowledge of
traditional, fundamental concepts of formal mapping with signs and symbols,
variety of colors, shades, lines and poly lines, patterns, etc.
• GIS has computer-aided designs, symbols and colors for thematic mapping or
customized mapping, and perhaps, embedding mapping facilities, overlay
analysis, cluster analysis, nearest neighborhood analysis, pattern recognition,
temporal analysis, interpolation of point data, spatial correlation, linear
determinant analysis, the probability of minimum and maximum likelihood
analysis etc., of geospatial analysis of thematic information.
• Thus, remote sensing and GIS could be used for mapping and studying and
analysing the information relevant to the disease transmission of public health
epidemiology with reference to space and time.
Geographic Information System and Epidemiology
GIS use in Public Health
1. Analyzing need for health care;
2. Analyzing access to health care,
1. Measuring access,
2. Evaluating inequalities in access;
3. Geographic variation in utilization; and
4. GIS & health care delivery,
1. Locating health services,
2. Spatial decision support systems, and
3. GIS & disasters
(Source: McLafferty SL. GIS and health care. Annu Rev Public Health
2003;24:25-42.
GIS Use in Epidemiology and Public Health
1) Disease surveillance,
2) Risk analysis;
3) Health access and planning; and
4) Community health profiling
(Source: Nykiforuk CI, Flaman LM. Geographic information systems (GIS) for health promotion
and public health: a review. Health Promot Pract 2011;12:63-73.)
Disease surveillance
• Disease surveillance is an epidemiological practice that monitors the spread of
disease in order to establish patterns of progression.
• A key component of modern disease surveillance is disease case reporting.
• Examples of the diseases currently been surveilled in both developed and
undeveloped countries using GIS are
• tropical diseases, parasites, rabies epidemic, malaria, HIV/AIDS in India & South Africa,
cancer, communicable diseases, cholera, and sleeping sickness
Risk Analysis
• Traditionally the use of GIS for risk analyses has been linked with environmental exposures and
mitigating risks consequential to exposures.
• Additionally, it is often integrated with disease modeling to effectively demonstrate how humans
interact with their environment and how that interaction affects their health
• Current examples of health GIS use in risk analysis include;
• flood management, air pollution, soil-borne infections, arsenic poisoning from ground water,
climate change , ecosystem decline, pesticide exposure, and other environmental exposure
assessments.
Health Access and Planning
• GIS use in health access and planning usually relates directly to analyzing market segmentation and network
analysis.
• That is, developing an understanding of the physical location of health services and the distance and ability to
travel
between them.
• This is an area where GIS has been used extensively in both developed developing countries.
• Health GIS is also being used in projects depicting key indicators of drug policy development over time,
general access & quality of services studies, developing a model for determining the appropriate means of
trauma transport, understanding the relationship that proximity to primary care clinics has on health
outcomes in an urban setting, nursing workforce distribution planning, travel related health, the provision of
vision services, sledding injuries, trauma management, injury research and modeling ambulance response
times
Community Health Profiling
• The mapping of community characteristics, such as ethnic identification, socio-economic
status, gender, health behaviors, mortality and morbidity, together combine to provide profiles
of population groups which allows for the explanation of general relationships between health
and setting.
History of GIS in WHO, goals and strategic objectives
• The public health and GIS program used by WHO was firstly developed in 1993 with UNICEF to push the
attempt to prevent the spread of the guinea worm disease that occurs in isolated, poor rural areas.
• The main goal of this program was to strengthen the capacities of infectious diseases and public health
programs at local, national and global levels through the use of GIS and mapping technologies (WHO,
2010). The program has two main objectives:
• To strengthen national surveillance, prevention and control activities through the delivery of user friendly data
collection, management and mapping applications.
• To strengthen the management, analysis and monitoring of priority infectious diseases at global levels,
through the development of rapid electronic surveillance systems supported by user-friendly web based
mapping.
The Health Mapper
• The Health Mapper is a GIS tool developed by WHO to provide critical
information concerning with WHO infectious disease programs at national and
global levels.
• It is a user-friendly data management and mapping system customized
specifically for public health users. The system facilitates data standardization,
collection and updating of data on epidemiology and on interventions and
provides immediate visualization of data in the form of maps, tables and charts.
The purposes of the Health Mapper tool
• To give public health users a readymade standardized digital database containing information
considered essential by most of them including country boundary maps, environmental factors (such as
lakes, rivers, elevation) as well as vital information on basic population and basic health, school and
water infrastructures.
• Provide the user with user-friendly icon driven functions to automatically create maps, tables and
charts
of their data.
• Provide a simple data management interface in which the user can easily enter and update public
health
indicators in a standard geographic format.
• Make the system coherent to operate at both local and global levels.
• Provide the above to the users at low or no cost
Global Health Atlas
• WHO has launched the first global online atlas of infectious diseases, a new tool for infectious disease
surveillance and control which builds on the features of the Health Mapper.
• Over 300 indicators for more than 20 infectious diseases of major public health concern are included in
the database.
• In a single electronic platform, the Atlas is bringing together for analysis and comparison standardized
data and
statistics for individual diseases and indicators at country, regional, and global levels.
• The analysis and interpretation of data are further supported through information on demography,
socioeconomic conditions, and environmental factors.
• Maps are used to display data on the prevalence of individual diseases, the location of at risk
populations and vector habitats, and patterns of antimicrobial drug resistance.
• Such maps offer easy visualization of conditions ranging from the number of villages infected
with guinea worm disease, through the monitoring of polio surveillance in a selected country,
to the status of resistance to chloroquine throughout the African continent.
• The global health atlas has three different interfaces for using data, which are explored in the
next sections.
Global Health Atlas
Data Query
• This interface allows users to browse, view, query, search the contents of the WHO’s
Communicable Disease global database and output data in reports, charts and maps.
Interactive Mapping
• Interactive mapping provides a user-friendly mapping interface that allows users to select geographic areas
of
interest and create maps of diseases, the location of health facilities, schools, roads, geographic features.
• Interactive features allow users to select layers of additional information to be displayed on maps and the
specific areas where interventions have been applied.
• For the purpose of reports, data can be displayed as charts, graphs, and tables of country-specific statistics.
• Trends over time can be assessed, and situations in different countries can be compared, either for a single
or several diseases.
WHO link
https://www.healthmap.org/en/
Commonly used GIS programs
• As of January 2018, WHO has reached an
agreement with ESRI (an international
supplier of GIS software) for an unlimited use
of ArcGIS Desktop program.
• Open-source GIS There are several open-
source GIS programs and analytical tools
with GIS mapping capabilities available on
market. These programs include, but not
limited to:
• Stand-alone GIS application
• QGIS* (Quantum GIS)
• ArcGIS
• GRASS (Geographic Resources Analysis
Support System)
• Analytical tool with GIS/mapping
capabilities
• R
• GeoDa
• EpiInfo
• HealthMapper
GIS in Nepal
• The National Remote Sensing Center was the pioneer organization to establish the history of digital spatial
database of Nepal which was established with the financial and technical support of USAID in 1979.
• Government of Nepal has released its forest coverage map of Nepal based on Multi Spectral Scanner (MSS)
data of American Remote Sensing Satellite i.e. LANDSAT in early 1980s.
• After the Ninth Five Year Plan (1995-2002) the Government of Nepal has been incorporating the use of GIS and
RS technology for the preparation of land use map of the country as a key planning aid
• The GIS laboratory within the country was established in the National Planning Commission Secretariat with a
view to strengthening the decentralized planning activities with the support of UNDP in 1992.
• This includes geo-physical information on river systems, road systems, boundaries, land utilization among
others, and socio-economic information such as human settlement database, household and resource
information, agriculture or food production database and flood damage data.
• The program shares its information with other organizations, especially with the districts in its working area and
also with different line ministries, educational institutions, organizations and even individuals.
• It sells its data as per guidelines set by the National Planning Commission.
• Application of GIS is becoming especially popular in the districts since NPC has categorically mentioned its use
in the national and district level planning and decision-making process.
GIS in Health System of Nepal
• GIS has been incepted and in the process of institutionalize in the health system.
• This is guided by NHSP, periodic Development Plans, Health Sector Information System-National
Strategy(HSIS-NS) and information, Communication and Technology Policy of the Government of
Nepal.
• This adoption is also reinforced by e-health, HealthGIS and need for integration of information
systems.
• Health Facility Mapping Survey(HFMS) has been carried out in 57 districts with technical and
financial support from WHO and further processing for remaining 18 districts is going on.
• The completion of this survey is expected to result in geographic feature embedded planning,
monitoring and evaluation in the health system.
Thank you!
Q: How did the geography student drown?
A: His grades were below C-Level!
Find out more at the PowerPoint Getting Started Center

Geographic information system (gis)

  • 1.
    Geographic Information System (GIS)and Epidemiology Shailendra Kumar Singh MPH, MA, MPA (Tribhuvan University), BPH 📧 withshailendra@gmail.com ✆ 9842354302
  • 2.
    Information • Data putinto context • Data • raw, unorganized facts that need to be processed • can be something simple and seemingly random and useless until it is organized • Information • When data is processed, organized, structured or presented in a given context so as to make it useful, it is called information
  • 3.
    Information System • Transformingdata into information and evidence to inform policy for better decision making and impact generation. • Formal, sociotechnical, organizational systems designed to collect, process, store, and distribute information • In a sociotechnical perspective, information systems are composed by four components: • task, • people, • structure (or roles), and • technology
  • 4.
    Data Information EvidenceKnowledge Decisions Impact Compile, manage and analyze Integrate, interpretand evaluate Presentation Influence Implement Monitor indicators Information System
  • 5.
    Geography • Geography (fromGreek, geographia, literally "earth description") is a field of science devoted to the study of the lands, features, inhabitants, and phenomena of the Earth and planet • Geography is often defined in terms of two branches: human geography and physical geography. • Human geography deals with the study of people and their communities, cultures, economies, and interactions with the environment by studying their relations with and across space and place. • Physical geography deals with the study of processes and patterns in the natural environment like the atmosphere, hydrosphere, biosphere, and geosphere. • The interdisciplinary nature of the geographical approach depends on an attentiveness to the relationship between physical and human phenomena and its spatial patterns
  • 6.
    Geographic Information System(GIS) • A Geographic Information System (GIS) is a system designed to capture, store, manipulate, analyze, manage, and present spatial or geographic data. • “A geographical information system (GIS) is a computer system for capturing, storing, checking, integrating, manipulating, analyzing and displaying data related to positions on the Earth's surface. It is thus a way of linking databases with maps, to display information, perform spatial analyses or develop and apply spatial model.” -WHO
  • 7.
    Geographic Information Systems(GIS) • Geographic Information Systems (GIS) are a set that consists of equipment, software, databases which contain a satisfactory collection, storage, information, management, analysis and presentation of all types of geographic information. • It is attached to many operations and has many applications related to engineering, planning, management, transport/logistics, insurance, telecommunications, and business. • GIS can relate unrelated information by using location as the key index variable. • Locations or extents in the Earth space–time may be recorded as dates/times of occurrence, and x, y, and z coordinates representing, longitude, latitude, and elevation, respectively.
  • 8.
    Geographic Information System(GIS) • These abilities distinguish GIS from other information systems and make it valuable to a wide range of public and private enterprises for explaining events, predicting outcomes, and planning strategies. • The component parts of a GIS include not just a database, but also spatial or map information and some mechanism to link them together. • GIS can use any information that includes location. The location can be expressed in many different ways, such as latitude and longitude, address, or ZIP code. • Mapmaking and geographic analysis are not new, but a GIS performs these tasks better and faster than do the old manual methods.
  • 9.
    How GIS Works •A GIS stores information about the world as a collection of thematic layers that can be linked together by geography. • This simple but extremely powerful and versatile concept has proven invaluable for solving many real-world problems from tracking delivery vehicles, to recording details of planning applications, to modeling global atmospheric circulation.
  • 10.
    How GIS works •Geographic References • Geographic information contains either an explicit geographic reference, such as a latitude and longitude or national grid coordinate, or an implicit reference such as an address, postal code, census tract name, forest stand identifier, or road name. • An automated process called geocoding is used to create explicit geographic references (multiple locations) from implicit references (descriptions such as addresses). • These geographic references allow you to locate features, such as a business or forest stand, and events, such as an earthquake, on the earth's surface for analysis.
  • 11.
    How GIS works •Vector and Raster Models • Geographic information systems work with two fundamentally different types of geographic models--the "vector" model and the "raster" model. • In the vector model, information about points, lines, and polygons is encoded and stored as a collection of x,y coordinates. • The location of a point feature, such as a bore hole, can be described by a single x,y coordinate. • Linear features, such as roads and rivers, can be stored as a collection of point coordinates. • Polygonal features, such as sales territories and river catchments, can be stored as a closed loop of coordinates. • The vector model is extremely useful for describing discrete features, but less useful for describing continuously varying features such as soil type or accessibility costs for hospitals. • The raster model has evolved to model such continuous features. • A raster image comprises a collection of grid cells rather like a scanned map or picture.
  • 12.
    Components of GIS 1.People:range from technical specialists who design and maintain the system to those who use it 2. Methods and procedure 3. Data 4. Hardware: 5. Software: 6. Network 1. People: 2.Methods and procedure: operates according to a well-designed plan and business rules, which are the models and operating practices unique to each organization. 3. Data 4. Hardware: 5. Software: 6. Network 1. People: 2. Methods and procedure: 3.Data: Possibly the most important component of a GIS is the data. Geographic data and related tabular data can be collected in- house or purchased from a commercial data provider. 4. Hardware: 5. Software: 6. Network 1. People: 2. Methods and procedure: 3. Data: 4. Hardware: the computer on which a GIS operates. Today, GIS software runs on a wide range of hardware types, from centralized computer servers to desktop computers used in stand-alone or networked configurations 5. Software: 6. Network 1. People: 2. Methods and procedure: 3. Data: 4. Hardware: 5.Software: GIS software provides the functions and tools needed to store, analyze, and display geographic information. Key software components are • Tools for the input and manipulation of geographic information • A database management system (DBMS) • Tools that support geographic query, analysis, and visualization • A graphical user interface (GUI) for easy access to tools 6. Network
  • 13.
    Uses of GIS 1.Map Where Things Are: 2. Map Quantities 3. Map Densities 4. Find out What’s Inside 5. Find What’s Nearby 6. Map Changes
  • 14.
    Map Where ThingsAre: • Their most basic use • Whether that be merely to identify an individual feature is, such as the location of an emergency room, or to look at the distribution of features on a map to more clearly visualize the emergence of patterns.
  • 15.
    Map Quantities • Wecan map quantities, such as where the most, and least, of something is to find places that meet specified criteria and take action. • For example, we could look at which jurisdiction in a country has the highest percentage of children classified as obese or overweight. • However, knowing which area has the greatest problem with obesity in children is helpful but not really enough to aid us in planning services.
  • 16.
    Map Densities • Bymapping density we can map areas with different populations on an equivalent basis. • That is, we can map areas which may vary greatly in size but have smaller numbers of people against smaller geographic areas that have larger numbers of people to see the true density of the feature we are looking at. • Although we must be careful again to truly understand what we are mapping. • For example, health care maps will almost always show concentrations of disease around major urban settings. • This doesn’t necessarily mean that urban settings have a causal link with that disease, but more likely that families with chronically ill members will actually move into those urban settings in order to access specialized care.
  • 17.
    Find out What’sInside • With GIS we can also look at what’s happening inside a specific area; such as mapping the movement of equipment, staff and patients as they move around within a hospital to help with the tracking of infection
  • 18.
    Find What’s Nearby •Likewise, we can map what’s occurring within a set distance of a feature. • If we see increased mortality in a specific area we can look to see what might be causing that. • It could be as simple as there being a palliative care facility in the area
  • 19.
    Map Change • Wecan map the change in an area to anticipate future conditions, decide on a course of action, or to evaluate the results of an action or policy. • For example, we can study how emergency patterns change from day to day to help decide where to standby ambulances.
  • 20.
    Geographic Information Systems(GIS) and Epidemiology
  • 21.
    Geographic Information Systemand Epidemiology Muhammad ibn Zakariya al-Razi (854–925 CE), was a Persian polymath, physician, alchemist, philosopher, and important figure in the history of medicine.
  • 22.
    • As healthphenomena have revealed strong spatial aspects, maps can show spatial distribution and spatial patterns of diseases. • Epidemiologists, public health professionals, medical geographers have traditionally used maps when analyzing associations between location, environment, and disease. • Analyzing and mapping the spatial aspects of disease can improve our understanding of disease etiology, facilitate work with therapists to educate the public, and enhance decision making on programs that aim to prevent illnesses. • Recent advances in Geographical Information System and Mapping Technologies and increased awareness have created new opportunities for public health administrators to enhance their planning, analysis and monitoring capabilities Geographic Information System and Epidemiology
  • 23.
    • Remote sensingand GIS are becoming essential tools in public health, being used not only to map the spatial distribution of disease prevalence but also for disease surveillance, epidemiological research, and providing the guidelines for decision making. • Applied GIS and remote sensing are becoming essential tools in mapping epidemiological information, disease surveillance, health monitoring, surveying, sampling design, disease control programs and predicting disease transmission. • It has become a significant decision making tool in public health epidemiology. Geographic Information System and Epidemiology
  • 24.
    • GIS hasin-built facilities of conventional and the scientific knowledge of traditional, fundamental concepts of formal mapping with signs and symbols, variety of colors, shades, lines and poly lines, patterns, etc. • GIS has computer-aided designs, symbols and colors for thematic mapping or customized mapping, and perhaps, embedding mapping facilities, overlay analysis, cluster analysis, nearest neighborhood analysis, pattern recognition, temporal analysis, interpolation of point data, spatial correlation, linear determinant analysis, the probability of minimum and maximum likelihood analysis etc., of geospatial analysis of thematic information. • Thus, remote sensing and GIS could be used for mapping and studying and analysing the information relevant to the disease transmission of public health epidemiology with reference to space and time. Geographic Information System and Epidemiology
  • 25.
    GIS use inPublic Health 1. Analyzing need for health care; 2. Analyzing access to health care, 1. Measuring access, 2. Evaluating inequalities in access; 3. Geographic variation in utilization; and 4. GIS & health care delivery, 1. Locating health services, 2. Spatial decision support systems, and 3. GIS & disasters (Source: McLafferty SL. GIS and health care. Annu Rev Public Health 2003;24:25-42.
  • 26.
    GIS Use inEpidemiology and Public Health 1) Disease surveillance, 2) Risk analysis; 3) Health access and planning; and 4) Community health profiling (Source: Nykiforuk CI, Flaman LM. Geographic information systems (GIS) for health promotion and public health: a review. Health Promot Pract 2011;12:63-73.)
  • 27.
    Disease surveillance • Diseasesurveillance is an epidemiological practice that monitors the spread of disease in order to establish patterns of progression. • A key component of modern disease surveillance is disease case reporting. • Examples of the diseases currently been surveilled in both developed and undeveloped countries using GIS are • tropical diseases, parasites, rabies epidemic, malaria, HIV/AIDS in India & South Africa, cancer, communicable diseases, cholera, and sleeping sickness
  • 28.
    Risk Analysis • Traditionallythe use of GIS for risk analyses has been linked with environmental exposures and mitigating risks consequential to exposures. • Additionally, it is often integrated with disease modeling to effectively demonstrate how humans interact with their environment and how that interaction affects their health • Current examples of health GIS use in risk analysis include; • flood management, air pollution, soil-borne infections, arsenic poisoning from ground water, climate change , ecosystem decline, pesticide exposure, and other environmental exposure assessments.
  • 29.
    Health Access andPlanning • GIS use in health access and planning usually relates directly to analyzing market segmentation and network analysis. • That is, developing an understanding of the physical location of health services and the distance and ability to travel between them. • This is an area where GIS has been used extensively in both developed developing countries. • Health GIS is also being used in projects depicting key indicators of drug policy development over time, general access & quality of services studies, developing a model for determining the appropriate means of trauma transport, understanding the relationship that proximity to primary care clinics has on health outcomes in an urban setting, nursing workforce distribution planning, travel related health, the provision of vision services, sledding injuries, trauma management, injury research and modeling ambulance response times
  • 30.
    Community Health Profiling •The mapping of community characteristics, such as ethnic identification, socio-economic status, gender, health behaviors, mortality and morbidity, together combine to provide profiles of population groups which allows for the explanation of general relationships between health and setting.
  • 31.
    History of GISin WHO, goals and strategic objectives • The public health and GIS program used by WHO was firstly developed in 1993 with UNICEF to push the attempt to prevent the spread of the guinea worm disease that occurs in isolated, poor rural areas. • The main goal of this program was to strengthen the capacities of infectious diseases and public health programs at local, national and global levels through the use of GIS and mapping technologies (WHO, 2010). The program has two main objectives: • To strengthen national surveillance, prevention and control activities through the delivery of user friendly data collection, management and mapping applications. • To strengthen the management, analysis and monitoring of priority infectious diseases at global levels, through the development of rapid electronic surveillance systems supported by user-friendly web based mapping.
  • 32.
    The Health Mapper •The Health Mapper is a GIS tool developed by WHO to provide critical information concerning with WHO infectious disease programs at national and global levels. • It is a user-friendly data management and mapping system customized specifically for public health users. The system facilitates data standardization, collection and updating of data on epidemiology and on interventions and provides immediate visualization of data in the form of maps, tables and charts.
  • 33.
    The purposes ofthe Health Mapper tool • To give public health users a readymade standardized digital database containing information considered essential by most of them including country boundary maps, environmental factors (such as lakes, rivers, elevation) as well as vital information on basic population and basic health, school and water infrastructures. • Provide the user with user-friendly icon driven functions to automatically create maps, tables and charts of their data. • Provide a simple data management interface in which the user can easily enter and update public health indicators in a standard geographic format. • Make the system coherent to operate at both local and global levels. • Provide the above to the users at low or no cost
  • 34.
    Global Health Atlas •WHO has launched the first global online atlas of infectious diseases, a new tool for infectious disease surveillance and control which builds on the features of the Health Mapper. • Over 300 indicators for more than 20 infectious diseases of major public health concern are included in the database. • In a single electronic platform, the Atlas is bringing together for analysis and comparison standardized data and statistics for individual diseases and indicators at country, regional, and global levels. • The analysis and interpretation of data are further supported through information on demography, socioeconomic conditions, and environmental factors.
  • 35.
    • Maps areused to display data on the prevalence of individual diseases, the location of at risk populations and vector habitats, and patterns of antimicrobial drug resistance. • Such maps offer easy visualization of conditions ranging from the number of villages infected with guinea worm disease, through the monitoring of polio surveillance in a selected country, to the status of resistance to chloroquine throughout the African continent. • The global health atlas has three different interfaces for using data, which are explored in the next sections. Global Health Atlas
  • 36.
    Data Query • Thisinterface allows users to browse, view, query, search the contents of the WHO’s Communicable Disease global database and output data in reports, charts and maps.
  • 37.
    Interactive Mapping • Interactivemapping provides a user-friendly mapping interface that allows users to select geographic areas of interest and create maps of diseases, the location of health facilities, schools, roads, geographic features. • Interactive features allow users to select layers of additional information to be displayed on maps and the specific areas where interventions have been applied. • For the purpose of reports, data can be displayed as charts, graphs, and tables of country-specific statistics. • Trends over time can be assessed, and situations in different countries can be compared, either for a single or several diseases.
  • 38.
  • 39.
    Commonly used GISprograms • As of January 2018, WHO has reached an agreement with ESRI (an international supplier of GIS software) for an unlimited use of ArcGIS Desktop program. • Open-source GIS There are several open- source GIS programs and analytical tools with GIS mapping capabilities available on market. These programs include, but not limited to: • Stand-alone GIS application • QGIS* (Quantum GIS) • ArcGIS • GRASS (Geographic Resources Analysis Support System) • Analytical tool with GIS/mapping capabilities • R • GeoDa • EpiInfo • HealthMapper
  • 40.
    GIS in Nepal •The National Remote Sensing Center was the pioneer organization to establish the history of digital spatial database of Nepal which was established with the financial and technical support of USAID in 1979. • Government of Nepal has released its forest coverage map of Nepal based on Multi Spectral Scanner (MSS) data of American Remote Sensing Satellite i.e. LANDSAT in early 1980s. • After the Ninth Five Year Plan (1995-2002) the Government of Nepal has been incorporating the use of GIS and RS technology for the preparation of land use map of the country as a key planning aid • The GIS laboratory within the country was established in the National Planning Commission Secretariat with a view to strengthening the decentralized planning activities with the support of UNDP in 1992. • This includes geo-physical information on river systems, road systems, boundaries, land utilization among others, and socio-economic information such as human settlement database, household and resource information, agriculture or food production database and flood damage data. • The program shares its information with other organizations, especially with the districts in its working area and also with different line ministries, educational institutions, organizations and even individuals. • It sells its data as per guidelines set by the National Planning Commission. • Application of GIS is becoming especially popular in the districts since NPC has categorically mentioned its use in the national and district level planning and decision-making process.
  • 41.
    GIS in HealthSystem of Nepal • GIS has been incepted and in the process of institutionalize in the health system. • This is guided by NHSP, periodic Development Plans, Health Sector Information System-National Strategy(HSIS-NS) and information, Communication and Technology Policy of the Government of Nepal. • This adoption is also reinforced by e-health, HealthGIS and need for integration of information systems. • Health Facility Mapping Survey(HFMS) has been carried out in 57 districts with technical and financial support from WHO and further processing for remaining 18 districts is going on. • The completion of this survey is expected to result in geographic feature embedded planning, monitoring and evaluation in the health system.
  • 42.
    Thank you! Q: Howdid the geography student drown? A: His grades were below C-Level! Find out more at the PowerPoint Getting Started Center

Editor's Notes

  • #43 In Slide Show mode, click the arrow to enter the PowerPoint Getting Started Center.