SlideShare a Scribd company logo
1 of 7
Download to read offline
International Journal of Trend in Scientific Research and Development (IJTSRD)
Volume 5 Issue 4, May-June 2021 Available Online: www.ijtsrd.com e-ISSN: 2456 – 6470
@ IJTSRD | Unique Paper ID – IJTSRD42527 | Volume – 5 | Issue – 4 | May-June 2021 Page 1217
Geospatial Mapping of Health Facilities in Nangere
Local Government Area of Yobe State, Nigeria
Ibrahim Abubakar Audu1, Tijjani Bukar Lawan2
1Department of Environmental and Resource Management,
Usmanu Danfodiyo University Sokoto, Sokoto State, Nigeria
2Department of Geography, Yobe State University, Damaturu, Yobe State, Nigeria
ABSTRACT
This paper is aimed at mapping healthcare facilities in the Nangere Local
Government Area of Yobe State. Geospatial mapping of health care facilities
was achieved by taking the geographic coordinates of all the healthcare
facilities in the Local Government using the Global PositioningSystemGarmin
GPS map 76CS receiver. The data were analyzed using ArcGIS 10.8 version
software. The study identified primary and secondary health care facilities
without any tertiary health care facility and also without a single private
hospital or clinic across the entire eleven(11)political wardsofNangereLocal
Government Area. The findings revealed that 46 healthcare facilities were
distributed across the eleven (11) political wards in the Local Government
Area. The primary health care facilities (PHC) constituted 98 % (45)whilethe
secondary Health Care facilities (SHC) constituted 2 % (1). The average
nearest neighbor summary for the study area shows the significant level and
the critical level that indicates a random distribution pattern of health care
facilities in the area, however, it was unevenly distributed given the
concentration of health care facilities in Dazigau, Degubi, Darin, Pakarau, and
Tikau while other wards were inadequately served. However, both the
primary and secondary health care facilities were government-owned, the
study concluded that there were inequalities in the spatial distribution of
health care facilities in the Nangere Local GovernmentArea ofYobestate,thus
this disparity in the distribution of health facilities has generated different
accessibility level to health care facilitiesintheLGA,it,therefore, recommends
that; Government and the private organization should provide health care
facilities in the wards that do not have enough health care facilities. This will
further improve access to Health Care facilities in the study area.
KEYWORDS: GIS, Mapping, Healthcare Facilities, GPS
How to cite thispaper:IbrahimAbubakar
Audu | Tijjani Bukar Lawan "Geospatial
Mapping of Health Facilities in Nangere
Local Government Area of Yobe State,
Nigeria" Publishedin
International Journal
of Trend in Scientific
Research and
Development(ijtsrd),
ISSN: 2456-6470,
Volume-5 | Issue-4,
June 2021, pp.1217-
1223, URL:
www.ijtsrd.com/papers/ijtsrd42527.pdf
Copyright © 2021 by author (s) and
International Journal ofTrendinScientific
Research and Development Journal. This
is an Open Access article distributed
under the terms of
the Creative
Commons Attribution
License (CC BY 4.0)
(http: //creativecommons.org/licenses/by/4.0)
INTRODUCTION
Digital mapping has now become a critical method for addre
ssing a wide range of environmental issues. The technique
used for producing digital maps is dependent on the level of
details required, the use to which the map will be put, and
the sourced data. Digital mapping operations help
organizations achieve important analytical and operational
advantage. Location intelligence is enabling even non-
Geographic Information Systems (GIS) specialiststogainthe
advantage of using location to make more insightful
everyday decisions. The capabilityofGIStohandledata from
specific geographic locations, and the ability togather,store,
manipulate, analyze and visualizegeo-referenceddata offers
the opportunity to create a realistic perspective of theworld
and a chance to see the future action (Burrough, 2001). This
exceptional ability provides scientists, engineers,surveyors,
planners, and resource managers the opportunity to distill
and combine large sets ofspatial data intouseful information
offering a new perspectiveandfreshapproachestoproblem-
solving. The GIS is used in almost every aspect of our daily
lives, from earth science and other physical sciences to
finance and management. Thus, the data it uses also vary,
ranging from remote sensing, Global Positioning Systems
(GPS), conventional data collected byinsitu instruments and
questionnaires, etc.
These data that are either time series or spatial can be used
to show the spatial context of numerous fields and the
creation of models and forecasts of future occurrences.
Geospatial analysis and environmental health began to
interact with each other due to developments in computing.
The utility of this is in the ability to view maps and identify
areas of prevalent diseases, pest breeding grounds, spatial
population distribution for health studies, doctor-to-patient
ratio, and location of health facilities. For hazards ranging
from soil lead to particulates in the air, to disease-carrying
mosquitoes, researchers have used geospatial analysis to
examine where hazards exist in the environment and to
model their spatial distributions (Glass et al., 1995). Initial
GIS applications in environmental health include analysis of
spatial clustering of childhood leukemia concerning nuclear
facilities in England (Openshaw etal.,1988),a studythatlaid
the groundwork for the extensive body of research on GIS-
based analysis of spatial disease clusters.Otherearlystudies
include (McMaster, 1988) GIS assessment of community
vulnerability to hazardous materials and (Wartenberg,
IJTSRD42527
International Journal of Trend in Scientific Research and Development (IJTSRD) @ www.ijtsrd.com eISSN: 2456-6470
@ IJTSRD | Unique Paper ID – IJTSRD42527 | Volume – 5 | Issue – 4 | May-June 2021 Page 1218
1992) and (Wartenberg et al., 1993) use of GIS to
characterize populations living near high-voltage
transmission lines.
The geospatial analysis tool, the GIS has been usedinvector-
borne disease studies to determinetheassociationsbetween
environmental features and vectorconcentrations(e.g.Glass
et al., 1995). From many recent studies, GIS was usedtomap
out vector-borne and zoonotic diseases such as Lyme
disease, viral meningitis, Hantavirus, Dengue Fever, Yellow
Fever, and rabies, among others, and their spatial
distribution. Ghosh (2001) used GIS to analyze the
association of urban environment features that facilitated
viral activities of West Nile Virus (WNV) and compared the
spatial association between WNV infected mosquito pools
and human cases with heterogeneous urban characteristics
in Minnesota USA between 2002 and 2007. His results
showed that WNV is considerably higher in areas close to
swamps, parks, and water discharge sites. Optimized the
accuracy of the applications of larvicides at mosquito
breeding sites in Dar-es-Salam Tanzania using GIS, they
employed community-based development ofsketchmapsof
the target areas that are termed participatory GIS and then
involved a procedure of verifying the sketched maps using
laminated aerial photographs in the field that are later
analyzed and digitized in a GIS system.
The level of details acquired assisted the government not
only in malaria monitoring but in the implementation of
council programs and spatially explicit analysis for research
and evaluation purposes. GIS has also been applied todepict
mobile hazards associated with, for example, traffic flows
and transportation of hazardous wastes (Lovett etal.,2006).
Advances ingeospatial technologiesandspace-timemethods
have greatly enhanced our ability to model and monitor the
spatial distributions and flows of environmental hazards.
Geospatial techniques have also been used toidentifyat-risk
populations (maps) exposed to radioactive iodine and lead
poisoning (Wartenberg, 1992). There are three important
functions of Geographical InformationSystem(GIS)inhealth
research and policy analysis: spatial database management,
visualization and mapping, and spatial analysis
(Cromley&McLafferty, 2002). WHO (1997)specifiedcriteria
for health care planning for third world countries and
indicated that each service area should cover a 4km2
catchment area with a population of 60,000 for primary
health care to have adequate and equity of access to health
centers. In line with WHO (1997), this study, therefore,
aimed to map the spatial distribution of health care centers
in Nangere LGA of Yobe State using GIS techniques. This aim
was achieved by identifying, mapping both public and
private health centers in the study area. The provision of
health care centers in Nigeria is a concurrent responsibility
of the three tiers of government thatincludeLocal,State, and
Federal Government institutions.
The Local Government is the least administrative unit, in
addition to this; private investors in healthcare delivery are
also visible. The Primary HealthCare (PHC) Department is
one of the five departments of each of the 774 Local
Government areas in the country that is charged with the
duty of ensuring that healthcare services are delivered in
their areas on an integrated and affordable basis. Location
mapping however is critical in reaching out to the people
within their respective areas of jurisdiction. The ability to
locate health facilities and identify theircapabilitiesinterms
of services and hours of operationhasbeenunderscored due
to a lack of proper mapping facilities.Unlikeinthedeveloped
world where all health facilities are of equal standard, in the
developing world, it is different. Abbas et al., (2012)
examined the spatial distribution of Healthcare facilities in
the Chikun local government area ofKaduna StateNigeria by
using GIS and GPS to map exiting ones, evaluate adequacy
based on World Health Organization standard and propose
new ones. However, their results neither show how queries
could be made to show both spatial and attribute
information from a database nor provide a visual map
portraying details of health facilities. Here, we provide
spatial distribution of healthcarefacilities,anda singlevisual
map of the health facilities, and the inventory of existing
healthcare facilities.
The Study Area
Nangere Local Government is located between latitudes
11°51’50’’ and 12°00’00’’ North of the Equator and between
longitudes 10°50’00’’ and 11°04’11’’ East of the Meridian.
The Nangere Local Government area situated in Yobe state,
North-East geopolitical zone of Nigeria and has its
headquarters in the town of SabonGariNangere. The local
government area has an projected population of 119,694
persons spread over a geographical area of980km²(Natinal
Population Commission, 2021). The study area has a total of
eleven (11) electoral wards namely: Langawa, Nangere,
Pakarau, Tikau,Chilariye, Chukuriwa, Dawasa, Dazigau,
Degubi, and Watinani wards (INEC, 2019). It is bounded by
the following local government areas; to the north by
Jakusko, to the east Fune, to the west Dambam Local
Government Area of Bauchi state, to the south Potiskum, to
the south/east Fika.
METHODOLOGY
Method of Data Collection
A checklist was used to acquire the attribute data of
identified healthcare facilities, the data include the name of
health care facility, political ward, category of healthcaree.g.
dispensary, clinic, health post, etc., and other relevant
information such as ownership i.e. public or private, year of
establishment, was used for the creation of health care
facility inventory for the study. TheGPS(Garmin76CSx) was
used to obtain the geographic locations of the health
facilities.
Method of Data Processing
The administrative map of the study area was scanned and
imported into ArcGIS 10.8 version software for geo-
referencing. Geo-referencing allowstheresearcherstorelate
a space object or raster object that has not been tied to any
geographic reference to a coordinate reference system. The
geo-referenced map was digitized on-screen under the
following themes: the Local Government Area and the
political ward as polygon, LGA, and ward boundary as lines
to portray the extent of the study area.
Method of Data Analysis
ArcGIS 10.8 version software was used for data analysis, the
GPS coordinates were imported into ArcGIS 10.8 interface,
all the shape files holding the relevant data layers were then
spatially overlaid to create a combination of visual map of
polygon, line, and point feature classes. Consequently, the x
and y spontaneously displayed the geo-referenced location
of each HCF in space, along with political wards as reflected
in their attribute tables, this aid to visualize the distribution
of all the types of HCFs in the study area. The Average
Nearest NeighborStatistics(ANNS)inferential statistical tool
International Journal of Trend in Scientific Research and Development (IJTSRD) @ www.ijtsrd.com eISSN: 2456-6470
@ IJTSRD | Unique Paper ID – IJTSRD42527 | Volume – 5 | Issue – 4 | May-June 2021 Page 1219
in ArcGIS10.8 was used to investigate the spatial pattern in
the data. The Kernel Density tool calculates the density of
features in a neighborhood around those features. This tool
automatically calculates for the LGA the average nearest
neighbor ratio by dividing the observed average distance by
the expected average distance.
RESULTS AND DISCUSSIONS
The result of the data set for the identified healthcare
facilities in the study area is displayed in Table 1, Table 2,
and Figure 1. The Tables and Figures show both inventories,
numerical and spatial distribution of the categoriesofhealth
care facilities in the study area. An inventory of all existing
healthcare facilitiesintheNangereLocal GovernmentArea is
shown in table 1 below. The inventory displays the name of
the facility, political ward, and types of facility, ownership,
and year of establishment, latitude, and longitude of each
health care facility in the study area.
Table 1: Inventories of Existing Health Care Facilities
No Name of Facility Ward Categories of HCF Ownership Year Latitude Longitude
1 GarinMuzam HP Chillariye Health Post Public 2013 11°41.054’ 11°00.057’
2 Chillariye PHCC Chillariye Primary Health Care Center Public 2003 11°41.957’ 10°59.436’
3 Dagare PHCC Darin Primary Health Care Center Public 2004 11°36.023’ 11°01.099’
4 Darin HP Darin Health Post Public 2007 11°34.617’ 10°56.555’
5 DorawaDadi HP Darin Health Post Public 2009 11°33.062’ 10°59.324’
6 Fadawa HP Darin Health Post Public 2008 11°34.497’ 11°00.397
7 Challino PHC Degubi Primary Health Care Public 1997 11°38.538’ 10°56.905’
8 Gabur HP Degubi Health Post Public 2005 11°36.809’ 10°56.800’
9 Gwasko HP Degubi Health Post Public 2013 11°38.315’ 10°57.756’
10 Mbela HP Degubi Health Post Public 2003 11°36.952’ 10°59.323’
11 Degubi PHCC Degubi Primary Health Care Center Public 2002 11°38.794’ 10°59.246’
12 Dazigau PHCC Dazigau Primary Health Care Center Public 2003 11°43.438’ 10°59.671’
13 Gudi PHC Dazigau Primary Health Clinic Public 2009 11°45.353’ 10°57.936’
14 Gabarun HP Dazigau Health Post Public 2003 11°46.622’ 10°55.751’
15 GarinShera D Dazigau Dispensary Public 2001 11°39.792’ 10°55.750’
16 Yaru HP Dazigau Health Post Public 1986 11°40.842’ 10°56.352’
17 Tudun Wada HC Tikau Health Clinic Public 2006 11°51.540’ 11°11.555’
18 Dagazurwa PHC Tikau Primary Health Clinic Public 1997 11°49.431’ 11°12.305’
19 Dagaretikau HP Tikau Health Post Public 1996 11°49.231’ 11°11.032
20 Tikau PHCC Tikau Primary Health Care Center Public 1947 11°46.249’ 11°05.160’
21 Kael HP Tikau Health Post Public 1999 11°47.679’ 11°07.560’
22 Old Nangere HC Nangere Health Clinic Public 1995 11°51.840’ 11°04.167’
23 SabonGari PHCC Nangere Primary Health Care Center Public 1999 11°50.921 11°04.492’
24 Nangere GH Nangere General Hospital Public 2007 11°51.402’ 11°04.457’
25 GarinJata HC Nangere Health Clinic Public 1997 11°8.3665’ 11°13.286’
26 BaranIya HC Watinani Health Clinic Public 2004 11°8.7927’ 10°9.6776’
27 Dugum HC Watinani Health Clinic Public 2000 11°8.3948’ 10°9.5593’
28 GarinGanbo DP Watinani Dispensary Public 1985 11°8.5249’ 10°9.0211’
29 Watinani PHCC Watinani Primary Health Care Center Public 2017 11°7.5891’ 11°01.042’
30 GarinKadai HC Kukuri Health Clinic Public 2004 11°55.463’ 10°51.846’
31 Kukuri PHCC Kukuri Primary Health Care Center Public 1959 11°8.8711’ 10°8.5293’
32 Kukuri PHC Kukuri Primary Health Clinic Public 2011 11°8.8778’ 10°8.5606’
33 Haram DP Kukuri Dispensary Public 2011 11°54.351’ 10°55.647’
34 Chukuriwa PHCC Chukuriwa Primary Health Care Center Public 1999 11°56.989’ 10°52.763’
35 Dadiso HP Chukuriwa Health Post Public 2012 11°56.376’ 10°50.490’
36 Gada HP Chukuriwa Health Post Public 2000 12°08.693’ 10°9.3291’
37 Bagaldi DP Dawasa Dispensary Public 2002 11°8.8395’ 10°9.45261’
38 Dawasa PHCC Dawasa Primary Health Care Center Public 2004 11°7.084’ 11°04.748’
39 Dawasa PHC Dawasa Primary Health Clinic Public 2004 11°7.0172’ 11°04.751’
40 Garin Baba DP Dawasa Dispensary Public 1959 11°69.247’ 11°03.337’
41 Biriri HC Pakarau Health Clinic Public 1999 11°9.4627’ 11°01.665’
42 Duddaye PHCC Pakarau Primary Health Care Center Public 1999 11°8.0367’ 10°9.9579’
43 Garin Keri PHC Pakarau Primary Health Clinic Public 1974 11°8.7049’ 10°9.8586’
44 Katsira HC Pakarau Health Clinic Public 1999 11°8.1679’ 11°01.109’
45 Zinzano HC Pakarau Health Clinic Public 2000 11°8.269’ 11°02.463’
46 GarinMuzam HP Chillariye Health Post Public 1999 11°41.054’ 11°00.057’
Primary Healthcare Center=PHCC, Primary Health care=PHC, Health post=HP, Dispensary=D, Health clinic=HC
Maternity Center=MC, Primary Healthcare=PHC, General Hospital=GH
Source: Author’s field work, 2021
There are two categories of healthcare facilities in the study area i.e. primary and secondary based on the typeofservicesthey
offered; table 2.
International Journal of Trend in Scientific Research and Development (IJTSRD) @ www.ijtsrd.com eISSN: 2456-6470
@ IJTSRD | Unique Paper ID – IJTSRD42527 | Volume – 5 | Issue – 4 | May-June 2021 Page 1220
Table 2: Categories of Health Care Facilities
Category of HCF Absolute Frequency Percentage
Primary 45 98
Secondary 1 2
Total 46 100
Source: Author’s analysis, 2021
It could be seen from Table 2 that a total of 46 physical healthcare facilities are distributed across the study area. The primary
health care (PHC) facilities which are mostly provided by the stateorlocal governmentconstitutesthehighestpercentage98%
(45), while the secondary healthcare (SHC) constitutes2%(1),thissignifiedthatprimaryhealthcarefacilitiesarepredominant
in the study area, and this could be attributed to being the first point of contact to obtain health care services. Thus, the
available SHC facilities in the area are mostly provided by the general hospital and this constitutes2%,thisindicates thatthere
is no adequate intervention by the private health care providers. The study area had primary and secondary health care
facilities without any tertiary health care facility and also withouta single privatehospital orclinicacrosstheentire 11political
zones of Nangere LGA. This is similar to the findings of Mohammed et al., (2015) which identified only primary and secondary
health care facilities in Giwa LGA of Kaduna State. The tertiaryhealthcarefacilitiesconsistofhighlyspecializedservices,suchas
orthopedic, eye, psychiatric, and pediatric cases among others. These services are provided byteachinghospitals(TH),federal
medical centers (FMC) and at specialist hospitals, appropriate supportservicesareincorporatedintothedevelopmentofthese
tertiary facilities to provide effective referral services.
Table 3 show the distribution of healthcare facilities in Nangere local government area,thedistributionindicatesthatDazigau,
Degubi, Darin, Pakarau, and Tikau have five (5) healthcare facilities, Dawasa/Garin Baba, Kukuri, Nangere and Watinani have
four (4) healthcare facilities, while Dadiso has three (3) healthcare facilities and Chilariyehavetwo(2)healthcarefacilities.It’s
clear from the distribution that Dazigau, Degubi, Darin, Pakarau, and Tikau have the highest number of healthcare facilities
while Chilariye has the least number of healthcare facilities, this shows that health care facilities are not evenly distributed in
Nangere LGA. This agrees with the findings of Abbas et al., (2012) which revealed that there was inequality in the distribution
of Health Care facilities in Chikun LGA of Kaduna State, the public health centers were found to be clustered along the Eastern
part of Chikun LGA in Kamazou, Kujama, Kakau, Sabon Gaya districtswhile6(33.4%) ofthepublichealthcenters werefoundat
the southern part of the study area in Chikun and Gwagwada districts and none existed at the northwestern part of the study
area. A similarity can be drawn with a study conducted by Mohammed et al., (2015) that revealed inconsistency in the
distribution of health faculties in Giwa LGA of Kaduna state.
The table further revealed that out of the 46 healthcare facilities in the study area only 1 is general hospital (GH) which is the
major healthcare facility in the local government (LG) mostly provide intensive care, critical care and long-term care, whichis
in line with the minimum requirement for LGA in Nigeria, to serve as a referral center for primary health facilities in the LGA,
14 were health posts (HP) which provide mostly preventive services with little or no clinical care; 10healthclinics(HC)which
were to be peripheral health facility; 5 dispensaries (D)whichfocusedondispensesmedications,3were maternity center(MC)
mainly proved maternity services, 2 primary healthcare (PHC) which were intermediate health facility and 11 primary
healthcare centre’s (PHCC) serving as the referral for the health clinics and primary health centre’s respectively, this indicate
that majority of the healthcare facilities in the study area are health posts with only one secondary healthcare facilities.
Table 3: Distribution of Health Care Facilities
Ward HCF GH PHCC MC HP D HC PHC
Chilariye 2 0 1 0 1 0 0 0
Dadi/Chikuriwa 3 0 1 0 2 0 0 0
Dawasa/Garin Baba 4 0 1 1 0 2 0 0
Dazigau 5 0 1 0 2 1 1 0
Degubi 5 0 1 0 3 0 0 1
Kukuri/Chiromari 4 0 1 1 0 1 1 0
Darin/Langawa 5 0 1 0 4 0 0 0
Nangere 4 1 1 0 0 0 2 0
Pakarau 5 0 1 1 0 0 3 0
Tikau 5 0 1 0 2 0 1 1
Watinani 4 0 1 0 0 1 2 0
Total 46 1 11 3 14 5 10 2
HCF= Health Care Facility, GH= General Hospital, PHCC= Primary Health Clinic, MC= Maternity Center,
HP= Health Post, D= Dispensary, HC= Health Clinic, PHC= Primary Health Care.
Source: Author’s analysis, 2021
However, Figure 1 shows the visual distributionofHCFsinNangereLGA.ThePrimaryhealthcarecentersareevenlydistributed
across the study area but other healthcare facilities are unevenly distributed, this might beattributedtothedenser population
of those areas and other location factors. This goes in line with (Wang, 2011) that said series of location factors may be
responsible for the distribution of Health Care facilities in an area, the factors may include population size, easy access to the
facility from other nearby settlements, availability of approachable roads, mode of transport orimpedimentlikewater bodies,
forest, and rugged terrain, etc. This agrees with the findings of Abbas et al., (2012) which revealed that there was inequalityin
the distribution of health care facilities in Chikun LGA of Kaduna State, the public health centers were found to be clustered
along the Eastern part of Chikun LGA in Kamazou, Kujama, Kakau, Sabon Gaya districts while 6 (33.4%)of the public health
International Journal of Trend in Scientific Research and Development (IJTSRD) @ www.ijtsrd.com eISSN: 2456-6470
@ IJTSRD | Unique Paper ID – IJTSRD42527 | Volume – 5 | Issue – 4 | May-June 2021 Page 1221
centers were found at the southern part of the study area in Chikun and Gwagwalada districts and none existed at the
northwestern part of the study area. A similarity can be drawn with a study conducted by Mohammed et al., (2015) that
revealed inconsistency in the distribution of health facilities in Giwa LGA of Kaduna state.
Figure 1: Spatial Distribution of Health Care Facilities
Source: Author’s Analysis, 2021
The distribution pattern of health care facilities in the study area was determined by the average nearest neighbor in the
ArcGIS 10.8 software interface. The average nearest neighbor analysis calculates the nearest neighbor index, which is a
measure of the distance between each facility centroids and its nearest neighbor’s centroid location. These parameters were
used as the basis for determining whether the distribution is random, dispersed, or clustered. The spatial patternof thehealth
care facilities in the study area is shown in Figure 2 while the average nearest neighbor statistics is shown in Table 4.
Table 4: Summary of Average Nearest Neighbor Statistics
Average Nearest Neighbor Summary
Observed Mean Distance: 3301.1390 Meters
Expected Mean Distance: 3032.8676 Meters
Nearest Neighbor Ratio: 1.088455
z-score: 1.135162
p-value: 0.256307
Source: Author’s Analysis, 2021
The result presented in Figure 2 shows the average nearest neighbor summary for the study area; the significant level andthe
critical level which indicates a random distribution pattern of healthcarefacilitiesinthearea.Furthermore,Table4 showsthat
the nearest neighbor ratio for the spatial pattern of health care facilities in thearea is1.088455witha critical value(z-score)of
1.135162 at 0.256307 level of significance (p-value), according to Getis&Ord (1998), the z-score usually returns a range of
International Journal of Trend in Scientific Research and Development (IJTSRD) @ www.ijtsrd.com eISSN: 2456-6470
@ IJTSRD | Unique Paper ID – IJTSRD42527 | Volume – 5 | Issue – 4 | May-June 2021 Page 1222
values between -2.58 to 2.58; therefore, a positive z-score less than 2.58 indicates a significant clustering at 0.01 probability
level. A range of scores between both 2.58 to -1.96 at 0.05 significant levels and -1.96 to -1.65 at 0.10 probability level shows
that there is a tendency towards a clustered pattern. A range of z-scores between -1.65to1.65indicatesa randomdistribution.
Again, if the z-score lies between both 1.65 to 1.95 at 0.10 significance level and 1.96 to 2.58 at 0.05 significance level then it is
obvious that there is a tendency towards a regular pattern. Therefore,sincethez-scoreisapproximately1.14whichislessthan
the standard critical value of 2.58 as measured by (Getis&Ord, 1998), then the pattern is significantly even which greaterthan
1% (0.01 level of significance), this affirms that the location pattern of Health Care Facilities in the study area is statistically
random.
Figure 2: Pattern of Health Care Distribution
Source: Author’s Analysis, 2021.
On the contrary, the result further differs with many research findings, including among the other, the work ofKibon&Ahmed
(2012) who discovered that pattern of health care facilities in the Kano metropolis, Kano State of Nigeria was clustered and
haphazardly distributed. Likewise, Musa &Abdulhamed (2012) findings revealed that the health care facilitiesinJigawa State,
Nigeria were unevenly distributed. Also, Umar (2016) in his study of the spatial distributionofhealthcarefacilitiesintheKano
South senatorial zone revealed that the location pattern of primary health care facilities in the area wasdispersedasshownby
the Average Nearest Neighbor analysis.
CONCLUSIONS
In conclusion, this study was able toidentifyandmappedthe
health care facilities across the entire 11 geo-political wards
of Nangere Local Governmentarea ofYobestate;thefindings
revealed the total number of health care facilities across the
11 geo-political wards of NangereLocal Government area
and the distribution suggests that health care facilities are
not evenly distributed in the area. The study identified 46
physical healthcare facilities distributed across space,
categories into two, namely, primary health care (PHC)
facilities which are mostly provided by the state or local
government constitutes the highest percentage 98% (45)
while the secondary healthcare (SHC) constitutes 2% (1),
this signified that primary health care facilities are
predominant in the study area. Further, disaggregating the
PHC, 14 were health posts; 9 health clinics; 5 dispensaries, 6
primary health care and 11 primary healthcare centers
(PHCC).
Health Care Facilities in the study area are statistically
random, the study area is fairly provided with primary
health care facilities. However, it was unevenly distributed
given the concentration of health care facilities in Dazigau,
Degubi, Darin, Pakarau, and Tikau while other wards were
inadequately served. Thus, this disparity in the distribution
of health facilities has generated differentaccessibilitylevels
to health care facilities in the LGA. The study concluded that
there were inequalities in the spatial distribution of
healthcare facilities in the Nangere Local Government Area
of Yobe state, thus this disparity in the distribution of health
facilities has generated differentaccessibilitylevelstohealth
care facilities in the LGA. In light of the problems associated
with inequalities in the spatial distribution revealed in this
study; it, therefore, recommendsthat;GovernmentandNon-
governmental organizations should provide health care
facilities in the wards that do not have enough health care
facilities. This will further improve access to Health Care
facilities in the study area.
International Journal of Trend in Scientific Research and Development (IJTSRD) @ www.ijtsrd.com eISSN: 2456-6470
@ IJTSRD | Unique Paper ID – IJTSRD42527 | Volume – 5 | Issue – 4 | May-June 2021 Page 1223
REFERENCES
[1] Abbas, I. I., Auta, S. Z., & Muhammad, R.(2012).Health
Care Facilities Mapping and Database Creation Using
GIS in Chikun Local Government, Kaduna State,
Nigeria. Global Journal of Human, Social Science.
Geography & Environmental GeoSciences, 12(10).
[2] Burrough, P. (2001). Principles of Geographic
Information Systems Spatial Information Systems and
Geo-informatics. Oxford University Press.
[3] Cromley, E. K., & McLafferty, S. (2002). GIS and public
health. Guilford Press.
[4] Getis, A., & Ord, J. K. (1998). Spatial analysis: Modeling
in a GIS environment. In P. Longley, & M . Batty (Eds.),
Local spatial statistics. John Wiley & Sons.
[5] Ghosh, D. (2001). Participatory Mapping as a
Component of Operational Malaria Vector Control in
Tanzania.In Geospatial Analysis of Environmental
Health. Geotechnologies and the Environment, 4(1).
https://doi.org/DOI 10.1007/978-94-007-0329-2_7
[6] Glass, G., Schwartz, B., Morgan, J., Johnson, D., Noy, P.,
& Israel, E. (1995). Environmental risk factors for
Lyme disease identified with GIS.AmericanJOurnalof
Public Health, 85(7), 944–948.
[7] INEC. (2019). Polling unit locator tool. Independent
National Electoral Commission.
[8] Kibon, U. A., & Ahmed, M. (2012). Distribution of
primary health care facilities in Kano metropolis
using GIS (Geographic Information System).Research
Journal of Environmental and Earth Science, 5(4).
https://doi.org/https://doi.org./10.19026/rjees.5.57
10
[9] Lovett, A., Parfitt, J., & Brainard, J. (2006). UsingGISin
risk analysis: a case study of hazardous waste
transport. Risk Anal, 17(5), 625–633.
[10] McMaster, R. (1988). Modeling community
vulnerabilitytohazardousmaterialsusinggeographic
information systems. Proceedings, ThirdInternational
Symposium on Spatial Data Handling, 143–156.
[11] Mohammed, I., Musa, I. J., Salisu, A., Kim, I., Oyalem, A.
M., & Maiwada, A. (2015). Analysis of accessibility to
health care facilities in Giwa and Tofa Local
Government areas of Nigeria: GISapproach.Journalof
Scientific Research and Reports, 3(22), 2900–2915.
[12] Musa, I. J., & Abdulhamed, I. (2012). The Accessibility
problems of primary Health Care to rural people in
Jigawa state, Nigeria. Global AdvanceResearchJournal
of Social Science, 1(4), 72-76.
https://doi.org/http://garj.org/garjss/index.htm
[13] Natinal Population Commission. (2021). National
housing Demarcation Survey. NPC.
[14] Openshaw, S., Charlton, M., & Craft, A. (1988).
Searching for leukemia clusters using a geographical
analysis machine. A Paper Presentedatthe11thWorld
Conference of the Society for International
Development, 64:95–106.
[15] Wang, L. (2011). Analyzing spatial accessibility to
health care: a case study of access by different
immigrant groups to primary care physicians in
Toronto. Annals of GIS, 17(4), 237–251.
https://doi.org/https://doi.org/10.1080/19475683.
2011.625975
[16] Wartenberg, D. (1992). Screening for lead exposure
using geographic informaiton system. EnvironMental
Resources, 59(1), 310–317.
[17] Wartenberg, D., Greenberg, M., & Lathrop, R. (1993).
Identification and characterization of populations
living near high-voltage transmission lines.
Environmental Health Perspect, 101(7), 626–631.
[18] WHO. (1997). Geographic Information Systems and
Public Health Mapping. World Health Organization.
[1]

More Related Content

What's hot

Gis application to the projects
Gis application to the projectsGis application to the projects
Gis application to the projectsmuisyoj
 
Remote sensing and gis for monitoring vector borne diseases
Remote sensing and gis for monitoring vector borne diseasesRemote sensing and gis for monitoring vector borne diseases
Remote sensing and gis for monitoring vector borne diseasesSakthivel R
 
The Evolving Role of GIS in Hospital and Healthcare Emergency Management
The Evolving Role of GIS in Hospital and Healthcare Emergency Management The Evolving Role of GIS in Hospital and Healthcare Emergency Management
The Evolving Role of GIS in Hospital and Healthcare Emergency Management urisahealth
 
Role of GIS in Health Care Management by Dr. Dipti Mukherji
Role of GIS in Health Care Management by Dr. Dipti MukherjiRole of GIS in Health Care Management by Dr. Dipti Mukherji
Role of GIS in Health Care Management by Dr. Dipti MukherjiPriyanka_vshukla
 
Health surveillance hi ep hds
Health surveillance hi ep hdsHealth surveillance hi ep hds
Health surveillance hi ep hdsNithin Ram
 
EHR- 2016 Eeshika Mitra
EHR- 2016 Eeshika MitraEHR- 2016 Eeshika Mitra
EHR- 2016 Eeshika MitraEeshika Mitra
 
Open source health gis presentation final
Open source health gis  presentation finalOpen source health gis  presentation final
Open source health gis presentation finalJISC GECO
 
INTEGRATION OF REMOTE SENSING DATA WITH GEOGRAPHIC INFORMATION SYSTEM (GIS): ...
INTEGRATION OF REMOTE SENSING DATA WITH GEOGRAPHIC INFORMATION SYSTEM (GIS): ...INTEGRATION OF REMOTE SENSING DATA WITH GEOGRAPHIC INFORMATION SYSTEM (GIS): ...
INTEGRATION OF REMOTE SENSING DATA WITH GEOGRAPHIC INFORMATION SYSTEM (GIS): ...ijmpict
 
Caulfield_Thesis_Poster_Final
Caulfield_Thesis_Poster_FinalCaulfield_Thesis_Poster_Final
Caulfield_Thesis_Poster_FinalKatie Caulfield
 
Geoinformatics For Precision Agriculture
Geoinformatics For Precision AgricultureGeoinformatics For Precision Agriculture
Geoinformatics For Precision AgricultureRahul Gadakh
 
An Update of Lot Quality Assurance Sampling (LQAS) Technologies Handout 1
An Update of Lot Quality Assurance Sampling (LQAS) Technologies Handout 1An Update of Lot Quality Assurance Sampling (LQAS) Technologies Handout 1
An Update of Lot Quality Assurance Sampling (LQAS) Technologies Handout 1CORE Group
 
GIS applications in Emergency / Disaster Management
GIS applications in Emergency / Disaster ManagementGIS applications in Emergency / Disaster Management
GIS applications in Emergency / Disaster ManagementPhongsakorn Uar-amrungkoon
 
Alex zscheile project
Alex zscheile projectAlex zscheile project
Alex zscheile projectajzscheile
 
Intern report final
Intern report finalIntern report final
Intern report finalFazlul wahid
 

What's hot (20)

Gis application to the projects
Gis application to the projectsGis application to the projects
Gis application to the projects
 
Remote sensing and gis for monitoring vector borne diseases
Remote sensing and gis for monitoring vector borne diseasesRemote sensing and gis for monitoring vector borne diseases
Remote sensing and gis for monitoring vector borne diseases
 
The Evolving Role of GIS in Hospital and Healthcare Emergency Management
The Evolving Role of GIS in Hospital and Healthcare Emergency Management The Evolving Role of GIS in Hospital and Healthcare Emergency Management
The Evolving Role of GIS in Hospital and Healthcare Emergency Management
 
Role of GIS in Health Care Management by Dr. Dipti Mukherji
Role of GIS in Health Care Management by Dr. Dipti MukherjiRole of GIS in Health Care Management by Dr. Dipti Mukherji
Role of GIS in Health Care Management by Dr. Dipti Mukherji
 
Health surveillance hi ep hds
Health surveillance hi ep hdsHealth surveillance hi ep hds
Health surveillance hi ep hds
 
EHR- 2016 Eeshika Mitra
EHR- 2016 Eeshika MitraEHR- 2016 Eeshika Mitra
EHR- 2016 Eeshika Mitra
 
Open source health gis presentation final
Open source health gis  presentation finalOpen source health gis  presentation final
Open source health gis presentation final
 
INTEGRATION OF REMOTE SENSING DATA WITH GEOGRAPHIC INFORMATION SYSTEM (GIS): ...
INTEGRATION OF REMOTE SENSING DATA WITH GEOGRAPHIC INFORMATION SYSTEM (GIS): ...INTEGRATION OF REMOTE SENSING DATA WITH GEOGRAPHIC INFORMATION SYSTEM (GIS): ...
INTEGRATION OF REMOTE SENSING DATA WITH GEOGRAPHIC INFORMATION SYSTEM (GIS): ...
 
Gis dr rahul
Gis dr rahulGis dr rahul
Gis dr rahul
 
Lay reporting
Lay reportingLay reporting
Lay reporting
 
Verbal autopsy (va)
Verbal autopsy (va)Verbal autopsy (va)
Verbal autopsy (va)
 
Caulfield_Thesis_Poster_Final
Caulfield_Thesis_Poster_FinalCaulfield_Thesis_Poster_Final
Caulfield_Thesis_Poster_Final
 
Geoinformatics For Precision Agriculture
Geoinformatics For Precision AgricultureGeoinformatics For Precision Agriculture
Geoinformatics For Precision Agriculture
 
Social autopsy
Social autopsySocial autopsy
Social autopsy
 
An Update of Lot Quality Assurance Sampling (LQAS) Technologies Handout 1
An Update of Lot Quality Assurance Sampling (LQAS) Technologies Handout 1An Update of Lot Quality Assurance Sampling (LQAS) Technologies Handout 1
An Update of Lot Quality Assurance Sampling (LQAS) Technologies Handout 1
 
Verbal autopsy
Verbal autopsyVerbal autopsy
Verbal autopsy
 
GIS applications in Emergency / Disaster Management
GIS applications in Emergency / Disaster ManagementGIS applications in Emergency / Disaster Management
GIS applications in Emergency / Disaster Management
 
Alex zscheile project
Alex zscheile projectAlex zscheile project
Alex zscheile project
 
Intern report final
Intern report finalIntern report final
Intern report final
 
4 2-13-397
4 2-13-3974 2-13-397
4 2-13-397
 

Similar to Geospatial Mapping of Health Facilities in Nangere Local Government Area of Yobe State, Nigeria

An Empirical Study of the Geospatial Availability of Hospitals in Imo East us...
An Empirical Study of the Geospatial Availability of Hospitals in Imo East us...An Empirical Study of the Geospatial Availability of Hospitals in Imo East us...
An Empirical Study of the Geospatial Availability of Hospitals in Imo East us...ijtsrd
 
Geospatial Mapping and Analysis of the Distribution of Public Primary Healthc...
Geospatial Mapping and Analysis of the Distribution of Public Primary Healthc...Geospatial Mapping and Analysis of the Distribution of Public Primary Healthc...
Geospatial Mapping and Analysis of the Distribution of Public Primary Healthc...ijtsrd
 
5.benchmarking the
5.benchmarking the5.benchmarking the
5.benchmarking thelibfsb
 
Accessibility of PHC in Egor LGA (Final Year Research)
Accessibility of PHC in Egor LGA (Final Year Research)Accessibility of PHC in Egor LGA (Final Year Research)
Accessibility of PHC in Egor LGA (Final Year Research)Joel Obuge
 
GPS & ArcGIS for mapping of communicable diseases-1.pptx
GPS & ArcGIS for mapping of communicable diseases-1.pptxGPS & ArcGIS for mapping of communicable diseases-1.pptx
GPS & ArcGIS for mapping of communicable diseases-1.pptxMubarraAzam
 
Building Capacity for Geospatial Analysis and Data Demand and Use to Improve ...
Building Capacity for Geospatial Analysis and Data Demand and Use to Improve ...Building Capacity for Geospatial Analysis and Data Demand and Use to Improve ...
Building Capacity for Geospatial Analysis and Data Demand and Use to Improve ...MEASURE Evaluation
 
GIS in Africa 2
GIS in Africa 2GIS in Africa 2
GIS in Africa 2Esri
 
Data Visualisation and Interactive Mapping to Support Response to Disease Out...
Data Visualisation and Interactive Mapping to Support Response to Disease Out...Data Visualisation and Interactive Mapping to Support Response to Disease Out...
Data Visualisation and Interactive Mapping to Support Response to Disease Out...UN Global Pulse
 
Spatiotemporal Analysis of Infant and Maternal Morality of Mother and Child T...
Spatiotemporal Analysis of Infant and Maternal Morality of Mother and Child T...Spatiotemporal Analysis of Infant and Maternal Morality of Mother and Child T...
Spatiotemporal Analysis of Infant and Maternal Morality of Mother and Child T...IJMTST Journal
 
Dr. Victor Assi updated.doc
Dr. Victor Assi updated.docDr. Victor Assi updated.doc
Dr. Victor Assi updated.docVictor Eyo Assi
 
Application of computers in Epidemiology.pptx
Application of computers in Epidemiology.pptxApplication of computers in Epidemiology.pptx
Application of computers in Epidemiology.pptxiqbal606601
 
ABSTRACT Public Health GIS- DST NATIONAL PROJECT
ABSTRACT Public Health GIS- DST NATIONAL PROJECTABSTRACT Public Health GIS- DST NATIONAL PROJECT
ABSTRACT Public Health GIS- DST NATIONAL PROJECTIyyanki V Muralikrishna
 
Practice and Challenges of Villagization, In the Case of Selected Woreda of A...
Practice and Challenges of Villagization, In the Case of Selected Woreda of A...Practice and Challenges of Villagization, In the Case of Selected Woreda of A...
Practice and Challenges of Villagization, In the Case of Selected Woreda of A...Premier Publishers
 
AIDSTAR-One District Comprehensive Approach for HIV Prevention and Continuum ...
AIDSTAR-One District Comprehensive Approach for HIV Prevention and Continuum ...AIDSTAR-One District Comprehensive Approach for HIV Prevention and Continuum ...
AIDSTAR-One District Comprehensive Approach for HIV Prevention and Continuum ...AIDSTAROne
 
The Role of Information Communication Technology & Geoinformatics in Vector C...
The Role of Information Communication Technology & Geoinformatics in Vector C...The Role of Information Communication Technology & Geoinformatics in Vector C...
The Role of Information Communication Technology & Geoinformatics in Vector C...ANUMBA JOSEPH UCHE
 
Use of Digital Technologies in Public Health Responses to Tackle Covid-19: th...
Use of Digital Technologies in Public Health Responses to Tackle Covid-19: th...Use of Digital Technologies in Public Health Responses to Tackle Covid-19: th...
Use of Digital Technologies in Public Health Responses to Tackle Covid-19: th...hiij
 
USE OF DIGITAL TECHNOLOGIES IN PUBLIC HEALTH RESPONSES TO TACKLE COVID-19: TH...
USE OF DIGITAL TECHNOLOGIES IN PUBLIC HEALTH RESPONSES TO TACKLE COVID-19: TH...USE OF DIGITAL TECHNOLOGIES IN PUBLIC HEALTH RESPONSES TO TACKLE COVID-19: TH...
USE OF DIGITAL TECHNOLOGIES IN PUBLIC HEALTH RESPONSES TO TACKLE COVID-19: TH...hiij
 
Health Informatics - An International Journal (HIIJ)
Health Informatics - An International Journal (HIIJ)Health Informatics - An International Journal (HIIJ)
Health Informatics - An International Journal (HIIJ)hiij
 

Similar to Geospatial Mapping of Health Facilities in Nangere Local Government Area of Yobe State, Nigeria (20)

An Empirical Study of the Geospatial Availability of Hospitals in Imo East us...
An Empirical Study of the Geospatial Availability of Hospitals in Imo East us...An Empirical Study of the Geospatial Availability of Hospitals in Imo East us...
An Empirical Study of the Geospatial Availability of Hospitals in Imo East us...
 
Geospatial Mapping and Analysis of the Distribution of Public Primary Healthc...
Geospatial Mapping and Analysis of the Distribution of Public Primary Healthc...Geospatial Mapping and Analysis of the Distribution of Public Primary Healthc...
Geospatial Mapping and Analysis of the Distribution of Public Primary Healthc...
 
5.benchmarking the
5.benchmarking the5.benchmarking the
5.benchmarking the
 
Accessibility of PHC in Egor LGA (Final Year Research)
Accessibility of PHC in Egor LGA (Final Year Research)Accessibility of PHC in Egor LGA (Final Year Research)
Accessibility of PHC in Egor LGA (Final Year Research)
 
GPS & ArcGIS for mapping of communicable diseases-1.pptx
GPS & ArcGIS for mapping of communicable diseases-1.pptxGPS & ArcGIS for mapping of communicable diseases-1.pptx
GPS & ArcGIS for mapping of communicable diseases-1.pptx
 
Building Capacity for Geospatial Analysis and Data Demand and Use to Improve ...
Building Capacity for Geospatial Analysis and Data Demand and Use to Improve ...Building Capacity for Geospatial Analysis and Data Demand and Use to Improve ...
Building Capacity for Geospatial Analysis and Data Demand and Use to Improve ...
 
GIS in Africa 2
GIS in Africa 2GIS in Africa 2
GIS in Africa 2
 
Data Visualisation and Interactive Mapping to Support Response to Disease Out...
Data Visualisation and Interactive Mapping to Support Response to Disease Out...Data Visualisation and Interactive Mapping to Support Response to Disease Out...
Data Visualisation and Interactive Mapping to Support Response to Disease Out...
 
Spatiotemporal Analysis of Infant and Maternal Morality of Mother and Child T...
Spatiotemporal Analysis of Infant and Maternal Morality of Mother and Child T...Spatiotemporal Analysis of Infant and Maternal Morality of Mother and Child T...
Spatiotemporal Analysis of Infant and Maternal Morality of Mother and Child T...
 
Dr. Victor Assi updated.doc
Dr. Victor Assi updated.docDr. Victor Assi updated.doc
Dr. Victor Assi updated.doc
 
Application of computers in Epidemiology.pptx
Application of computers in Epidemiology.pptxApplication of computers in Epidemiology.pptx
Application of computers in Epidemiology.pptx
 
F026044051
F026044051F026044051
F026044051
 
ABSTRACT Public Health GIS- DST NATIONAL PROJECT
ABSTRACT Public Health GIS- DST NATIONAL PROJECTABSTRACT Public Health GIS- DST NATIONAL PROJECT
ABSTRACT Public Health GIS- DST NATIONAL PROJECT
 
Practice and Challenges of Villagization, In the Case of Selected Woreda of A...
Practice and Challenges of Villagization, In the Case of Selected Woreda of A...Practice and Challenges of Villagization, In the Case of Selected Woreda of A...
Practice and Challenges of Villagization, In the Case of Selected Woreda of A...
 
AIDSTAR-One District Comprehensive Approach for HIV Prevention and Continuum ...
AIDSTAR-One District Comprehensive Approach for HIV Prevention and Continuum ...AIDSTAR-One District Comprehensive Approach for HIV Prevention and Continuum ...
AIDSTAR-One District Comprehensive Approach for HIV Prevention and Continuum ...
 
Modeling Hospital Admission Counts at the State Specialist Hospital Maiduguri...
Modeling Hospital Admission Counts at the State Specialist Hospital Maiduguri...Modeling Hospital Admission Counts at the State Specialist Hospital Maiduguri...
Modeling Hospital Admission Counts at the State Specialist Hospital Maiduguri...
 
The Role of Information Communication Technology & Geoinformatics in Vector C...
The Role of Information Communication Technology & Geoinformatics in Vector C...The Role of Information Communication Technology & Geoinformatics in Vector C...
The Role of Information Communication Technology & Geoinformatics in Vector C...
 
Use of Digital Technologies in Public Health Responses to Tackle Covid-19: th...
Use of Digital Technologies in Public Health Responses to Tackle Covid-19: th...Use of Digital Technologies in Public Health Responses to Tackle Covid-19: th...
Use of Digital Technologies in Public Health Responses to Tackle Covid-19: th...
 
USE OF DIGITAL TECHNOLOGIES IN PUBLIC HEALTH RESPONSES TO TACKLE COVID-19: TH...
USE OF DIGITAL TECHNOLOGIES IN PUBLIC HEALTH RESPONSES TO TACKLE COVID-19: TH...USE OF DIGITAL TECHNOLOGIES IN PUBLIC HEALTH RESPONSES TO TACKLE COVID-19: TH...
USE OF DIGITAL TECHNOLOGIES IN PUBLIC HEALTH RESPONSES TO TACKLE COVID-19: TH...
 
Health Informatics - An International Journal (HIIJ)
Health Informatics - An International Journal (HIIJ)Health Informatics - An International Journal (HIIJ)
Health Informatics - An International Journal (HIIJ)
 

More from ijtsrd

‘Six Sigma Technique’ A Journey Through its Implementation
‘Six Sigma Technique’ A Journey Through its Implementation‘Six Sigma Technique’ A Journey Through its Implementation
‘Six Sigma Technique’ A Journey Through its Implementationijtsrd
 
Edge Computing in Space Enhancing Data Processing and Communication for Space...
Edge Computing in Space Enhancing Data Processing and Communication for Space...Edge Computing in Space Enhancing Data Processing and Communication for Space...
Edge Computing in Space Enhancing Data Processing and Communication for Space...ijtsrd
 
Dynamics of Communal Politics in 21st Century India Challenges and Prospects
Dynamics of Communal Politics in 21st Century India Challenges and ProspectsDynamics of Communal Politics in 21st Century India Challenges and Prospects
Dynamics of Communal Politics in 21st Century India Challenges and Prospectsijtsrd
 
Assess Perspective and Knowledge of Healthcare Providers Towards Elehealth in...
Assess Perspective and Knowledge of Healthcare Providers Towards Elehealth in...Assess Perspective and Knowledge of Healthcare Providers Towards Elehealth in...
Assess Perspective and Knowledge of Healthcare Providers Towards Elehealth in...ijtsrd
 
The Impact of Digital Media on the Decentralization of Power and the Erosion ...
The Impact of Digital Media on the Decentralization of Power and the Erosion ...The Impact of Digital Media on the Decentralization of Power and the Erosion ...
The Impact of Digital Media on the Decentralization of Power and the Erosion ...ijtsrd
 
Online Voices, Offline Impact Ambedkars Ideals and Socio Political Inclusion ...
Online Voices, Offline Impact Ambedkars Ideals and Socio Political Inclusion ...Online Voices, Offline Impact Ambedkars Ideals and Socio Political Inclusion ...
Online Voices, Offline Impact Ambedkars Ideals and Socio Political Inclusion ...ijtsrd
 
Problems and Challenges of Agro Entreprenurship A Study
Problems and Challenges of Agro Entreprenurship A StudyProblems and Challenges of Agro Entreprenurship A Study
Problems and Challenges of Agro Entreprenurship A Studyijtsrd
 
Comparative Analysis of Total Corporate Disclosure of Selected IT Companies o...
Comparative Analysis of Total Corporate Disclosure of Selected IT Companies o...Comparative Analysis of Total Corporate Disclosure of Selected IT Companies o...
Comparative Analysis of Total Corporate Disclosure of Selected IT Companies o...ijtsrd
 
The Impact of Educational Background and Professional Training on Human Right...
The Impact of Educational Background and Professional Training on Human Right...The Impact of Educational Background and Professional Training on Human Right...
The Impact of Educational Background and Professional Training on Human Right...ijtsrd
 
A Study on the Effective Teaching Learning Process in English Curriculum at t...
A Study on the Effective Teaching Learning Process in English Curriculum at t...A Study on the Effective Teaching Learning Process in English Curriculum at t...
A Study on the Effective Teaching Learning Process in English Curriculum at t...ijtsrd
 
The Role of Mentoring and Its Influence on the Effectiveness of the Teaching ...
The Role of Mentoring and Its Influence on the Effectiveness of the Teaching ...The Role of Mentoring and Its Influence on the Effectiveness of the Teaching ...
The Role of Mentoring and Its Influence on the Effectiveness of the Teaching ...ijtsrd
 
Design Simulation and Hardware Construction of an Arduino Microcontroller Bas...
Design Simulation and Hardware Construction of an Arduino Microcontroller Bas...Design Simulation and Hardware Construction of an Arduino Microcontroller Bas...
Design Simulation and Hardware Construction of an Arduino Microcontroller Bas...ijtsrd
 
Sustainable Energy by Paul A. Adekunte | Matthew N. O. Sadiku | Janet O. Sadiku
Sustainable Energy by Paul A. Adekunte | Matthew N. O. Sadiku | Janet O. SadikuSustainable Energy by Paul A. Adekunte | Matthew N. O. Sadiku | Janet O. Sadiku
Sustainable Energy by Paul A. Adekunte | Matthew N. O. Sadiku | Janet O. Sadikuijtsrd
 
Concepts for Sudan Survey Act Implementations Executive Regulations and Stand...
Concepts for Sudan Survey Act Implementations Executive Regulations and Stand...Concepts for Sudan Survey Act Implementations Executive Regulations and Stand...
Concepts for Sudan Survey Act Implementations Executive Regulations and Stand...ijtsrd
 
Towards the Implementation of the Sudan Interpolated Geoid Model Khartoum Sta...
Towards the Implementation of the Sudan Interpolated Geoid Model Khartoum Sta...Towards the Implementation of the Sudan Interpolated Geoid Model Khartoum Sta...
Towards the Implementation of the Sudan Interpolated Geoid Model Khartoum Sta...ijtsrd
 
Activating Geospatial Information for Sudans Sustainable Investment Map
Activating Geospatial Information for Sudans Sustainable Investment MapActivating Geospatial Information for Sudans Sustainable Investment Map
Activating Geospatial Information for Sudans Sustainable Investment Mapijtsrd
 
Educational Unity Embracing Diversity for a Stronger Society
Educational Unity Embracing Diversity for a Stronger SocietyEducational Unity Embracing Diversity for a Stronger Society
Educational Unity Embracing Diversity for a Stronger Societyijtsrd
 
Integration of Indian Indigenous Knowledge System in Management Prospects and...
Integration of Indian Indigenous Knowledge System in Management Prospects and...Integration of Indian Indigenous Knowledge System in Management Prospects and...
Integration of Indian Indigenous Knowledge System in Management Prospects and...ijtsrd
 
DeepMask Transforming Face Mask Identification for Better Pandemic Control in...
DeepMask Transforming Face Mask Identification for Better Pandemic Control in...DeepMask Transforming Face Mask Identification for Better Pandemic Control in...
DeepMask Transforming Face Mask Identification for Better Pandemic Control in...ijtsrd
 
Streamlining Data Collection eCRF Design and Machine Learning
Streamlining Data Collection eCRF Design and Machine LearningStreamlining Data Collection eCRF Design and Machine Learning
Streamlining Data Collection eCRF Design and Machine Learningijtsrd
 

More from ijtsrd (20)

‘Six Sigma Technique’ A Journey Through its Implementation
‘Six Sigma Technique’ A Journey Through its Implementation‘Six Sigma Technique’ A Journey Through its Implementation
‘Six Sigma Technique’ A Journey Through its Implementation
 
Edge Computing in Space Enhancing Data Processing and Communication for Space...
Edge Computing in Space Enhancing Data Processing and Communication for Space...Edge Computing in Space Enhancing Data Processing and Communication for Space...
Edge Computing in Space Enhancing Data Processing and Communication for Space...
 
Dynamics of Communal Politics in 21st Century India Challenges and Prospects
Dynamics of Communal Politics in 21st Century India Challenges and ProspectsDynamics of Communal Politics in 21st Century India Challenges and Prospects
Dynamics of Communal Politics in 21st Century India Challenges and Prospects
 
Assess Perspective and Knowledge of Healthcare Providers Towards Elehealth in...
Assess Perspective and Knowledge of Healthcare Providers Towards Elehealth in...Assess Perspective and Knowledge of Healthcare Providers Towards Elehealth in...
Assess Perspective and Knowledge of Healthcare Providers Towards Elehealth in...
 
The Impact of Digital Media on the Decentralization of Power and the Erosion ...
The Impact of Digital Media on the Decentralization of Power and the Erosion ...The Impact of Digital Media on the Decentralization of Power and the Erosion ...
The Impact of Digital Media on the Decentralization of Power and the Erosion ...
 
Online Voices, Offline Impact Ambedkars Ideals and Socio Political Inclusion ...
Online Voices, Offline Impact Ambedkars Ideals and Socio Political Inclusion ...Online Voices, Offline Impact Ambedkars Ideals and Socio Political Inclusion ...
Online Voices, Offline Impact Ambedkars Ideals and Socio Political Inclusion ...
 
Problems and Challenges of Agro Entreprenurship A Study
Problems and Challenges of Agro Entreprenurship A StudyProblems and Challenges of Agro Entreprenurship A Study
Problems and Challenges of Agro Entreprenurship A Study
 
Comparative Analysis of Total Corporate Disclosure of Selected IT Companies o...
Comparative Analysis of Total Corporate Disclosure of Selected IT Companies o...Comparative Analysis of Total Corporate Disclosure of Selected IT Companies o...
Comparative Analysis of Total Corporate Disclosure of Selected IT Companies o...
 
The Impact of Educational Background and Professional Training on Human Right...
The Impact of Educational Background and Professional Training on Human Right...The Impact of Educational Background and Professional Training on Human Right...
The Impact of Educational Background and Professional Training on Human Right...
 
A Study on the Effective Teaching Learning Process in English Curriculum at t...
A Study on the Effective Teaching Learning Process in English Curriculum at t...A Study on the Effective Teaching Learning Process in English Curriculum at t...
A Study on the Effective Teaching Learning Process in English Curriculum at t...
 
The Role of Mentoring and Its Influence on the Effectiveness of the Teaching ...
The Role of Mentoring and Its Influence on the Effectiveness of the Teaching ...The Role of Mentoring and Its Influence on the Effectiveness of the Teaching ...
The Role of Mentoring and Its Influence on the Effectiveness of the Teaching ...
 
Design Simulation and Hardware Construction of an Arduino Microcontroller Bas...
Design Simulation and Hardware Construction of an Arduino Microcontroller Bas...Design Simulation and Hardware Construction of an Arduino Microcontroller Bas...
Design Simulation and Hardware Construction of an Arduino Microcontroller Bas...
 
Sustainable Energy by Paul A. Adekunte | Matthew N. O. Sadiku | Janet O. Sadiku
Sustainable Energy by Paul A. Adekunte | Matthew N. O. Sadiku | Janet O. SadikuSustainable Energy by Paul A. Adekunte | Matthew N. O. Sadiku | Janet O. Sadiku
Sustainable Energy by Paul A. Adekunte | Matthew N. O. Sadiku | Janet O. Sadiku
 
Concepts for Sudan Survey Act Implementations Executive Regulations and Stand...
Concepts for Sudan Survey Act Implementations Executive Regulations and Stand...Concepts for Sudan Survey Act Implementations Executive Regulations and Stand...
Concepts for Sudan Survey Act Implementations Executive Regulations and Stand...
 
Towards the Implementation of the Sudan Interpolated Geoid Model Khartoum Sta...
Towards the Implementation of the Sudan Interpolated Geoid Model Khartoum Sta...Towards the Implementation of the Sudan Interpolated Geoid Model Khartoum Sta...
Towards the Implementation of the Sudan Interpolated Geoid Model Khartoum Sta...
 
Activating Geospatial Information for Sudans Sustainable Investment Map
Activating Geospatial Information for Sudans Sustainable Investment MapActivating Geospatial Information for Sudans Sustainable Investment Map
Activating Geospatial Information for Sudans Sustainable Investment Map
 
Educational Unity Embracing Diversity for a Stronger Society
Educational Unity Embracing Diversity for a Stronger SocietyEducational Unity Embracing Diversity for a Stronger Society
Educational Unity Embracing Diversity for a Stronger Society
 
Integration of Indian Indigenous Knowledge System in Management Prospects and...
Integration of Indian Indigenous Knowledge System in Management Prospects and...Integration of Indian Indigenous Knowledge System in Management Prospects and...
Integration of Indian Indigenous Knowledge System in Management Prospects and...
 
DeepMask Transforming Face Mask Identification for Better Pandemic Control in...
DeepMask Transforming Face Mask Identification for Better Pandemic Control in...DeepMask Transforming Face Mask Identification for Better Pandemic Control in...
DeepMask Transforming Face Mask Identification for Better Pandemic Control in...
 
Streamlining Data Collection eCRF Design and Machine Learning
Streamlining Data Collection eCRF Design and Machine LearningStreamlining Data Collection eCRF Design and Machine Learning
Streamlining Data Collection eCRF Design and Machine Learning
 

Recently uploaded

Presentation by Andreas Schleicher Tackling the School Absenteeism Crisis 30 ...
Presentation by Andreas Schleicher Tackling the School Absenteeism Crisis 30 ...Presentation by Andreas Schleicher Tackling the School Absenteeism Crisis 30 ...
Presentation by Andreas Schleicher Tackling the School Absenteeism Crisis 30 ...EduSkills OECD
 
Interactive Powerpoint_How to Master effective communication
Interactive Powerpoint_How to Master effective communicationInteractive Powerpoint_How to Master effective communication
Interactive Powerpoint_How to Master effective communicationnomboosow
 
How to Make a Pirate ship Primary Education.pptx
How to Make a Pirate ship Primary Education.pptxHow to Make a Pirate ship Primary Education.pptx
How to Make a Pirate ship Primary Education.pptxmanuelaromero2013
 
How to Configure Email Server in Odoo 17
How to Configure Email Server in Odoo 17How to Configure Email Server in Odoo 17
How to Configure Email Server in Odoo 17Celine George
 
Call Girls in Dwarka Mor Delhi Contact Us 9654467111
Call Girls in Dwarka Mor Delhi Contact Us 9654467111Call Girls in Dwarka Mor Delhi Contact Us 9654467111
Call Girls in Dwarka Mor Delhi Contact Us 9654467111Sapana Sha
 
microwave assisted reaction. General introduction
microwave assisted reaction. General introductionmicrowave assisted reaction. General introduction
microwave assisted reaction. General introductionMaksud Ahmed
 
Paris 2024 Olympic Geographies - an activity
Paris 2024 Olympic Geographies - an activityParis 2024 Olympic Geographies - an activity
Paris 2024 Olympic Geographies - an activityGeoBlogs
 
Presiding Officer Training module 2024 lok sabha elections
Presiding Officer Training module 2024 lok sabha electionsPresiding Officer Training module 2024 lok sabha elections
Presiding Officer Training module 2024 lok sabha electionsanshu789521
 
Class 11 Legal Studies Ch-1 Concept of State .pdf
Class 11 Legal Studies Ch-1 Concept of State .pdfClass 11 Legal Studies Ch-1 Concept of State .pdf
Class 11 Legal Studies Ch-1 Concept of State .pdfakmcokerachita
 
Sanyam Choudhary Chemistry practical.pdf
Sanyam Choudhary Chemistry practical.pdfSanyam Choudhary Chemistry practical.pdf
Sanyam Choudhary Chemistry practical.pdfsanyamsingh5019
 
Hybridoma Technology ( Production , Purification , and Application )
Hybridoma Technology  ( Production , Purification , and Application  ) Hybridoma Technology  ( Production , Purification , and Application  )
Hybridoma Technology ( Production , Purification , and Application ) Sakshi Ghasle
 
Mastering the Unannounced Regulatory Inspection
Mastering the Unannounced Regulatory InspectionMastering the Unannounced Regulatory Inspection
Mastering the Unannounced Regulatory InspectionSafetyChain Software
 
Introduction to AI in Higher Education_draft.pptx
Introduction to AI in Higher Education_draft.pptxIntroduction to AI in Higher Education_draft.pptx
Introduction to AI in Higher Education_draft.pptxpboyjonauth
 
Separation of Lanthanides/ Lanthanides and Actinides
Separation of Lanthanides/ Lanthanides and ActinidesSeparation of Lanthanides/ Lanthanides and Actinides
Separation of Lanthanides/ Lanthanides and ActinidesFatimaKhan178732
 
CARE OF CHILD IN INCUBATOR..........pptx
CARE OF CHILD IN INCUBATOR..........pptxCARE OF CHILD IN INCUBATOR..........pptx
CARE OF CHILD IN INCUBATOR..........pptxGaneshChakor2
 
Alper Gobel In Media Res Media Component
Alper Gobel In Media Res Media ComponentAlper Gobel In Media Res Media Component
Alper Gobel In Media Res Media ComponentInMediaRes1
 
Accessible design: Minimum effort, maximum impact
Accessible design: Minimum effort, maximum impactAccessible design: Minimum effort, maximum impact
Accessible design: Minimum effort, maximum impactdawncurless
 
The basics of sentences session 2pptx copy.pptx
The basics of sentences session 2pptx copy.pptxThe basics of sentences session 2pptx copy.pptx
The basics of sentences session 2pptx copy.pptxheathfieldcps1
 
BASLIQ CURRENT LOOKBOOK LOOKBOOK(1) (1).pdf
BASLIQ CURRENT LOOKBOOK  LOOKBOOK(1) (1).pdfBASLIQ CURRENT LOOKBOOK  LOOKBOOK(1) (1).pdf
BASLIQ CURRENT LOOKBOOK LOOKBOOK(1) (1).pdfSoniaTolstoy
 

Recently uploaded (20)

Presentation by Andreas Schleicher Tackling the School Absenteeism Crisis 30 ...
Presentation by Andreas Schleicher Tackling the School Absenteeism Crisis 30 ...Presentation by Andreas Schleicher Tackling the School Absenteeism Crisis 30 ...
Presentation by Andreas Schleicher Tackling the School Absenteeism Crisis 30 ...
 
Interactive Powerpoint_How to Master effective communication
Interactive Powerpoint_How to Master effective communicationInteractive Powerpoint_How to Master effective communication
Interactive Powerpoint_How to Master effective communication
 
How to Make a Pirate ship Primary Education.pptx
How to Make a Pirate ship Primary Education.pptxHow to Make a Pirate ship Primary Education.pptx
How to Make a Pirate ship Primary Education.pptx
 
How to Configure Email Server in Odoo 17
How to Configure Email Server in Odoo 17How to Configure Email Server in Odoo 17
How to Configure Email Server in Odoo 17
 
Call Girls in Dwarka Mor Delhi Contact Us 9654467111
Call Girls in Dwarka Mor Delhi Contact Us 9654467111Call Girls in Dwarka Mor Delhi Contact Us 9654467111
Call Girls in Dwarka Mor Delhi Contact Us 9654467111
 
microwave assisted reaction. General introduction
microwave assisted reaction. General introductionmicrowave assisted reaction. General introduction
microwave assisted reaction. General introduction
 
Paris 2024 Olympic Geographies - an activity
Paris 2024 Olympic Geographies - an activityParis 2024 Olympic Geographies - an activity
Paris 2024 Olympic Geographies - an activity
 
Código Creativo y Arte de Software | Unidad 1
Código Creativo y Arte de Software | Unidad 1Código Creativo y Arte de Software | Unidad 1
Código Creativo y Arte de Software | Unidad 1
 
Presiding Officer Training module 2024 lok sabha elections
Presiding Officer Training module 2024 lok sabha electionsPresiding Officer Training module 2024 lok sabha elections
Presiding Officer Training module 2024 lok sabha elections
 
Class 11 Legal Studies Ch-1 Concept of State .pdf
Class 11 Legal Studies Ch-1 Concept of State .pdfClass 11 Legal Studies Ch-1 Concept of State .pdf
Class 11 Legal Studies Ch-1 Concept of State .pdf
 
Sanyam Choudhary Chemistry practical.pdf
Sanyam Choudhary Chemistry practical.pdfSanyam Choudhary Chemistry practical.pdf
Sanyam Choudhary Chemistry practical.pdf
 
Hybridoma Technology ( Production , Purification , and Application )
Hybridoma Technology  ( Production , Purification , and Application  ) Hybridoma Technology  ( Production , Purification , and Application  )
Hybridoma Technology ( Production , Purification , and Application )
 
Mastering the Unannounced Regulatory Inspection
Mastering the Unannounced Regulatory InspectionMastering the Unannounced Regulatory Inspection
Mastering the Unannounced Regulatory Inspection
 
Introduction to AI in Higher Education_draft.pptx
Introduction to AI in Higher Education_draft.pptxIntroduction to AI in Higher Education_draft.pptx
Introduction to AI in Higher Education_draft.pptx
 
Separation of Lanthanides/ Lanthanides and Actinides
Separation of Lanthanides/ Lanthanides and ActinidesSeparation of Lanthanides/ Lanthanides and Actinides
Separation of Lanthanides/ Lanthanides and Actinides
 
CARE OF CHILD IN INCUBATOR..........pptx
CARE OF CHILD IN INCUBATOR..........pptxCARE OF CHILD IN INCUBATOR..........pptx
CARE OF CHILD IN INCUBATOR..........pptx
 
Alper Gobel In Media Res Media Component
Alper Gobel In Media Res Media ComponentAlper Gobel In Media Res Media Component
Alper Gobel In Media Res Media Component
 
Accessible design: Minimum effort, maximum impact
Accessible design: Minimum effort, maximum impactAccessible design: Minimum effort, maximum impact
Accessible design: Minimum effort, maximum impact
 
The basics of sentences session 2pptx copy.pptx
The basics of sentences session 2pptx copy.pptxThe basics of sentences session 2pptx copy.pptx
The basics of sentences session 2pptx copy.pptx
 
BASLIQ CURRENT LOOKBOOK LOOKBOOK(1) (1).pdf
BASLIQ CURRENT LOOKBOOK  LOOKBOOK(1) (1).pdfBASLIQ CURRENT LOOKBOOK  LOOKBOOK(1) (1).pdf
BASLIQ CURRENT LOOKBOOK LOOKBOOK(1) (1).pdf
 

Geospatial Mapping of Health Facilities in Nangere Local Government Area of Yobe State, Nigeria

  • 1. International Journal of Trend in Scientific Research and Development (IJTSRD) Volume 5 Issue 4, May-June 2021 Available Online: www.ijtsrd.com e-ISSN: 2456 – 6470 @ IJTSRD | Unique Paper ID – IJTSRD42527 | Volume – 5 | Issue – 4 | May-June 2021 Page 1217 Geospatial Mapping of Health Facilities in Nangere Local Government Area of Yobe State, Nigeria Ibrahim Abubakar Audu1, Tijjani Bukar Lawan2 1Department of Environmental and Resource Management, Usmanu Danfodiyo University Sokoto, Sokoto State, Nigeria 2Department of Geography, Yobe State University, Damaturu, Yobe State, Nigeria ABSTRACT This paper is aimed at mapping healthcare facilities in the Nangere Local Government Area of Yobe State. Geospatial mapping of health care facilities was achieved by taking the geographic coordinates of all the healthcare facilities in the Local Government using the Global PositioningSystemGarmin GPS map 76CS receiver. The data were analyzed using ArcGIS 10.8 version software. The study identified primary and secondary health care facilities without any tertiary health care facility and also without a single private hospital or clinic across the entire eleven(11)political wardsofNangereLocal Government Area. The findings revealed that 46 healthcare facilities were distributed across the eleven (11) political wards in the Local Government Area. The primary health care facilities (PHC) constituted 98 % (45)whilethe secondary Health Care facilities (SHC) constituted 2 % (1). The average nearest neighbor summary for the study area shows the significant level and the critical level that indicates a random distribution pattern of health care facilities in the area, however, it was unevenly distributed given the concentration of health care facilities in Dazigau, Degubi, Darin, Pakarau, and Tikau while other wards were inadequately served. However, both the primary and secondary health care facilities were government-owned, the study concluded that there were inequalities in the spatial distribution of health care facilities in the Nangere Local GovernmentArea ofYobestate,thus this disparity in the distribution of health facilities has generated different accessibility level to health care facilitiesintheLGA,it,therefore, recommends that; Government and the private organization should provide health care facilities in the wards that do not have enough health care facilities. This will further improve access to Health Care facilities in the study area. KEYWORDS: GIS, Mapping, Healthcare Facilities, GPS How to cite thispaper:IbrahimAbubakar Audu | Tijjani Bukar Lawan "Geospatial Mapping of Health Facilities in Nangere Local Government Area of Yobe State, Nigeria" Publishedin International Journal of Trend in Scientific Research and Development(ijtsrd), ISSN: 2456-6470, Volume-5 | Issue-4, June 2021, pp.1217- 1223, URL: www.ijtsrd.com/papers/ijtsrd42527.pdf Copyright © 2021 by author (s) and International Journal ofTrendinScientific Research and Development Journal. This is an Open Access article distributed under the terms of the Creative Commons Attribution License (CC BY 4.0) (http: //creativecommons.org/licenses/by/4.0) INTRODUCTION Digital mapping has now become a critical method for addre ssing a wide range of environmental issues. The technique used for producing digital maps is dependent on the level of details required, the use to which the map will be put, and the sourced data. Digital mapping operations help organizations achieve important analytical and operational advantage. Location intelligence is enabling even non- Geographic Information Systems (GIS) specialiststogainthe advantage of using location to make more insightful everyday decisions. The capabilityofGIStohandledata from specific geographic locations, and the ability togather,store, manipulate, analyze and visualizegeo-referenceddata offers the opportunity to create a realistic perspective of theworld and a chance to see the future action (Burrough, 2001). This exceptional ability provides scientists, engineers,surveyors, planners, and resource managers the opportunity to distill and combine large sets ofspatial data intouseful information offering a new perspectiveandfreshapproachestoproblem- solving. The GIS is used in almost every aspect of our daily lives, from earth science and other physical sciences to finance and management. Thus, the data it uses also vary, ranging from remote sensing, Global Positioning Systems (GPS), conventional data collected byinsitu instruments and questionnaires, etc. These data that are either time series or spatial can be used to show the spatial context of numerous fields and the creation of models and forecasts of future occurrences. Geospatial analysis and environmental health began to interact with each other due to developments in computing. The utility of this is in the ability to view maps and identify areas of prevalent diseases, pest breeding grounds, spatial population distribution for health studies, doctor-to-patient ratio, and location of health facilities. For hazards ranging from soil lead to particulates in the air, to disease-carrying mosquitoes, researchers have used geospatial analysis to examine where hazards exist in the environment and to model their spatial distributions (Glass et al., 1995). Initial GIS applications in environmental health include analysis of spatial clustering of childhood leukemia concerning nuclear facilities in England (Openshaw etal.,1988),a studythatlaid the groundwork for the extensive body of research on GIS- based analysis of spatial disease clusters.Otherearlystudies include (McMaster, 1988) GIS assessment of community vulnerability to hazardous materials and (Wartenberg, IJTSRD42527
  • 2. International Journal of Trend in Scientific Research and Development (IJTSRD) @ www.ijtsrd.com eISSN: 2456-6470 @ IJTSRD | Unique Paper ID – IJTSRD42527 | Volume – 5 | Issue – 4 | May-June 2021 Page 1218 1992) and (Wartenberg et al., 1993) use of GIS to characterize populations living near high-voltage transmission lines. The geospatial analysis tool, the GIS has been usedinvector- borne disease studies to determinetheassociationsbetween environmental features and vectorconcentrations(e.g.Glass et al., 1995). From many recent studies, GIS was usedtomap out vector-borne and zoonotic diseases such as Lyme disease, viral meningitis, Hantavirus, Dengue Fever, Yellow Fever, and rabies, among others, and their spatial distribution. Ghosh (2001) used GIS to analyze the association of urban environment features that facilitated viral activities of West Nile Virus (WNV) and compared the spatial association between WNV infected mosquito pools and human cases with heterogeneous urban characteristics in Minnesota USA between 2002 and 2007. His results showed that WNV is considerably higher in areas close to swamps, parks, and water discharge sites. Optimized the accuracy of the applications of larvicides at mosquito breeding sites in Dar-es-Salam Tanzania using GIS, they employed community-based development ofsketchmapsof the target areas that are termed participatory GIS and then involved a procedure of verifying the sketched maps using laminated aerial photographs in the field that are later analyzed and digitized in a GIS system. The level of details acquired assisted the government not only in malaria monitoring but in the implementation of council programs and spatially explicit analysis for research and evaluation purposes. GIS has also been applied todepict mobile hazards associated with, for example, traffic flows and transportation of hazardous wastes (Lovett etal.,2006). Advances ingeospatial technologiesandspace-timemethods have greatly enhanced our ability to model and monitor the spatial distributions and flows of environmental hazards. Geospatial techniques have also been used toidentifyat-risk populations (maps) exposed to radioactive iodine and lead poisoning (Wartenberg, 1992). There are three important functions of Geographical InformationSystem(GIS)inhealth research and policy analysis: spatial database management, visualization and mapping, and spatial analysis (Cromley&McLafferty, 2002). WHO (1997)specifiedcriteria for health care planning for third world countries and indicated that each service area should cover a 4km2 catchment area with a population of 60,000 for primary health care to have adequate and equity of access to health centers. In line with WHO (1997), this study, therefore, aimed to map the spatial distribution of health care centers in Nangere LGA of Yobe State using GIS techniques. This aim was achieved by identifying, mapping both public and private health centers in the study area. The provision of health care centers in Nigeria is a concurrent responsibility of the three tiers of government thatincludeLocal,State, and Federal Government institutions. The Local Government is the least administrative unit, in addition to this; private investors in healthcare delivery are also visible. The Primary HealthCare (PHC) Department is one of the five departments of each of the 774 Local Government areas in the country that is charged with the duty of ensuring that healthcare services are delivered in their areas on an integrated and affordable basis. Location mapping however is critical in reaching out to the people within their respective areas of jurisdiction. The ability to locate health facilities and identify theircapabilitiesinterms of services and hours of operationhasbeenunderscored due to a lack of proper mapping facilities.Unlikeinthedeveloped world where all health facilities are of equal standard, in the developing world, it is different. Abbas et al., (2012) examined the spatial distribution of Healthcare facilities in the Chikun local government area ofKaduna StateNigeria by using GIS and GPS to map exiting ones, evaluate adequacy based on World Health Organization standard and propose new ones. However, their results neither show how queries could be made to show both spatial and attribute information from a database nor provide a visual map portraying details of health facilities. Here, we provide spatial distribution of healthcarefacilities,anda singlevisual map of the health facilities, and the inventory of existing healthcare facilities. The Study Area Nangere Local Government is located between latitudes 11°51’50’’ and 12°00’00’’ North of the Equator and between longitudes 10°50’00’’ and 11°04’11’’ East of the Meridian. The Nangere Local Government area situated in Yobe state, North-East geopolitical zone of Nigeria and has its headquarters in the town of SabonGariNangere. The local government area has an projected population of 119,694 persons spread over a geographical area of980km²(Natinal Population Commission, 2021). The study area has a total of eleven (11) electoral wards namely: Langawa, Nangere, Pakarau, Tikau,Chilariye, Chukuriwa, Dawasa, Dazigau, Degubi, and Watinani wards (INEC, 2019). It is bounded by the following local government areas; to the north by Jakusko, to the east Fune, to the west Dambam Local Government Area of Bauchi state, to the south Potiskum, to the south/east Fika. METHODOLOGY Method of Data Collection A checklist was used to acquire the attribute data of identified healthcare facilities, the data include the name of health care facility, political ward, category of healthcaree.g. dispensary, clinic, health post, etc., and other relevant information such as ownership i.e. public or private, year of establishment, was used for the creation of health care facility inventory for the study. TheGPS(Garmin76CSx) was used to obtain the geographic locations of the health facilities. Method of Data Processing The administrative map of the study area was scanned and imported into ArcGIS 10.8 version software for geo- referencing. Geo-referencing allowstheresearcherstorelate a space object or raster object that has not been tied to any geographic reference to a coordinate reference system. The geo-referenced map was digitized on-screen under the following themes: the Local Government Area and the political ward as polygon, LGA, and ward boundary as lines to portray the extent of the study area. Method of Data Analysis ArcGIS 10.8 version software was used for data analysis, the GPS coordinates were imported into ArcGIS 10.8 interface, all the shape files holding the relevant data layers were then spatially overlaid to create a combination of visual map of polygon, line, and point feature classes. Consequently, the x and y spontaneously displayed the geo-referenced location of each HCF in space, along with political wards as reflected in their attribute tables, this aid to visualize the distribution of all the types of HCFs in the study area. The Average Nearest NeighborStatistics(ANNS)inferential statistical tool
  • 3. International Journal of Trend in Scientific Research and Development (IJTSRD) @ www.ijtsrd.com eISSN: 2456-6470 @ IJTSRD | Unique Paper ID – IJTSRD42527 | Volume – 5 | Issue – 4 | May-June 2021 Page 1219 in ArcGIS10.8 was used to investigate the spatial pattern in the data. The Kernel Density tool calculates the density of features in a neighborhood around those features. This tool automatically calculates for the LGA the average nearest neighbor ratio by dividing the observed average distance by the expected average distance. RESULTS AND DISCUSSIONS The result of the data set for the identified healthcare facilities in the study area is displayed in Table 1, Table 2, and Figure 1. The Tables and Figures show both inventories, numerical and spatial distribution of the categoriesofhealth care facilities in the study area. An inventory of all existing healthcare facilitiesintheNangereLocal GovernmentArea is shown in table 1 below. The inventory displays the name of the facility, political ward, and types of facility, ownership, and year of establishment, latitude, and longitude of each health care facility in the study area. Table 1: Inventories of Existing Health Care Facilities No Name of Facility Ward Categories of HCF Ownership Year Latitude Longitude 1 GarinMuzam HP Chillariye Health Post Public 2013 11°41.054’ 11°00.057’ 2 Chillariye PHCC Chillariye Primary Health Care Center Public 2003 11°41.957’ 10°59.436’ 3 Dagare PHCC Darin Primary Health Care Center Public 2004 11°36.023’ 11°01.099’ 4 Darin HP Darin Health Post Public 2007 11°34.617’ 10°56.555’ 5 DorawaDadi HP Darin Health Post Public 2009 11°33.062’ 10°59.324’ 6 Fadawa HP Darin Health Post Public 2008 11°34.497’ 11°00.397 7 Challino PHC Degubi Primary Health Care Public 1997 11°38.538’ 10°56.905’ 8 Gabur HP Degubi Health Post Public 2005 11°36.809’ 10°56.800’ 9 Gwasko HP Degubi Health Post Public 2013 11°38.315’ 10°57.756’ 10 Mbela HP Degubi Health Post Public 2003 11°36.952’ 10°59.323’ 11 Degubi PHCC Degubi Primary Health Care Center Public 2002 11°38.794’ 10°59.246’ 12 Dazigau PHCC Dazigau Primary Health Care Center Public 2003 11°43.438’ 10°59.671’ 13 Gudi PHC Dazigau Primary Health Clinic Public 2009 11°45.353’ 10°57.936’ 14 Gabarun HP Dazigau Health Post Public 2003 11°46.622’ 10°55.751’ 15 GarinShera D Dazigau Dispensary Public 2001 11°39.792’ 10°55.750’ 16 Yaru HP Dazigau Health Post Public 1986 11°40.842’ 10°56.352’ 17 Tudun Wada HC Tikau Health Clinic Public 2006 11°51.540’ 11°11.555’ 18 Dagazurwa PHC Tikau Primary Health Clinic Public 1997 11°49.431’ 11°12.305’ 19 Dagaretikau HP Tikau Health Post Public 1996 11°49.231’ 11°11.032 20 Tikau PHCC Tikau Primary Health Care Center Public 1947 11°46.249’ 11°05.160’ 21 Kael HP Tikau Health Post Public 1999 11°47.679’ 11°07.560’ 22 Old Nangere HC Nangere Health Clinic Public 1995 11°51.840’ 11°04.167’ 23 SabonGari PHCC Nangere Primary Health Care Center Public 1999 11°50.921 11°04.492’ 24 Nangere GH Nangere General Hospital Public 2007 11°51.402’ 11°04.457’ 25 GarinJata HC Nangere Health Clinic Public 1997 11°8.3665’ 11°13.286’ 26 BaranIya HC Watinani Health Clinic Public 2004 11°8.7927’ 10°9.6776’ 27 Dugum HC Watinani Health Clinic Public 2000 11°8.3948’ 10°9.5593’ 28 GarinGanbo DP Watinani Dispensary Public 1985 11°8.5249’ 10°9.0211’ 29 Watinani PHCC Watinani Primary Health Care Center Public 2017 11°7.5891’ 11°01.042’ 30 GarinKadai HC Kukuri Health Clinic Public 2004 11°55.463’ 10°51.846’ 31 Kukuri PHCC Kukuri Primary Health Care Center Public 1959 11°8.8711’ 10°8.5293’ 32 Kukuri PHC Kukuri Primary Health Clinic Public 2011 11°8.8778’ 10°8.5606’ 33 Haram DP Kukuri Dispensary Public 2011 11°54.351’ 10°55.647’ 34 Chukuriwa PHCC Chukuriwa Primary Health Care Center Public 1999 11°56.989’ 10°52.763’ 35 Dadiso HP Chukuriwa Health Post Public 2012 11°56.376’ 10°50.490’ 36 Gada HP Chukuriwa Health Post Public 2000 12°08.693’ 10°9.3291’ 37 Bagaldi DP Dawasa Dispensary Public 2002 11°8.8395’ 10°9.45261’ 38 Dawasa PHCC Dawasa Primary Health Care Center Public 2004 11°7.084’ 11°04.748’ 39 Dawasa PHC Dawasa Primary Health Clinic Public 2004 11°7.0172’ 11°04.751’ 40 Garin Baba DP Dawasa Dispensary Public 1959 11°69.247’ 11°03.337’ 41 Biriri HC Pakarau Health Clinic Public 1999 11°9.4627’ 11°01.665’ 42 Duddaye PHCC Pakarau Primary Health Care Center Public 1999 11°8.0367’ 10°9.9579’ 43 Garin Keri PHC Pakarau Primary Health Clinic Public 1974 11°8.7049’ 10°9.8586’ 44 Katsira HC Pakarau Health Clinic Public 1999 11°8.1679’ 11°01.109’ 45 Zinzano HC Pakarau Health Clinic Public 2000 11°8.269’ 11°02.463’ 46 GarinMuzam HP Chillariye Health Post Public 1999 11°41.054’ 11°00.057’ Primary Healthcare Center=PHCC, Primary Health care=PHC, Health post=HP, Dispensary=D, Health clinic=HC Maternity Center=MC, Primary Healthcare=PHC, General Hospital=GH Source: Author’s field work, 2021 There are two categories of healthcare facilities in the study area i.e. primary and secondary based on the typeofservicesthey offered; table 2.
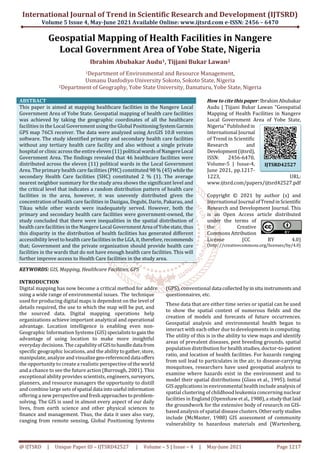
  • 4. International Journal of Trend in Scientific Research and Development (IJTSRD) @ www.ijtsrd.com eISSN: 2456-6470 @ IJTSRD | Unique Paper ID – IJTSRD42527 | Volume – 5 | Issue – 4 | May-June 2021 Page 1220 Table 2: Categories of Health Care Facilities Category of HCF Absolute Frequency Percentage Primary 45 98 Secondary 1 2 Total 46 100 Source: Author’s analysis, 2021 It could be seen from Table 2 that a total of 46 physical healthcare facilities are distributed across the study area. The primary health care (PHC) facilities which are mostly provided by the stateorlocal governmentconstitutesthehighestpercentage98% (45), while the secondary healthcare (SHC) constitutes2%(1),thissignifiedthatprimaryhealthcarefacilitiesarepredominant in the study area, and this could be attributed to being the first point of contact to obtain health care services. Thus, the available SHC facilities in the area are mostly provided by the general hospital and this constitutes2%,thisindicates thatthere is no adequate intervention by the private health care providers. The study area had primary and secondary health care facilities without any tertiary health care facility and also withouta single privatehospital orclinicacrosstheentire 11political zones of Nangere LGA. This is similar to the findings of Mohammed et al., (2015) which identified only primary and secondary health care facilities in Giwa LGA of Kaduna State. The tertiaryhealthcarefacilitiesconsistofhighlyspecializedservices,suchas orthopedic, eye, psychiatric, and pediatric cases among others. These services are provided byteachinghospitals(TH),federal medical centers (FMC) and at specialist hospitals, appropriate supportservicesareincorporatedintothedevelopmentofthese tertiary facilities to provide effective referral services. Table 3 show the distribution of healthcare facilities in Nangere local government area,thedistributionindicatesthatDazigau, Degubi, Darin, Pakarau, and Tikau have five (5) healthcare facilities, Dawasa/Garin Baba, Kukuri, Nangere and Watinani have four (4) healthcare facilities, while Dadiso has three (3) healthcare facilities and Chilariyehavetwo(2)healthcarefacilities.It’s clear from the distribution that Dazigau, Degubi, Darin, Pakarau, and Tikau have the highest number of healthcare facilities while Chilariye has the least number of healthcare facilities, this shows that health care facilities are not evenly distributed in Nangere LGA. This agrees with the findings of Abbas et al., (2012) which revealed that there was inequality in the distribution of Health Care facilities in Chikun LGA of Kaduna State, the public health centers were found to be clustered along the Eastern part of Chikun LGA in Kamazou, Kujama, Kakau, Sabon Gaya districtswhile6(33.4%) ofthepublichealthcenters werefoundat the southern part of the study area in Chikun and Gwagwada districts and none existed at the northwestern part of the study area. A similarity can be drawn with a study conducted by Mohammed et al., (2015) that revealed inconsistency in the distribution of health faculties in Giwa LGA of Kaduna state. The table further revealed that out of the 46 healthcare facilities in the study area only 1 is general hospital (GH) which is the major healthcare facility in the local government (LG) mostly provide intensive care, critical care and long-term care, whichis in line with the minimum requirement for LGA in Nigeria, to serve as a referral center for primary health facilities in the LGA, 14 were health posts (HP) which provide mostly preventive services with little or no clinical care; 10healthclinics(HC)which were to be peripheral health facility; 5 dispensaries (D)whichfocusedondispensesmedications,3were maternity center(MC) mainly proved maternity services, 2 primary healthcare (PHC) which were intermediate health facility and 11 primary healthcare centre’s (PHCC) serving as the referral for the health clinics and primary health centre’s respectively, this indicate that majority of the healthcare facilities in the study area are health posts with only one secondary healthcare facilities. Table 3: Distribution of Health Care Facilities Ward HCF GH PHCC MC HP D HC PHC Chilariye 2 0 1 0 1 0 0 0 Dadi/Chikuriwa 3 0 1 0 2 0 0 0 Dawasa/Garin Baba 4 0 1 1 0 2 0 0 Dazigau 5 0 1 0 2 1 1 0 Degubi 5 0 1 0 3 0 0 1 Kukuri/Chiromari 4 0 1 1 0 1 1 0 Darin/Langawa 5 0 1 0 4 0 0 0 Nangere 4 1 1 0 0 0 2 0 Pakarau 5 0 1 1 0 0 3 0 Tikau 5 0 1 0 2 0 1 1 Watinani 4 0 1 0 0 1 2 0 Total 46 1 11 3 14 5 10 2 HCF= Health Care Facility, GH= General Hospital, PHCC= Primary Health Clinic, MC= Maternity Center, HP= Health Post, D= Dispensary, HC= Health Clinic, PHC= Primary Health Care. Source: Author’s analysis, 2021 However, Figure 1 shows the visual distributionofHCFsinNangereLGA.ThePrimaryhealthcarecentersareevenlydistributed across the study area but other healthcare facilities are unevenly distributed, this might beattributedtothedenser population of those areas and other location factors. This goes in line with (Wang, 2011) that said series of location factors may be responsible for the distribution of Health Care facilities in an area, the factors may include population size, easy access to the facility from other nearby settlements, availability of approachable roads, mode of transport orimpedimentlikewater bodies, forest, and rugged terrain, etc. This agrees with the findings of Abbas et al., (2012) which revealed that there was inequalityin the distribution of health care facilities in Chikun LGA of Kaduna State, the public health centers were found to be clustered along the Eastern part of Chikun LGA in Kamazou, Kujama, Kakau, Sabon Gaya districts while 6 (33.4%)of the public health
  • 5. International Journal of Trend in Scientific Research and Development (IJTSRD) @ www.ijtsrd.com eISSN: 2456-6470 @ IJTSRD | Unique Paper ID – IJTSRD42527 | Volume – 5 | Issue – 4 | May-June 2021 Page 1221 centers were found at the southern part of the study area in Chikun and Gwagwalada districts and none existed at the northwestern part of the study area. A similarity can be drawn with a study conducted by Mohammed et al., (2015) that revealed inconsistency in the distribution of health facilities in Giwa LGA of Kaduna state. Figure 1: Spatial Distribution of Health Care Facilities Source: Author’s Analysis, 2021 The distribution pattern of health care facilities in the study area was determined by the average nearest neighbor in the ArcGIS 10.8 software interface. The average nearest neighbor analysis calculates the nearest neighbor index, which is a measure of the distance between each facility centroids and its nearest neighbor’s centroid location. These parameters were used as the basis for determining whether the distribution is random, dispersed, or clustered. The spatial patternof thehealth care facilities in the study area is shown in Figure 2 while the average nearest neighbor statistics is shown in Table 4. Table 4: Summary of Average Nearest Neighbor Statistics Average Nearest Neighbor Summary Observed Mean Distance: 3301.1390 Meters Expected Mean Distance: 3032.8676 Meters Nearest Neighbor Ratio: 1.088455 z-score: 1.135162 p-value: 0.256307 Source: Author’s Analysis, 2021 The result presented in Figure 2 shows the average nearest neighbor summary for the study area; the significant level andthe critical level which indicates a random distribution pattern of healthcarefacilitiesinthearea.Furthermore,Table4 showsthat the nearest neighbor ratio for the spatial pattern of health care facilities in thearea is1.088455witha critical value(z-score)of 1.135162 at 0.256307 level of significance (p-value), according to Getis&Ord (1998), the z-score usually returns a range of
  • 6. International Journal of Trend in Scientific Research and Development (IJTSRD) @ www.ijtsrd.com eISSN: 2456-6470 @ IJTSRD | Unique Paper ID – IJTSRD42527 | Volume – 5 | Issue – 4 | May-June 2021 Page 1222 values between -2.58 to 2.58; therefore, a positive z-score less than 2.58 indicates a significant clustering at 0.01 probability level. A range of scores between both 2.58 to -1.96 at 0.05 significant levels and -1.96 to -1.65 at 0.10 probability level shows that there is a tendency towards a clustered pattern. A range of z-scores between -1.65to1.65indicatesa randomdistribution. Again, if the z-score lies between both 1.65 to 1.95 at 0.10 significance level and 1.96 to 2.58 at 0.05 significance level then it is obvious that there is a tendency towards a regular pattern. Therefore,sincethez-scoreisapproximately1.14whichislessthan the standard critical value of 2.58 as measured by (Getis&Ord, 1998), then the pattern is significantly even which greaterthan 1% (0.01 level of significance), this affirms that the location pattern of Health Care Facilities in the study area is statistically random. Figure 2: Pattern of Health Care Distribution Source: Author’s Analysis, 2021. On the contrary, the result further differs with many research findings, including among the other, the work ofKibon&Ahmed (2012) who discovered that pattern of health care facilities in the Kano metropolis, Kano State of Nigeria was clustered and haphazardly distributed. Likewise, Musa &Abdulhamed (2012) findings revealed that the health care facilitiesinJigawa State, Nigeria were unevenly distributed. Also, Umar (2016) in his study of the spatial distributionofhealthcarefacilitiesintheKano South senatorial zone revealed that the location pattern of primary health care facilities in the area wasdispersedasshownby the Average Nearest Neighbor analysis. CONCLUSIONS In conclusion, this study was able toidentifyandmappedthe health care facilities across the entire 11 geo-political wards of Nangere Local Governmentarea ofYobestate;thefindings revealed the total number of health care facilities across the 11 geo-political wards of NangereLocal Government area and the distribution suggests that health care facilities are not evenly distributed in the area. The study identified 46 physical healthcare facilities distributed across space, categories into two, namely, primary health care (PHC) facilities which are mostly provided by the state or local government constitutes the highest percentage 98% (45) while the secondary healthcare (SHC) constitutes 2% (1), this signified that primary health care facilities are predominant in the study area. Further, disaggregating the PHC, 14 were health posts; 9 health clinics; 5 dispensaries, 6 primary health care and 11 primary healthcare centers (PHCC). Health Care Facilities in the study area are statistically random, the study area is fairly provided with primary health care facilities. However, it was unevenly distributed given the concentration of health care facilities in Dazigau, Degubi, Darin, Pakarau, and Tikau while other wards were inadequately served. Thus, this disparity in the distribution of health facilities has generated differentaccessibilitylevels to health care facilities in the LGA. The study concluded that there were inequalities in the spatial distribution of healthcare facilities in the Nangere Local Government Area of Yobe state, thus this disparity in the distribution of health facilities has generated differentaccessibilitylevelstohealth care facilities in the LGA. In light of the problems associated with inequalities in the spatial distribution revealed in this study; it, therefore, recommendsthat;GovernmentandNon- governmental organizations should provide health care facilities in the wards that do not have enough health care facilities. This will further improve access to Health Care facilities in the study area.
  • 7. International Journal of Trend in Scientific Research and Development (IJTSRD) @ www.ijtsrd.com eISSN: 2456-6470 @ IJTSRD | Unique Paper ID – IJTSRD42527 | Volume – 5 | Issue – 4 | May-June 2021 Page 1223 REFERENCES [1] Abbas, I. I., Auta, S. Z., & Muhammad, R.(2012).Health Care Facilities Mapping and Database Creation Using GIS in Chikun Local Government, Kaduna State, Nigeria. Global Journal of Human, Social Science. Geography & Environmental GeoSciences, 12(10). [2] Burrough, P. (2001). Principles of Geographic Information Systems Spatial Information Systems and Geo-informatics. Oxford University Press. [3] Cromley, E. K., & McLafferty, S. (2002). GIS and public health. Guilford Press. [4] Getis, A., & Ord, J. K. (1998). Spatial analysis: Modeling in a GIS environment. In P. Longley, & M . Batty (Eds.), Local spatial statistics. John Wiley & Sons. [5] Ghosh, D. (2001). Participatory Mapping as a Component of Operational Malaria Vector Control in Tanzania.In Geospatial Analysis of Environmental Health. Geotechnologies and the Environment, 4(1). https://doi.org/DOI 10.1007/978-94-007-0329-2_7 [6] Glass, G., Schwartz, B., Morgan, J., Johnson, D., Noy, P., & Israel, E. (1995). Environmental risk factors for Lyme disease identified with GIS.AmericanJOurnalof Public Health, 85(7), 944–948. [7] INEC. (2019). Polling unit locator tool. Independent National Electoral Commission. [8] Kibon, U. A., & Ahmed, M. (2012). Distribution of primary health care facilities in Kano metropolis using GIS (Geographic Information System).Research Journal of Environmental and Earth Science, 5(4). https://doi.org/https://doi.org./10.19026/rjees.5.57 10 [9] Lovett, A., Parfitt, J., & Brainard, J. (2006). UsingGISin risk analysis: a case study of hazardous waste transport. Risk Anal, 17(5), 625–633. [10] McMaster, R. (1988). Modeling community vulnerabilitytohazardousmaterialsusinggeographic information systems. Proceedings, ThirdInternational Symposium on Spatial Data Handling, 143–156. [11] Mohammed, I., Musa, I. J., Salisu, A., Kim, I., Oyalem, A. M., & Maiwada, A. (2015). Analysis of accessibility to health care facilities in Giwa and Tofa Local Government areas of Nigeria: GISapproach.Journalof Scientific Research and Reports, 3(22), 2900–2915. [12] Musa, I. J., & Abdulhamed, I. (2012). The Accessibility problems of primary Health Care to rural people in Jigawa state, Nigeria. Global AdvanceResearchJournal of Social Science, 1(4), 72-76. https://doi.org/http://garj.org/garjss/index.htm [13] Natinal Population Commission. (2021). National housing Demarcation Survey. NPC. [14] Openshaw, S., Charlton, M., & Craft, A. (1988). Searching for leukemia clusters using a geographical analysis machine. A Paper Presentedatthe11thWorld Conference of the Society for International Development, 64:95–106. [15] Wang, L. (2011). Analyzing spatial accessibility to health care: a case study of access by different immigrant groups to primary care physicians in Toronto. Annals of GIS, 17(4), 237–251. https://doi.org/https://doi.org/10.1080/19475683. 2011.625975 [16] Wartenberg, D. (1992). Screening for lead exposure using geographic informaiton system. EnvironMental Resources, 59(1), 310–317. [17] Wartenberg, D., Greenberg, M., & Lathrop, R. (1993). Identification and characterization of populations living near high-voltage transmission lines. Environmental Health Perspect, 101(7), 626–631. [18] WHO. (1997). Geographic Information Systems and Public Health Mapping. World Health Organization. [1]