Downloaded 568 times
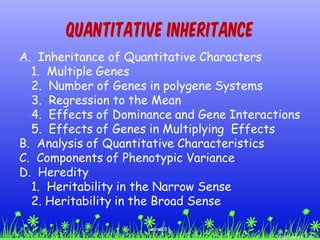
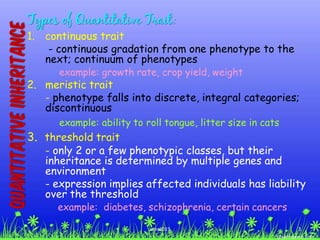
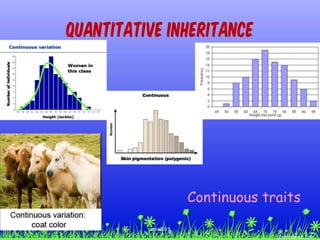
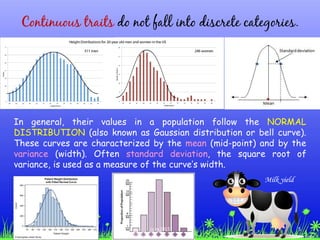
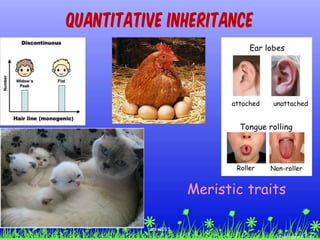
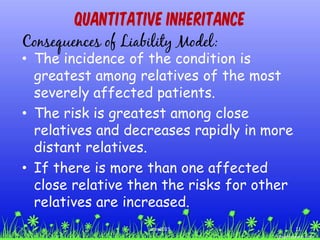
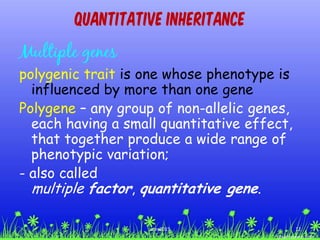
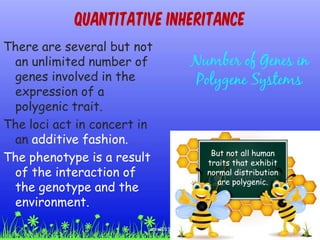
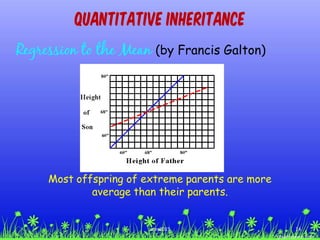
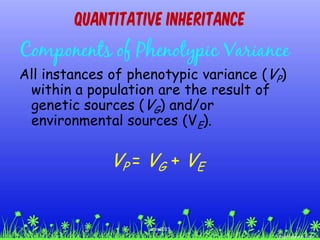
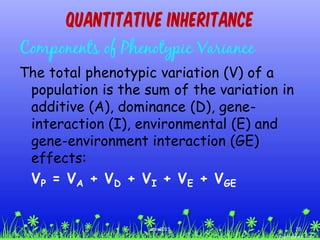
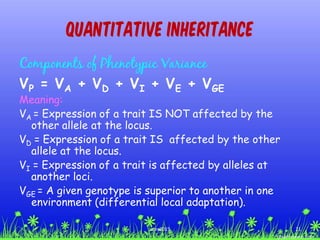
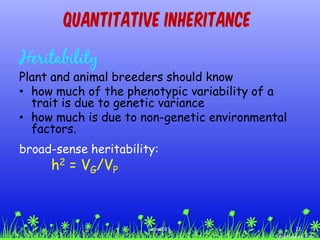
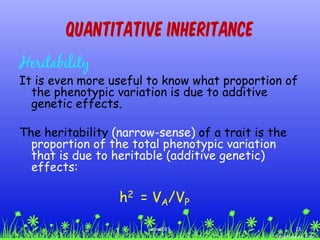
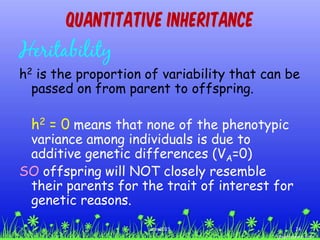
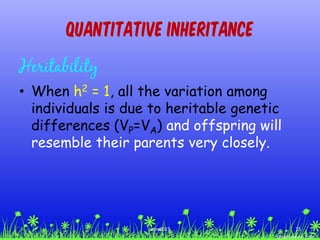
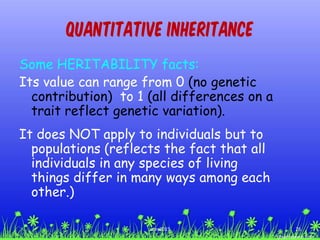
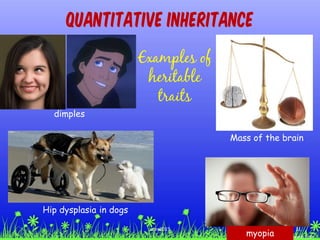

The document discusses quantitative inheritance, covering the inheritance of quantitative traits influenced by multiple genes, including continuous, meristic, and threshold traits. It explores concepts such as heritability, components of phenotypic variance, and the role of environmental factors in expressing these traits. Regression to the mean and the importance of understanding genetic versus non-genetic sources of variation are also emphasized.